Public appointments - data: 2018 and 2019
Public appointments demographic data comparison and commentary on 2018 and 2019 data.
Applications and appointments: detail
Gender
Women are 51% of the population. The percentage of applications from women was 43% in 2018 and in 2019. The target for applications for women is at least 40%. Although we do not receive the same percentage of applications from women as the percentage of the population, we have exceeded the 40% target.
In 2019, 55% of applications were from men - a slight increase on the 54% in 2018.
Of the applications received in 2018,
- 43% came from women,
- 54% came from men, and
- 3% preferred not to disclose their gender.
Of the applications received in 2019,
- 43% came from women,
- 55% came from men, and
- 2% preferred not to disclose their gender.
In 2018 more women than men were appointed while in 2019, more men than women were appointed. In 2019 and in 2018, women were appointed at a rate higher than their rate of application.
Of the appointments made in 2018,
- 44% were men,
- 52% were women, and
- 4% preferred not to disclose their gender.
Of the appointments made in 2019,
- 52% were men and
- 48% were women.
Ethnicity
The target for applications to public appointments from people from a black or ethnic minority background is 8%. In 2018 6% of applications were from people from ethnic minority backgrounds, this rose to 9% in 2019, exceeding the target of 8%.
Of the applications received in 2018,
- 6% of applications came from individuals from a black or minority ethnic background.
- 89% of applications came from white individuals, and
- 5% preferred not to disclose their ethnicity.
Of the applications received in 2019,
- 9% of applications came from individuals from a black or minority ethnic background.
- 89% of applications came from white individuals and
- 2% preferred not to disclose their ethnicity.
In 2019, 6% of the people appointed were from a black or minority ethnic background. This was an increase on 4% in 2018. In 2018 and in 2019, people from a black or ethnic minority background were appointed at a rate lower than their rate of application.
Of the appointments made in 2018,
- 4% of appointees were from a black or ethnic minority background.
- 90% of appointees were white, and
- 6% of appointees preferred not to disclose their ethnicity.
Of the appointments made in 2019,
- 6% of appointees were from a black or ethnic minority background.
- 94% of appointees were white.
Disabled people
The target for applications from disabled people is 15%. In 2019, 13% of applications were from disabled people. Although we did not achieve the target in 2019, it was an improvement on 2018 when 9% of applications were from disabled people.
Of the applications received in 2018,
- 9% of applicants indicated that they had a disability.
- 84% of applicants indicated they had no disability and
- 7% preferred not to disclose any disability.
Of the applications received in 2019,
- 13% of applicants indicated that they had a disability.
- 83% of applicants indicated they had no disability and
- 4% preferred not to disclose any disability.
In 2019, 12% of the people appointed were disabled people. This was an increase on 7% in 2018. Although 12% of people appointed in 2019 is quite close to the 13% of applications received from disabled people in that year, it is still a lower rate. In 2018 also, disabled people were appointed at a rate lower than their rate of application.
Of the appointments made in 2018,
- 7% of appointees indicated that they had a disability.
- 91% of appointees indicated they had no disability and
- 2% preferred not to disclose any disability.
Of the appointments made in 2019,
- 12% of appointees indicated that they had a disability.
- 88% of appointees indicated they had no disability.
Age
In Scotland, the last census in 2011 showed that 54% of the population was aged 18 to 49. We have a target that 40% of applications should be from people in this age group. In 2019, 31% of applications were from people in this age group. This was an improvement on 2018 when 28% of applications were from people in this age group.
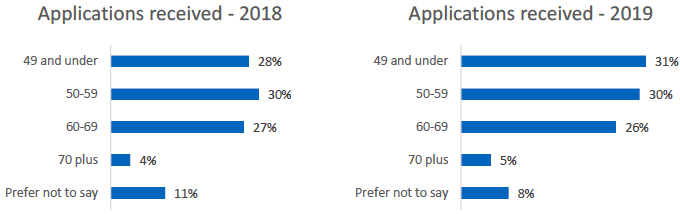
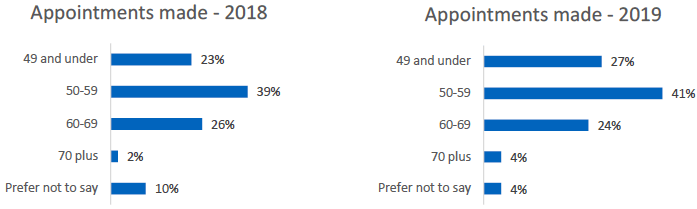
In 2019, 27% of appointments made were to people 49 and under, which was an increase on 23% in 2018. Although the appointment rate was lower than the application rate in 2019 and 2018, this was not the case in 2017 and 2016.
Sexual orientation
In 2019, 5% of applications were from people whose sexual orientation is not heterosexual. That was an increase on 2018's 4%. The target is 6%.
Of the applications received in 2018,
- 4% of applicants indicated that they were not heterosexual.
- 87% of applicants were heterosexual, and
- 9% preferred not to disclose their sexual orientation.
Of the applications received in 2019,
- 5% of applicants indicated that they were not heterosexual.
- 87% of applicants were heterosexual and
- 8% preferred not to disclose their sexual orientation.
In 2019, 4% of appointments were made to people whose sexual orientation is not heterosexual, which was slightly lower than the application rate. That compares to an appointment rate of 7% in 2018, which was higher than the application rate.
Of the appointments made in 2018,
- 7% of appointees indicated that they were not heterosexual.
- 86% of appointees were heterosexual and
- 7% preferred not to disclose their sexual orientation.
Of the appointments made in 2019,
- 4% of appointees indicated that they were not heterosexual.
- 90% of appointees were heterosexual and
- 6% preferred not to disclose their sexual orientation.
Contact
Email: public.appointments@gov.scot