
Planning Applications Statistics 2025/26: Quarterly (April 2025 to September 2025)
Statistics showing the number, type and decision times for planning applications by Planning Authority, National Park and Scotland.
Part of
Local Developments
All Local Developments
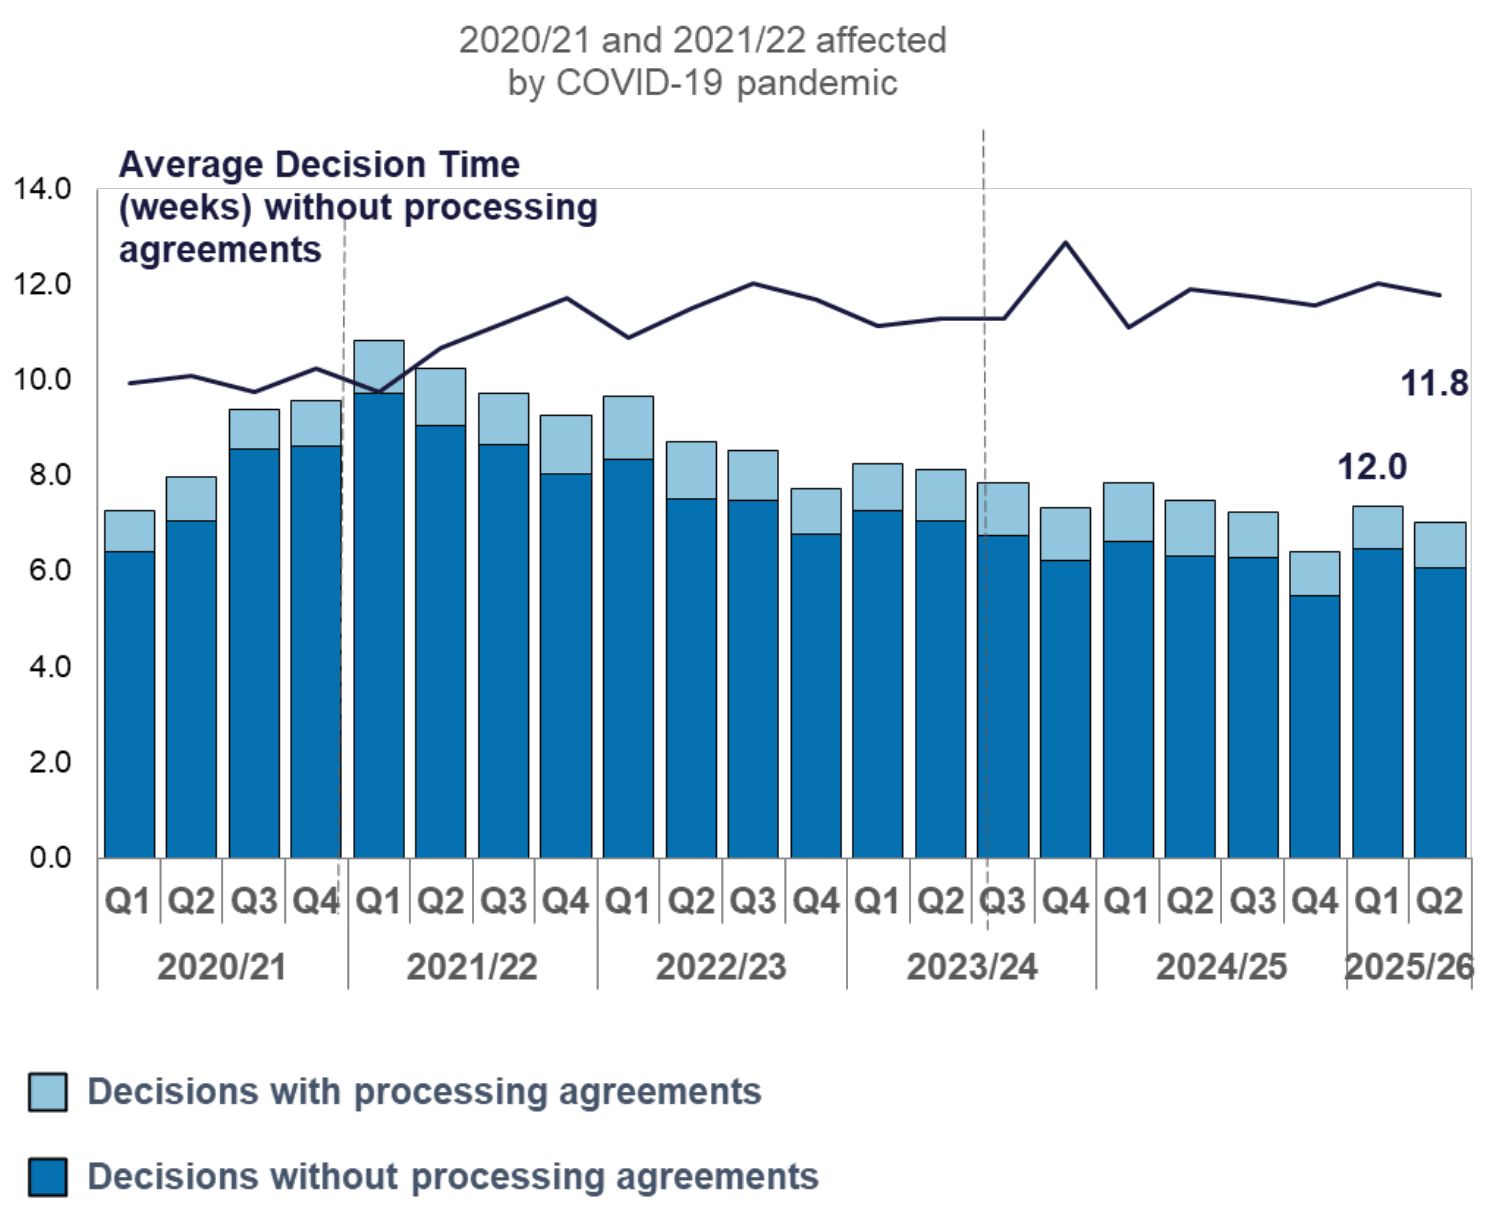
There were 10,256 decisions on local developments in the first two quarters of 2025/26. This was 6.4% per cent lower than the same period in the previous year. The average decision time was 12.0 weeks in Q1 and 11.8 weeks in Q2.
In Q1 there were 639 local development applications with processing agreements and 73.1% met agreed timescales that had been set between developers and local authorities. In Q2 there were 667 with 73.6% meeting the agreed timescales.
Local Housing Developments
There were 1,187 local housing developments not subject to processing agreements decided during the first two quarters of 2025/26. This was 4.7 per cent lower than the same period in the previous year. Average decision times were 18.2 weeks in Q1 and 18.9 weeks in Q2. In Quarter 1, 40.1 per cent of decisions were made in less than two months and 37.5 in Quarter 2. Where processing agreements were in place around 70 per cent met agreed timescales.
Contact
Email: chma@gov.scot