Pig Sector Farmer-Led Climate Change Group: climate change and greenhouse gas evidence
Summary of existing evidence around the pig sector and greenhouse gases.
Evidence for the Pig Sector Farmer-Led Climate Change Group
Briefing
The report highlights evidence on Scotland's pig sector for the Pig Sector farmer-led group, focussing on greenhouse gas emissions.
Sector Emissions
The Scottish Government has committed to reaching net zero emissions by 2045, including a reduction of 75% by 2030. Whilst a number of countries have adopted net zero targets by on or around 2045, Scotland's 2030 target is particularly ambitious and requires quick action.
Scotland has a legal requirement to meet these goals, and every industry must adjust to contribute to reducing emissions. The Greenhouse Gas inventory measures the domestic emissions, i.e. those produced in Scotland. It is the key data source against which Scottish Government measures its progress against its net zero targets. Emissions arising from goods produced in Scotland and exported overseas for consumption are counted in the Scottish GHG inventory. Emissions arising from goods produced overseas and imported into Scotland for consumption are not counted in the Scottish GHG inventory.
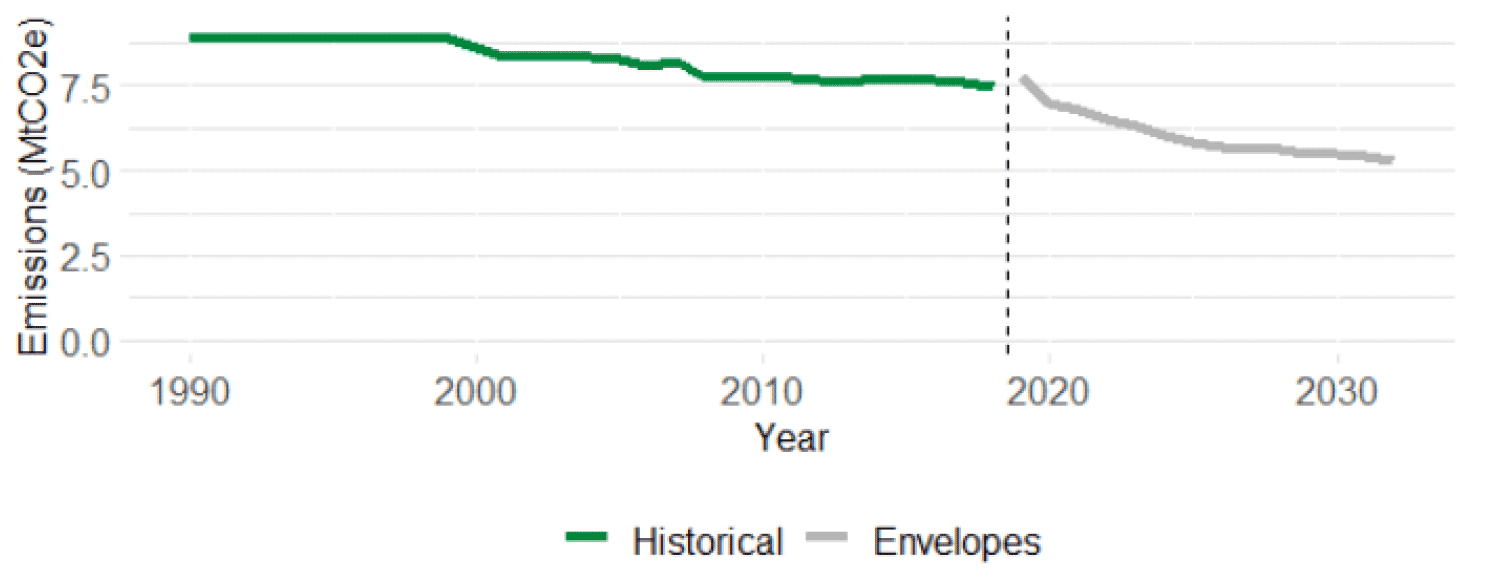
In 2018 total Scottish emissions were 41.6 million tonnes of carbon dioxide equivalent (MtCO2e). The 2019 figures are scheduled to be published in summer 2021.
In 2018 emissions from agriculture were 7.5 MtCO2e, or 18% of Scottish emissions. The sectoral envelope as set out in the Climate Change Plan update requires reductions of agricultural emissions of 2.4 MtCO2e to 5.3 MtCO2e[1] by 2032, a 31% reduction from 2018 levels. As shown below this requires agriculture to reduce emissions at a pace nearly four times faster than historic reductions. Progress towards delivering the plan will be part of statutory annual reporting at a sector-by-sector level, to the Scottish Parliament from May 2021 onwards.
Source: Scottish Greenhouse Gas Emissions 2018 - gov.scot (www.gov.scot), Securing a green recovery on a path to net zero: climate change plan 2018–2032 - update - gov.scot (www.gov.scot)
Note: there is a small break in the series due to a slight mismatch in the historic data and the forecast envelopes
GHG emissions from pigs
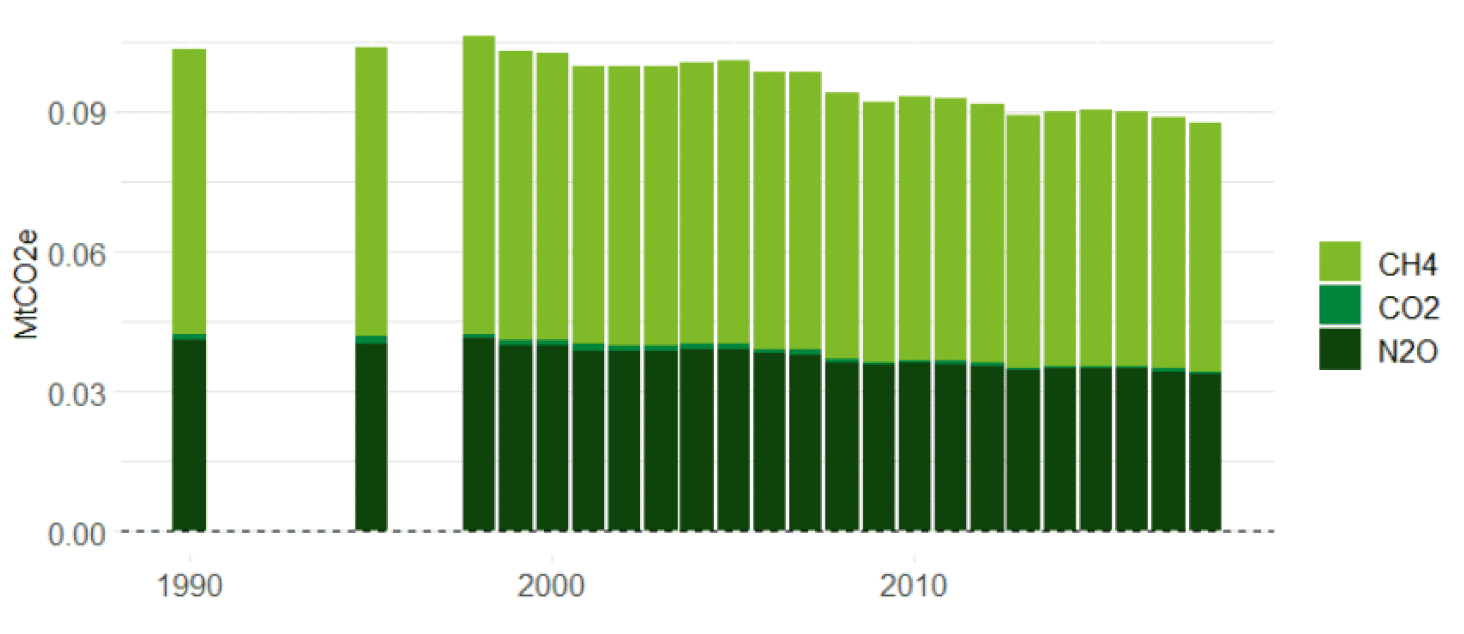
As shown in the chart below pigs contributed 0.09 MtCO2e in 2018, or 1% of agricultural emissions. This is a 0.05 MtCO2e fall since 1990, or 36%, driven by a reduction in emissions from manure management. The number of pigs in Scotland has reduced by nearly 30% over the same period, to around 319,000 in 2019. However, the amount of pig meat produced has increased by around 27% between 2003 and 2019[2].
Source: Scottish Greenhouse Gas Emissions 2018 - gov.scot (www.gov.scot)
Emissions of both CH4 and N2O have reduced by around 35%. CH4 emissions come from manure management and enteric fermentation, and N2O emissions come from atmospheric deposition, fertiliser, manure management, nitrogen leaching and run-off, and urine and dung.
Sources
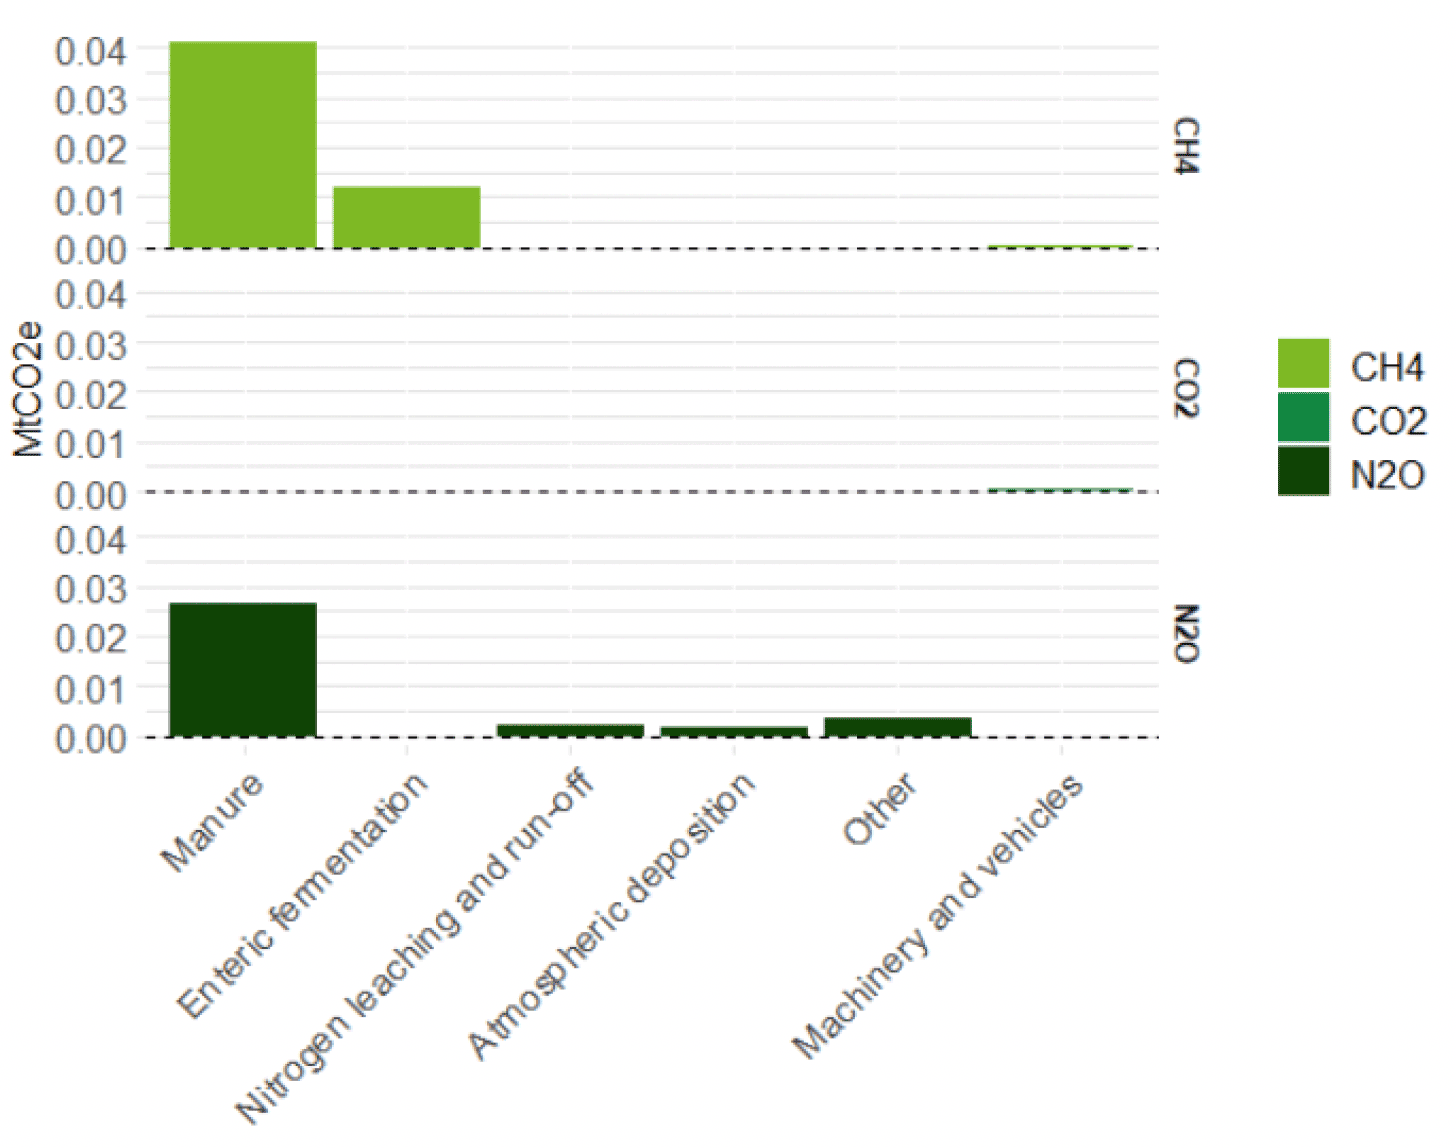
The chart below shows how the 2018 emissions from pigs break down by source and pollutant. Manure management is the largest source contributing 72% of pig emissions with the majority coming from CH4. The next largest source, contributing a further 14%, is enteric fermentation.
Source: Scottish Greenhouse Gas Emissions 2018 - gov.scot (www.gov.scot)
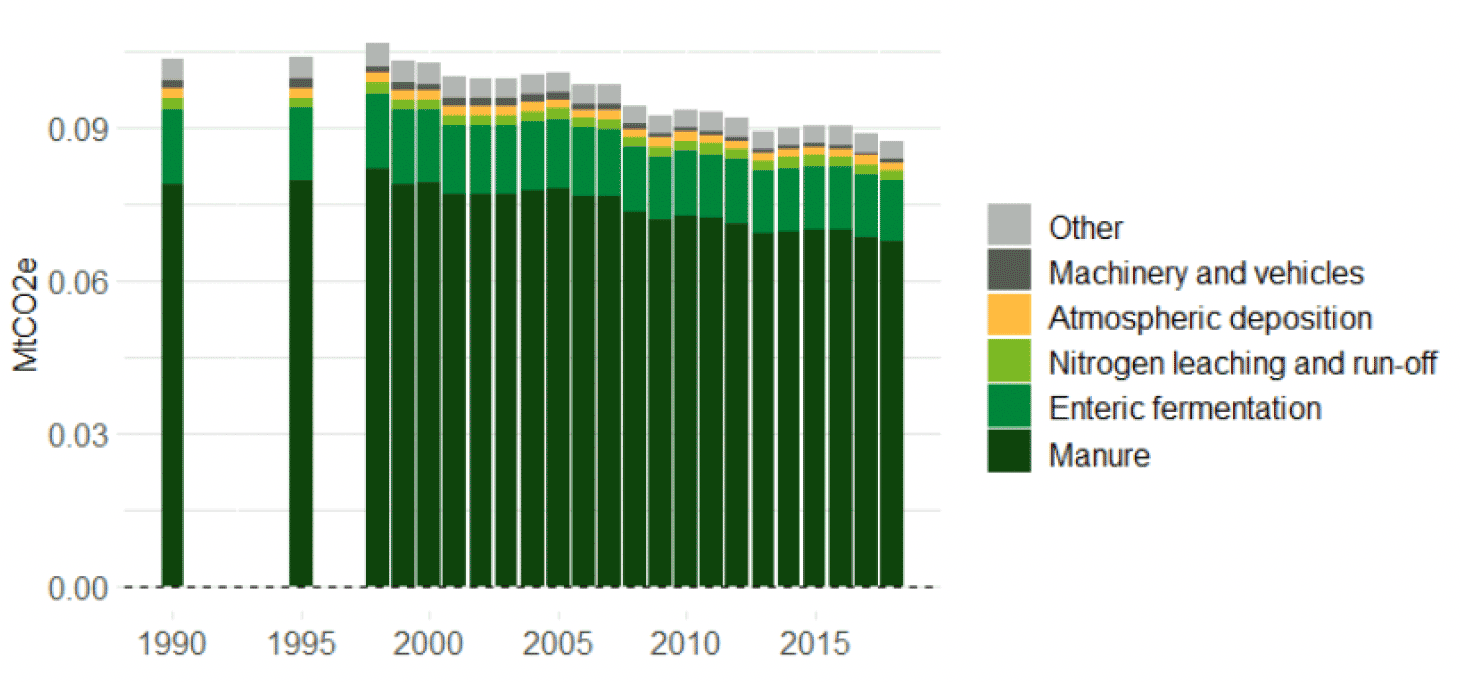
Over time, the largest reduction by source has come from a reduction in total emissions from manure management. Most other sources have shown only small change since 1990, though there has been a small increase in emissions from urine and dung from grazing.
Source: Scottish Greenhouse Gas Emissions 2018 - gov.scot (www.gov.scot)
Potential Savings
Research undertaken by CXC and SRUC on behalf of Scottish Government assessed the potential savings from a range of mitigation measures that could be applied in Scotland and the likely maximum uptake that could be achieved. The report did not assess timescales for uptake of these measures, which will be influenced heavily by factors such as behaviour change and policies. The table below summarises the two measures that could be applied to pigs. Estimates of the aggregate emissions savings have been added based on most recent data on numbers of pigs, around 319,000 in 2019 .
Sources of climate change mitigation in the pig sector
| Mitigation measure | Maximum uptake 2050 | Per unit mitigation (kg CO2e) | Aggregate Mitigation (MtCO2e) |
|---|---|---|---|
| Precision feeding of livestock | 90% | 25 | 0.006 |
| Impermeable slurry store covers | 26% | 86 | 0.006 |
| Additive total | .. | 111 | 0.012 |
Source: Marginal abatement cost curve for Scottish agriculture (climatexchange.org.uk)
Strictly speaking the 'additive totals' overstate the savings as some measures may interact and reduce the impact of other measures. However these interactions were assessed to be relatively low.
If each of these measures were applied to their maximum potential as identified in the report, estimated reductions from emissions based on pig numbers would be in the region of 0.012 MtCO2e. This would be a reduction of around 13% of emissions from the pig sector, or 0.5% of the 2.4 MtCO2e reductions required by agriculture by 2032. This would fall short of the 31% reduction in GHG emissions needed from agriculture as a whole.
It is important to note that the figures above are average estimates that were provided for Scotland as a whole. Further, on an individual farm basis, both the mitigation and the net costs (below) can be very different and some measures above cover a wide range of possible actions which would be demanding to assess individually. Therefore the GHG benefits achieved and costs could vary widely.
Further details on each of these measures, such as costs, underpinning assumptions, constraints and potential uptake can be found in the Annexes to the CXC on pages 43-53.
As set out within the CCC report, there is scope for all sectors in agriculture to mitigate their operational GHG emissions through other practises and alternative land use such as those to encourage carbon sequestration.
However, precise estimate and demonstration of the sector's scope/ability to do this is limited. Likewise, as also set out within the CCC report, wider changes may be needed to meet the targets, including changes in farming practices and changes to consumer diets.
Costs
Some of these measures would involve the purchase of capital equipment with upfront costs. The table below shows the net costs to farmers including capital costs on an average annual basis. These do not include any wider costs such as those to Government or Research and Development from developing measures. Negative figures below show a net saving to the farmer, i.e. if implemented they would provide a financial saving to the farmer as well as a reduction in emissions. Based on current pig levels the average potential saving to the sector is around £0.16m.
Sources of climate change mitigation in the pig sector
| Mitigation measure | Per unit annualised cost (£) | Aggregate Cost (£m) |
|---|---|---|
| Precision feeding of livestock | -0.87 | -0.19 |
| Impermeable slurry store covers | 0.52 | 0.03 |
| Additive Total | -0.16 |
Source: Marginal abatement cost curve for Scottish agriculture (climatexchange.org.uk)
Current Uptake and Implementation Constraints
This section contains a brief summary of some of the key issues relating to each of the measures outlined in the tables above, drawing heavily on the CXC report.
Precision feeding of livestock
Precision feeding is primarily applicable to housed animals that can be monitored at regular intervals, with that information used to adjust rations. For pigs, this may involve regular weighing of animals and adjustment based on weight and growth, and supplementation with amino acids.
Phase feeding is believed to be implemented widely in the pig industry, and the improvement is expected to be a shift to multiphase feeding. Installation costs are high, meaning large units are seen as more likely to implement these systems; since Scottish pig production is concentrated in large units, potential uptake is high.
Impermeable slurry store covers
Covers can include floating, rigid, natural crust and suspended covers. Covers can reduce ammonia emissions, thereby reducing indirect nitrous oxide emissions, and increases the fertiliser value of the slurry, though there is a risk for higher losses when slurry is applied unless low-ammonia emission techniques are implemented.
Slurry covers can be installed on all slurry tanks and lagoons and costs are relatively low. However, some types of cover are not yet well tested for durability, and build ups of methane under covers can pose a risk unless additional devices are used.