Nitrous Oxide emissions associated with 100% hydrogen boilers: research
Research to measure the gas composition of flue gas from hydrogen boilers under normal, real world operating conditions, with a view to establishing what, if any, greenhouse gases are emitted during combustion.
Appendix 1 – Test results and derived data
Calculations (Emission Factor)
N2O measurements should be expressed as dry air-free (daf) at 0% O2.
The actual measurement results are for a wet gas at the measured oxygen value so it is necessary to convert these values first.
Firstly convert to the dry condition.
N2O (dry) = N2O, ppm (wet) x 100 / 100-H2O%
Convert to air-free
N2O (daf) = N2O (dry) x 21 / 21-%O2 (dry)
Calculate result expressed as N2O, CO2e kg/kWh
N2O, CO2e kg/kWh = N2O (daf) x 44/22.4 x 0.632 x 265/1,000,000
Where CO2e = CO2 equivalent value, 1 mg N2O = 265 mg CO2
44 = Molecular weight of N2O
22.4 = Molar gas constant at standard temperature and pressure
0.632 = volume(m3) of dry stoichiometric combustion products per kWh
265 = CO2e
Divide by 1,000,000 to convert from mg to kg
Calculation of Annual Emission
The annual emission figure is based on the emission concentrations recorded and the boiler operation. Since the demand on the boiler varies over the course of a year due to changing temperatures, an estimation of the boiler operation as a percentage of high firing is made in accordance with the guidance in:
BS EN 15502-1:2021, Gas-fired Heating Boilers – General Requirements and Tests.
This method applies a weighted average based on the typical percentage of time spent at e.g. low moderation (summer) or high-modulation (winter).
So the table below shows that for 60% of the year, the boiler is typically operating at 20 or 40% of its maximum and only at 70% capacity for 15% of its annual operation.
| Output (%): | 20 | 40 | 60 | 70 | 100 |
|---|---|---|---|---|---|
| Weighting (-): | 0.30 | 0.30 | 0.25 | 0.15 | 0.00 |
Results, Hydrogen Boiler Test
Boiler
Boiler 1.
Property
2 bed semi-detached, 1 ½ bathrooms
Radiators
2 - Living room 1 – Kitchen ½ - Downstairs hall ½ - Downstairs bathroom 2 – Bedroom 1 – Towel rail upstairs bathroom
Summary of Results
| Time | Operational Mode | As Measured | @21% O2 | Calculated | @21% O2 | Calculated | |||||
|---|---|---|---|---|---|---|---|---|---|---|---|
| NO, ppm Dry | N2O, ppm Wet | O2, % Dry | H2O, % | NO, ppm Dry | NOx, daf (mg/kWh) | N2O, ppm Dry | N2O, ppm Dry | N2O, daf (mg/kWh) | CO2e kg/kWh | ||
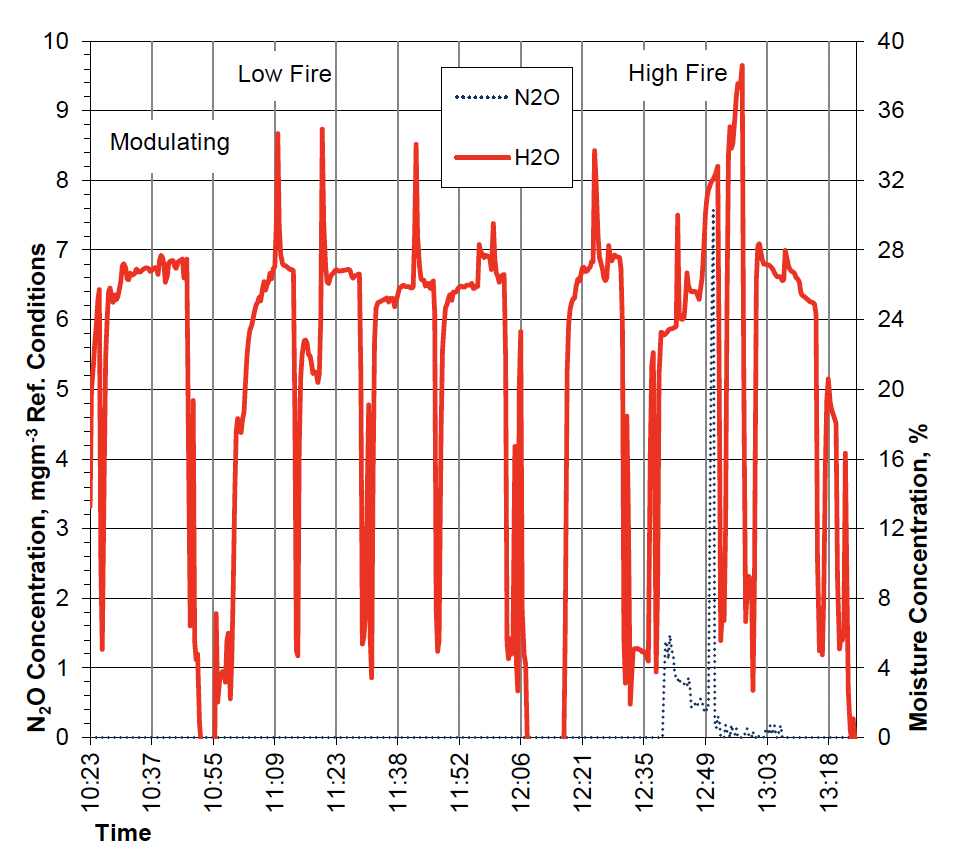
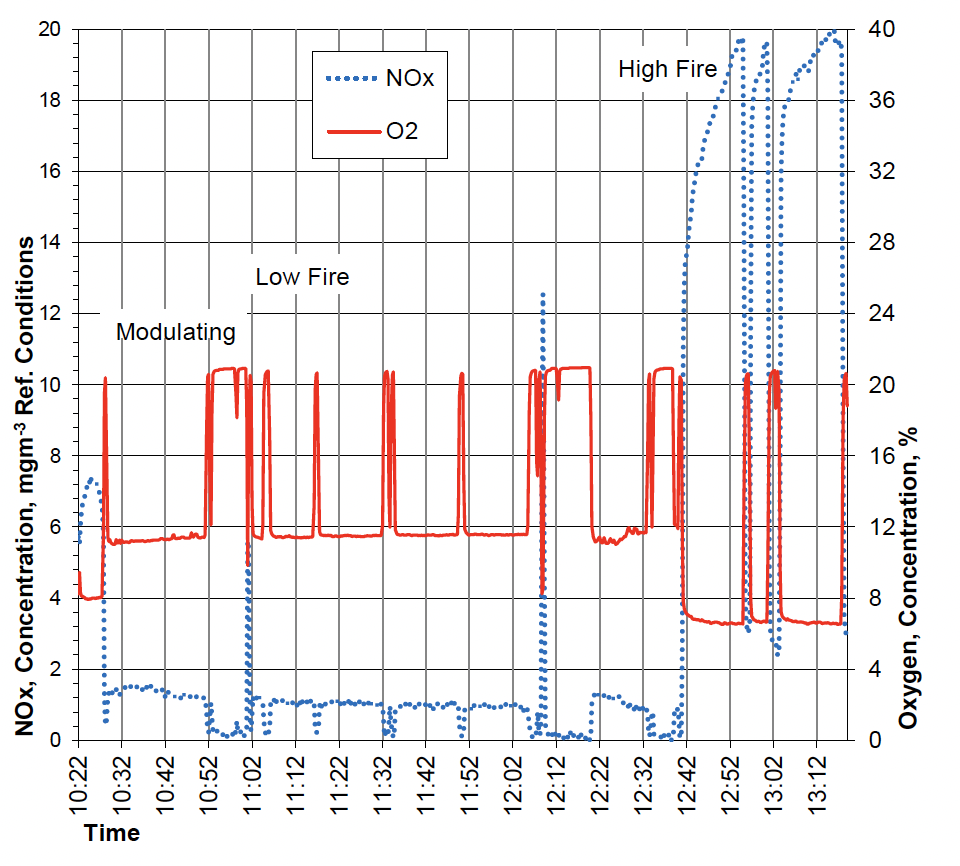
| 10:30–10:51 | Modulation | 1.4 | 0.00 | 11.3 | 25.3 | 3.0 | 3.9 | 0.00 | 0.00 | 0.00 | 0.00000 |
| 11:07 – 11:31 | Low Fire | 1.0 | 0.00 | 11.5 | 24.8 | 2.2 | 2.9 | 0.00 | 0.00 | 0.00 | 0.00000 |
| 11:36 – 12:05 | Low Fire | 0.9 | 0.00 | 11.6 | 25.0 | 2.0 | 2.6 | 0.00 | 0.00 | 0.00 | 0.00000 |
| 12:22 – 12:32 | Low Fire | 1.1 | 0.00 | 11.4 | 26.5 | 2.4 | 3.1 | 0.00 | 0.00 | 0.00 | 0.00000 |
| 12:42 – 12:55 | High Fire | 17.3 | 0.20 | 6.8 | 27.2 | 25.6 | 33.2 | 0.27 | 0.41 | 0.50 | 0.00013 |
| 13:04 – 13:22 | High Fire | 17.4 | 0.30 | 6.8 | 26.0 | 25.7 | 33.4 | 0.41 | 0.60 | 0.74 | 0.00020 |
N2O, CO2e kg/kWh value calculated using data from the IPCC Fifth Asessment Report “Global Warming Potential Values”.
1 tonne N2O = 265 tonnes CO2
NOx and N2O values measured or calculated on a dry air-free basis (daf)
| Output (%): | 21.3 | 20 | 40 | 60 | 70 | 100 |
|---|---|---|---|---|---|---|
| Weighting (-): | 0.30 | 0.30 | 0.25 | 0.15 | 0.00 | |
| N2O, daf(mg/kWh) | 0.00 | 0.12 | 0.25 | 0.37 | 0.44 | 0.62 |
Weighted average: 0.272 N2O, daf(mg/kWh)
Weighted CO2 equivalent: 0.00007 CO2e kg/kWh
Notes:
Weighted against the operating load. Typically, a domestic boiler is rarely at a high fire rate.
Modulation – This mode is similar to normal operation of the boiler in a domestic setting with the central heating at a comfortable level and hot water not in use.
Low fire – Chimney sweep mode was set to force the boiler into low fire mode, central heating turned up slightly.
High Fire – Chimney sweep mode was set to force the boiler into high fire mode, central heating turned up high, hot water taps running.
The tests were limited to typical domestic usage. Future tests should be carried out in maintenance mode, which allows the boiler engineer greater control, e.g. prolonged sampling with step changes in boiler modes.
Contact
Email: 2024heatstandard@gov.scot