Neurological Care and Support in Scotland: A Framework for Action 2020-2025 - Final Report
A final report detailing a summary of the Neurological Care and Support in Scotland: A Framework for Action 2020-2025.
Funded Project Data
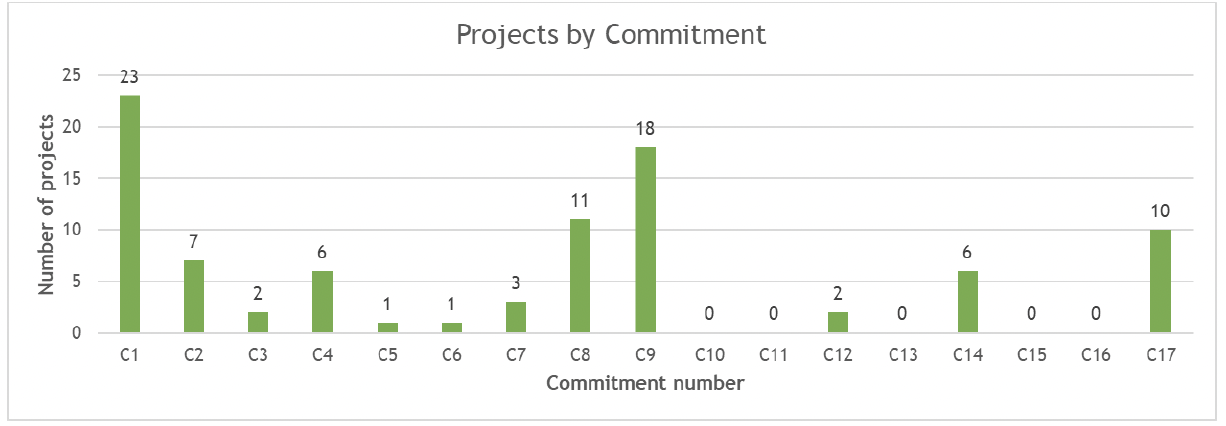
Of the 42 funded projects that completed and submitted final reports, many had relevance across a number of different commitments. In this chart each project was categorised under a maximum of three commitments.
Quantitative Impact
Project reports often provide quantitative data on the number of people with lived experience and professionals they have worked with, though not all projects included such data. Data only covers the period of funding reported on. If projects have continued beyond the period of funding the number of people engaged with will be greater.
25/43 projects included quantitative data. They worked with 7,768 people with neurological conditions or those caring for them. 10/43 projects worked with 3,887 professionals. The G-AP training resource extrapolated service user numbers by numbers of professionals who underwent the training against estimated caseload of each team. This estimate has been included in the above data (n. 2,000).
The FND resource, neurosymptoms.org, has not been included in service user/professional data but is an example of a project having ongoing impact and reach beyond conclusion of funding. This received an average of 60,000 visitors per month internationally from June 2023 – December 2024.
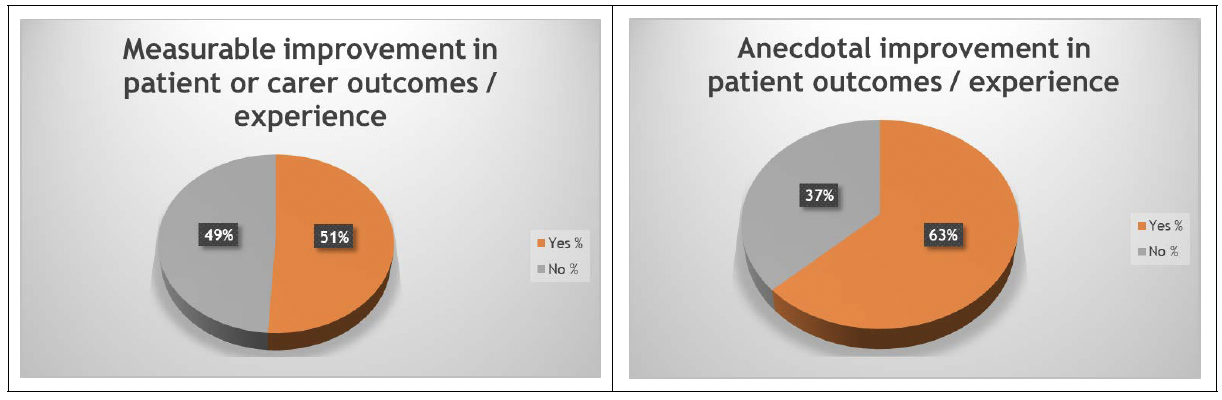
Table 3 charts show the proportion of projects that evaluated their impact directly with people with lived experience and/or carers. The left-hand chart shows 51% of the projects directly evaluated impact using measurable criteria. These ranged from evaluation questionnaires to validated clinical outcomes such as CORE 10 or WEMWBS (ways of measuring improvements in mental wellbeing). Projects such as Thistle Health and Wellbeing, MS Society, and Quarriers Supported Self-management programme demonstrated robust multi-faceted approaches to evaluating benefits to people they worked with. Scottish Epilepsy Register measured patient benefit in terms of improved levels of interaction for high-need individuals.
A higher proportion of projects (right-hand chart) reported outcomes using patient stories or testimonies. Mostly these were used to enhance the measurable impact. A small number of projects only used this approach and did not provide clear metrics of patient benefit. No projects reported interventions making people worse.
For many projects direct evaluation with service users is not relevant. These projects focussed on creating conditions for improving services as the charts in Table 5 demonstrate.
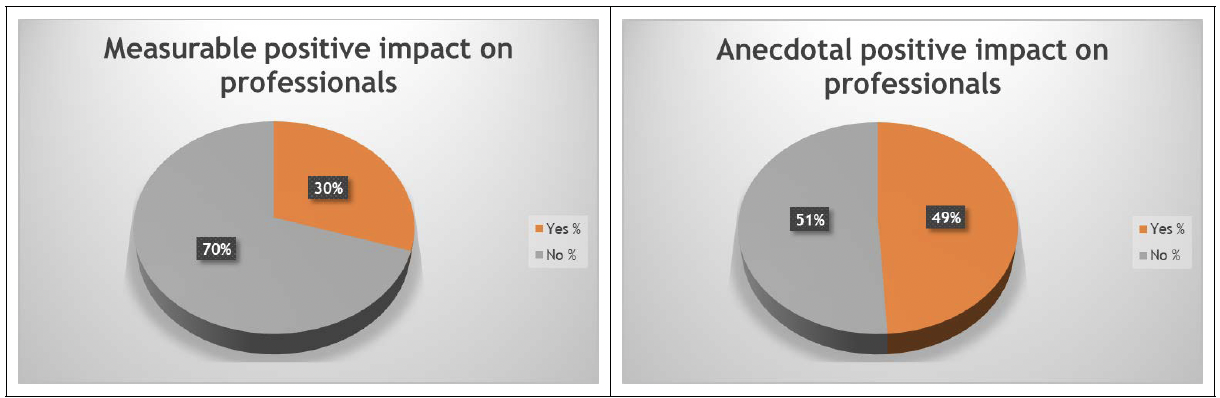
Measurable impact on professionals was often measured through evaluation of training. Anecdotal evidence tends to be where the project has provided professional testimonies. Some projects did not evaluate impact with people they worked with. For example, the duration of the project was spent developing a resource and, whilst this might have been done by engaging with relevant stakeholders, the product was launched and the report written prior to user evaluation being undertaken on the live product.
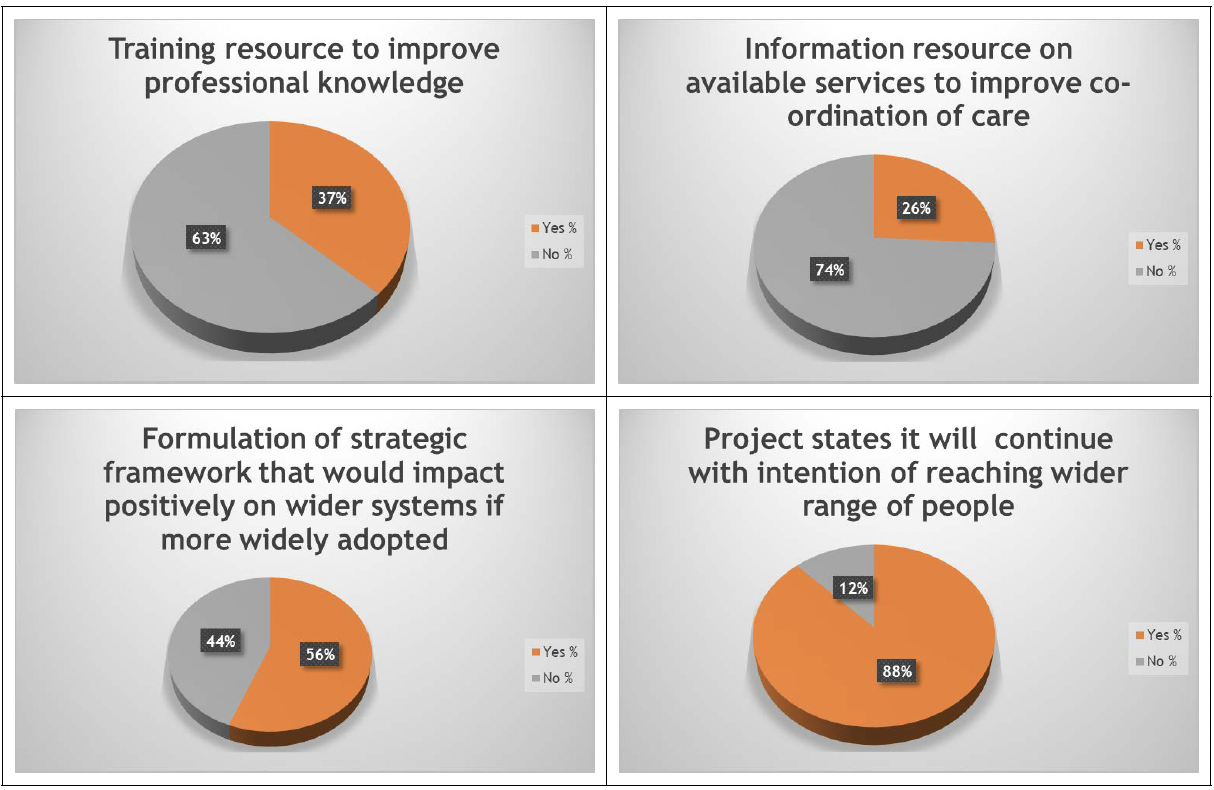
Charts in Table 5 indicate the strategic impact or potential strategic impact of projects. 35% developed a training resource to improve professional knowledge. 26% developed information resources to improve the co-ordination of care. 56% developed a strategic framework that would impact positively on wider systems if more widely adopted. Wider adoption of these approaches will happen because of awareness raising and adoption within health and social care systems, without necessarily requiring large additional investment.
88% of projects indicated in their reports that they will continue with the intention of reaching a wider range of people. This creates substantial opportunities for practice sharing amongst professionals either informally or through the Neurological Conditions Improvement Network, as part of alignment to the General Standards for Neurological Care and Support and local improvement plans.
Contact
Email: longtermconditions@gov.scot