Internal migration in Scotland and the UK: trends and policy lessons
This report by the independent Expert Advisory Group on Migration and Population analyses internal migration within Scotland, and between Scotland and the rest of the UK (rUK), assessing its geographic distribution, dynamics and impacts.
3. Migration Between Scotland and rUK
Data on migration trends between Scotland and rUK are regularly collected by the Office for National Statistics (ONS). Within Scotland these data are provided by the NRS, based on the National Health Service Central Register (NHSCR). In England, a similar approach to measuring migration uses the NHS Patient Register. As we saw in Chapter 2, records of movement are triggered when individuals register with a new GP. We also saw that these data are reliable, but do under-count males, and those moving for a shorter period of time.
Figure 3.1 shows estimates of net migration between Scotland and rUK over the period 1951-52 to 2017-18[3]. During this period, Scotland changed from being a nation that typically experienced a net outflow of population to one where migration had a positive effect on population growth. Between 1951-52 and 2000-01, 399,000 more people left Scotland for other parts of the UK than moved to Scotland from rUK; since mid-2001, population flows from rUK have increased Scotland’s population by 137,000.
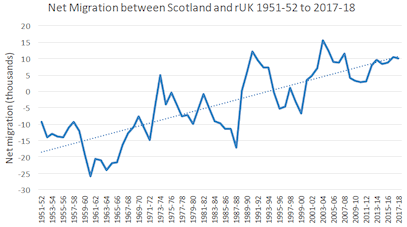
Source: National Records of Scotland
Despite considerable fluctuations, there is clearly an upward trend, and Scotland has gained population from rUK especially since the 2000-2001. However, gross migration (the sum of migration flows between Scotland and rUK) has fallen. The average annual gross flow between 1981-82 and 1999-00 was equivalent to 2.03% of the Scottish resident population. Since then, it has averaged 1.78%, a 12% reduction. Why fewer people are migrating between Scotland and rUK is unclear. Research on internal migration in the UK has shown a decline in migration rates between 1971 and 2011; the levels of short-distance (less than 10km) moves have declined even more than that of longer-distance moves (Champion and Shuttleworth 2017). Possible reasons for the declining mobility rates are population ageing, the increased share of dual-earner couples, the development of telecommunication technologies (i.e. opportunities have opened up to work from home), and the reduced need to change job (and thus move) as labour markets within countries have become more homogeneous and information about opportunities (or the lack of them) elsewhere has improved significantly (Kulu et al. 2018).
Table 3.1 summarises the information in Figure 3.1, dividing the period into 1951-52 to 2000-01 and 2001-02 to 2017-18. It also includes information on net migration between Scotland and overseas to help calibrate its relative importance to population change in Scotland over this period.
| Net migration | Migration flows | ||||||
|---|---|---|---|---|---|---|---|
| Rest of UK migration | Overseas migration | ||||||
| Year | Total | Rest of UK | Overseas | In | Out | In | Out |
| 1951-52 to 2000-01 | -890.6 | -399.3 | -474.2 | ||||
| 2001-02 to 2017-18 | 359.4 | 137.3 | 222.1 | 850.8 | 713.6 | 633.2 | 411.1 |
Source: National Records of Scotland
Two points emerge. First, net migration from rUK and overseas have followed similar patterns before and after the turn of the century, namely a net outflow from Scotland during the 20th century and a net inflow in the 21st century. Second, overseas migration has had a larger effect on the size of Scotland’s population over the entire period than has migration between Scotland and rUK. Whether the pattern that has emerged this century is maintained will depend on the continuing attractiveness of Scotland relative to other locations and on the migration policies of the UK and other governments which affect the ease or difficulty of changing location within the UK or outside the UK. For example, the large net outward flow from Scotland to countries overseas during the last century was possible because many developed, largely English-speaking, countries were seeking to attract migrants at that time and also favoured migrants from English-speaking countries.
Table 3.1 also shows gross flows between Scotland and both rUK and overseas for the period 2001-02 to 2017-18. Gross flow data are not available for the entire period from 1951-52. The data show that even though the net flow between Scotland and rUK is smaller than that between Scotland and overseas, the gross flows between Scotland and rUK are much larger than those to and from overseas locations. This illustrates again the importance of distance acting as a proxy for the costs of migration. Greater distance increases costs and therefore reduces the prevalence of migration.
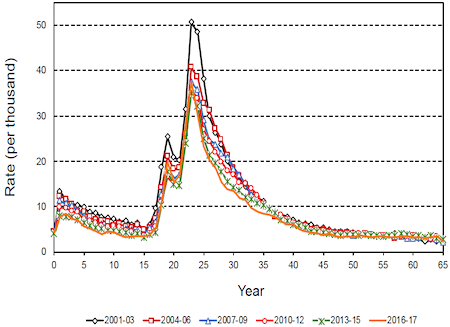
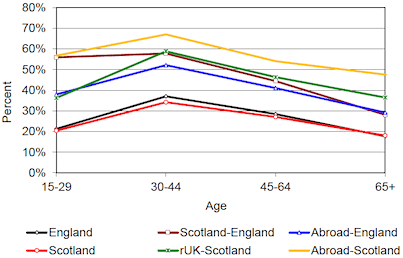
Most people who arrive in Scotland are in the age range 18 to 29. Migration from rUK has two peaks: one is in ages 18-20 and related to the student migration, and another in the late 20s and early 30s. Although analysis shows that women have remarkably higher in-migration rates than men, low migration rates among young men, as noted earlier, are very likely related to an undercount of their moves rather than gender differences; this is also why we report migration rates by age only for women in this study. There is also some migration among the very young, indicating in-migration of couples with children.
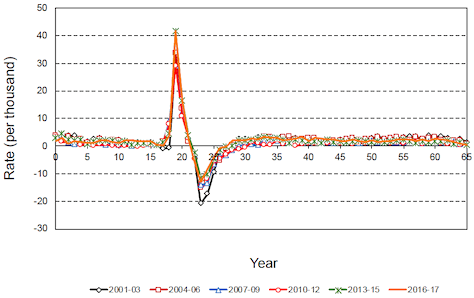
The age pattern of migration has stayed relatively stable over the last two decades, suggesting that student movement dominates migration flows between rUK and Scotland. Out-migration from Scotland to rUK is concentrated in similar age groups as in-migration, except that the peak in ages 18-20 is significantly lower, suggesting that some young people in Scotland leave for England for studies, though the number is low (see figure 3.3). Out-migration rates, especially in the mid and late 20s, have significantly declined over the past decades indicating an increased likelihood of students from rUK staying in Scotland after studies, although many students are still returning back home after studies (and a few years of working) in Scotland. The analysis of trends in net migration supports this observation: Scotland is losing people in ages 22 to 26 to rUK, but in lower numbers than was the case at the beginning of this century).
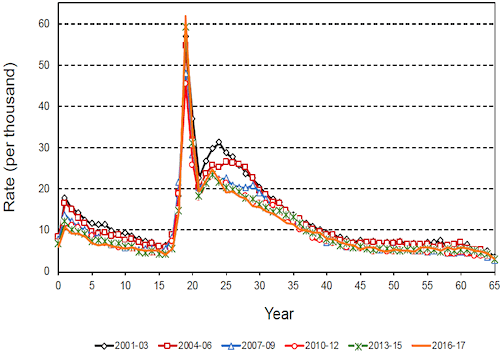
Source: National Records of Scotland; Note: 2001-03=2001-02, 2002-03, 2003-04
Source: National Records of Scotland
Source: National Records of Scotland
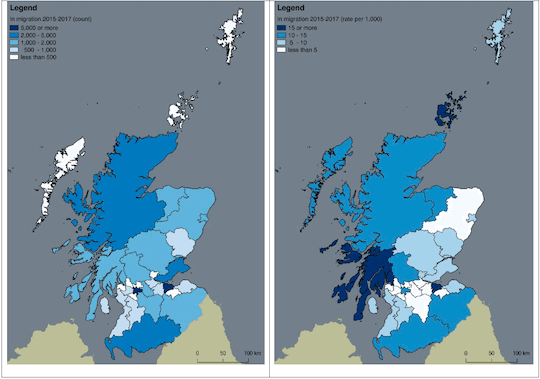
Figure 3.5 shows the size of migration flows from rUK to Scottish local authorities between 2015 and 2017, derived from the NHSCR data. Clearly, most migrants from rUK move to the two largest cities, Edinburgh and Glasgow, which offer the best opportunities for studies and employment. Other popular local authority areas include Highland, Fife and Dumfries and Galloway. In contrast, the islands, Inverclyde, East and West Dunbartonshire, Clackmannan and Midlothian are less popular destinations. Translating these gross migration flows into rates by dividing by the population of the destination local authority, a different picture emerges. While Edinburgh receives large numbers of migrants relative to its population, the inflow rate to Glasgow is lower relative to its population. All local authorities adjacent to Glasgow have very low rates of migration, as does Midlothian. However, as implied previously (page16, low rates of migration in these local authorities may reflect commuting patterns to both Edinburgh and Glasgow. Meanwhile, even though the absolute number of migrants is low, rates of migration to Orkney and Argyll and Bute are relatively high. Aberdeenshire continues to suffer from the difficulties of the oil and gas sector and consequently rates of immigration to this local authority are well below the Scottish average.
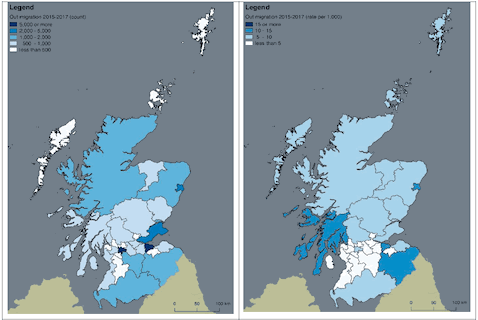
Edinburgh and Glasgow experience the largest out-migration flows (Figure 3.6), as expected, although out-migration has declined over time. As with in-migration, many of the areas around Glasgow have low out-migration rates. Thus, unlike Scotland’s major cities, these local authorities are characterised both by low in-migration and low out-migration from/to rUK. They have a legacy of industrialisation, economic decline and adverse labour market outcomes.
Source: National Records of Scotland
Source: National Records of Scotland
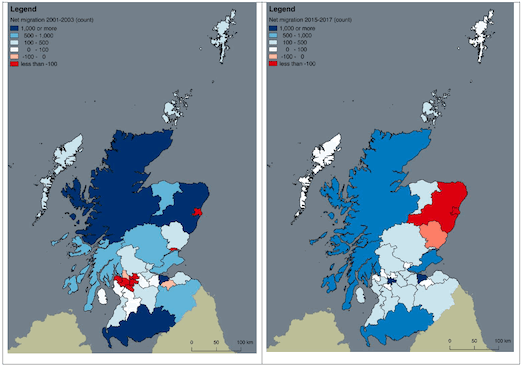
Figure 3.7 shows the size of net flows by council in 2001-03 and 2015-17. Interestingly, while most big cities (except Edinburgh) experienced negative net migration with the rUK in the beginning of this century, the patterns have changed: all cities, except Aberdeen and its surrounding areas now receive more migrants from rUK than they lose them. This supports the hypothesis that many young people from England stay in Scotland after studies and find employment in one of the big cities. Recent migration trends in the Aberdeen region are largely explained by reduced migration from rUK to the region, due to the decline in the oil and gas industry in the region. It is noteworthy that Edinburgh has experienced the most significant inflow of migrants, reflecting the current strength of its economy. Net immigration has also expanded the populations of Argyll and Bute, the Highlands, Dumfries and Galloway, while the continuing difficulties of the north-east have led to higher levels of out-migration for Aberdeen City, Aberdeenshire and Angus than other parts of Scotland.
Aside from age, sex and geography, what else do we know about characteristics of migrants? The 2011 census data and the Labour Force Survey (2016-19) provide a wealth of information on migrants’ characteristics. A description of the LFS dataset is contained in Appendix A.
The analysis of migrants using the 2011 census individual-level data (a five percent sample) supports that migrants (or people who moved a year prior to the census date) are in their twenties; individuals in that age group are even more dominant among international migrants both to Scotland and to rUK. On average, migrants have higher educational levels than non-migrants. The percentage of individuals with degrees is 10 to 20 percentage points higher among migrants than non-migrants (Figure 3.8). Interestingly, the share of people with tertiary education is particularly high among international migrants to Scotland: around 60% of them have a degree. Scotland and the UK more widely have thus enjoyed the arrival of many individuals with high human capital over the last two decades (assuming that the patterns have been relatively similar over years).
Source: National Records of Scotland
Source: The 2011 Census Microdata (a 5% sample).
Analysis of Labour Force Survey between 2016 and 2019 by area of residence and country of birth supports the hypothesis that migrants between Scotland and rUK have higher levels of education and also of pay than do non-migrants. Hourly pay for those born in Scotland who are resident in Scotland is £11.13 per hour (Table 3.2). But those born in Scotland who have moved to other parts of the UK earn almost £15 per hour. Similarly, those born in other parts of the UK tend to earn more on moving to Scotland than those who remain in rUK. Thus, those born in England who moved to Scotland typically earn £13.84 per hour; whereas earnings for this group in rUK (mainly England) average only £11.54 per hour.
| Area of Residence | ||
|---|---|---|
| Country of birth | rUK | Scotland |
| England | 11.54 | 13.84 |
| Northern Ireland | 10.71 | 14.43 |
| Scotland | 14.97 | 11.13 |
| Wales | 10.89 | 13.46 |
Source: Labour Force Survey Microdata.
Those born in Scotland who work elsewhere in the UK have higher earnings than any of the other groups shown in Table 4.2. For example, the hourly earnings of those born in England who work in Scotland is more than £1 per hour less than Scots working outside Scotland. While this finding must be treated with caution because estimates of earnings from the Labour Force Survey are subject to considerable variation, and they may also be influenced by possible differences in age composition, this contrast is nevertheless worthy of further investigation. It is particularly relevant in the light of concerns about tax-induced migration, which may be affecting the Scottish Government’s revenues.
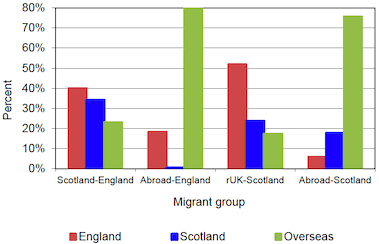
Besides educational and employment related factors, networks and family ties are also important. The analysis of the 2011 census data shows that many migrants, especially those who move within the UK, are return migrants, i.e. move back to the UK’s constituent country they were born. Return migrants account for 40% of migrants from Scotland to England and 25% from the rUK to Scotland (Figure 3.9). Interestingly, about one-fifth of international migrants both to England and Scotland were born in England or Scotland, respectively, indicating that return migrants also play an important role in international migration. Further analysis reveals that return migrants are more dominant among older than younger migrants between Scotland and the rUK. This is consistent with previous migration research showing that in their late fifties and sixties many people are likely to move back to their place of birth or to a residential context similar to their birthplace. Another interesting observation is that people born abroad also form a significant portion, one-fifth, of migrants between Scotland and rUK; and they move in both directions. The analysis therefore does not support the popular idea that international migrants mostly move from Scotland to England.
Source: 2011 Census Microdata (5% sample).
The analysis of migrant profiles provides an overview of who moves from one country to another. However, it is equally important to investigate migrant selectivity in order to gain a better understanding of which type of people in a country of origin (e.g. Scotland) are more likely to move to a country of destination (e.g. rUK), and which are less likely. For example, migrants may be young people for two reasons: first, because of the young age structure of the origin country; second, because people move in their late teens or early twenties due to their studies and entry into labour market. We have fitted a series of regression models, which allow the study of the migration probabilities by a number of individuals’ characteristics adjusted to other characteristics. This is an important step to determine the net effect of each variable. For example, single individuals are more likely to move only because they are likely to be younger than married individuals. To measure the net effect of marital status we thus need to adjust our models for individuals’ age (and other potential cofounders).
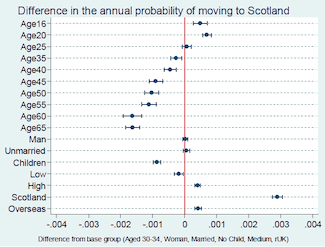
Figure 3.10 provides the results of a multivariate logistic regression model. Included in the model are variables that measure age, sex, marital status, the presence of dependent children in the family, education, and place of birth. The study of migrant selectivity using the 2011 census individual-level data largely supports what we have already learned from the analysis of migrant profiles. The likelihood of moving from England and Wales to Scotland is highest among individuals aged 20 to 24, but also relatively high among those aged 16 to 19 and those in their late twenties and early thirties. As expected, the likelihood of moving significantly declines with age. Individuals with dependent children are less likely to move than those without children, which also corresponds to expectations. University graduates have a significantly higher probability of moving from England to Scotland. Finally, unsurprisingly, individuals born in Scotland have a significantly higher likelihood of moving to Scotland than those born in rUK or overseas: this is return migration at work.
The results are similar for the migration propensities from Scotland to England and Wales (we have excluded Northern Ireland from our analysis). The likelihood of moving is greatest among people aged 20 to 24, but also among those in ages 16 to 19 and in their late twenties (Figure 3.10). Again, highly educated individuals are more likely to move from Scotland to England than those with low educational levels and couples without children have a higher probability of moving than those with dependent children. As expected, individuals who were born in England and Wales and overseas are more likely to move to England and Wales than people who were born in Scotland. Interestingly, men are also more likely to leave Scotland than women, although the differences are not large. We also analysed migrant selectivity using the 2001 census data (see Figure A3 in Appendix). The results are similar to those based on the 2011 census analysis suggesting that migration patterns between Scotland and rUK did not change significantly in the first decade of this century.
Figure 3.10 Probability of moving between England and Wales, and Scotland, 2010-11
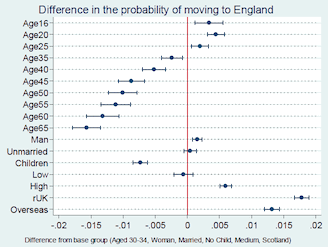
Source: 2011 Census Microdata (5% sample).
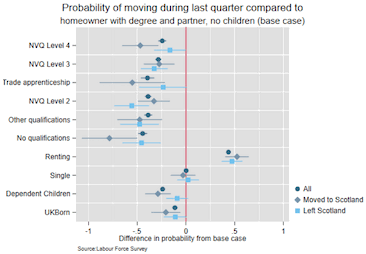
The analysis of the Labour Force Survey from a recent period (2016-19) largely supports the results of the 2011 census data analysis; it also provides further information on migrant selectivity. Those holding degrees (the base case) are significantly more likely to leave Scotland or to come to Scotland than those with other educational qualifications. There are no significant differences in the probability of migrating among the other educational groups. Given the concentration of migration between ages 18 and 29, the initial move to university may have more bearing on whether individuals become migrants than current wage differentials between those with degrees and those with other qualifications or none.
Having dependent children does reduce mobility, as expected, due to concerns around educational disruption and increased economic costs. This effect is stronger for those coming to Scotland than for those who have left. Other significant results are that those born in the UK are significantly less likely to move, while migrants are much more likely to rent their accommodation than non-migrants, which also corresponds to expectations. Those born outside the UK seems to be more likely to come to Scotland, but less likely to leave. There are perhaps two main explanations of why migrants are more likely to rent their accommodation. The first is that migration is measured by a change of region over the last year. Some may still be searching for housing to purchase. The second is that, as we have seen, it is principally the young who migrate: the current generation of young people are less able to purchase housing than previous generations largely because wage growth has not kept pace with the increase in house prices.
Source: Own Calculations from Labour Force Survey Microdata
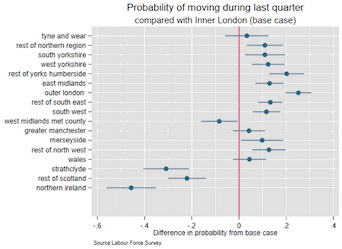
Figure 3.12 shows whether the propensity to migrate differs across the UK regions and nations after adjusting for other individual characteristics such as age, education, and so on. The base group for comparison purposes is Inner London. Among all those who move within the UK, and holding their other characteristics constant, the probability of a move among those living in Scotland (the Strathclyde area and the rest of Scotland) is significantly lower than in other parts of the UK, with the exception of Northern Ireland where the probability is even lower.
Contact
Email: population@gov.scot
There is a problem
Thanks for your feedback