Developing young workforce strategy - impact on education: evaluation
An independent evaluation of the impact of Developing the Young Workforce Strategy on education.
Appendix A: Survey analysis
Introduction
The research methodology featured interviews with key members of staff in the 15 participating schools. To understand the implementation and impact of DYW more widely, an online survey was created and sent to members of staff within each school.
In total, 63 survey responses were received, from nine of the 15 schools. Just over half (54%) of respondents were class teachers, with one third (33%) Principal Teachers and 8% guidance / pastoral care teachers. One careers advisor and a Depute Head also participated. Respondents covered all areas of the curriculum including English, social subjects, modern languages, STEM subjects, PE, art and design, and business.
Implementation of DYW
Virtually all respondents felt their school has integrated the principles of DYW into the curriculum – three in ten to a large extent (29%), over two fifths (43%) to a moderate extent and one quarter (25%) to a small extent.
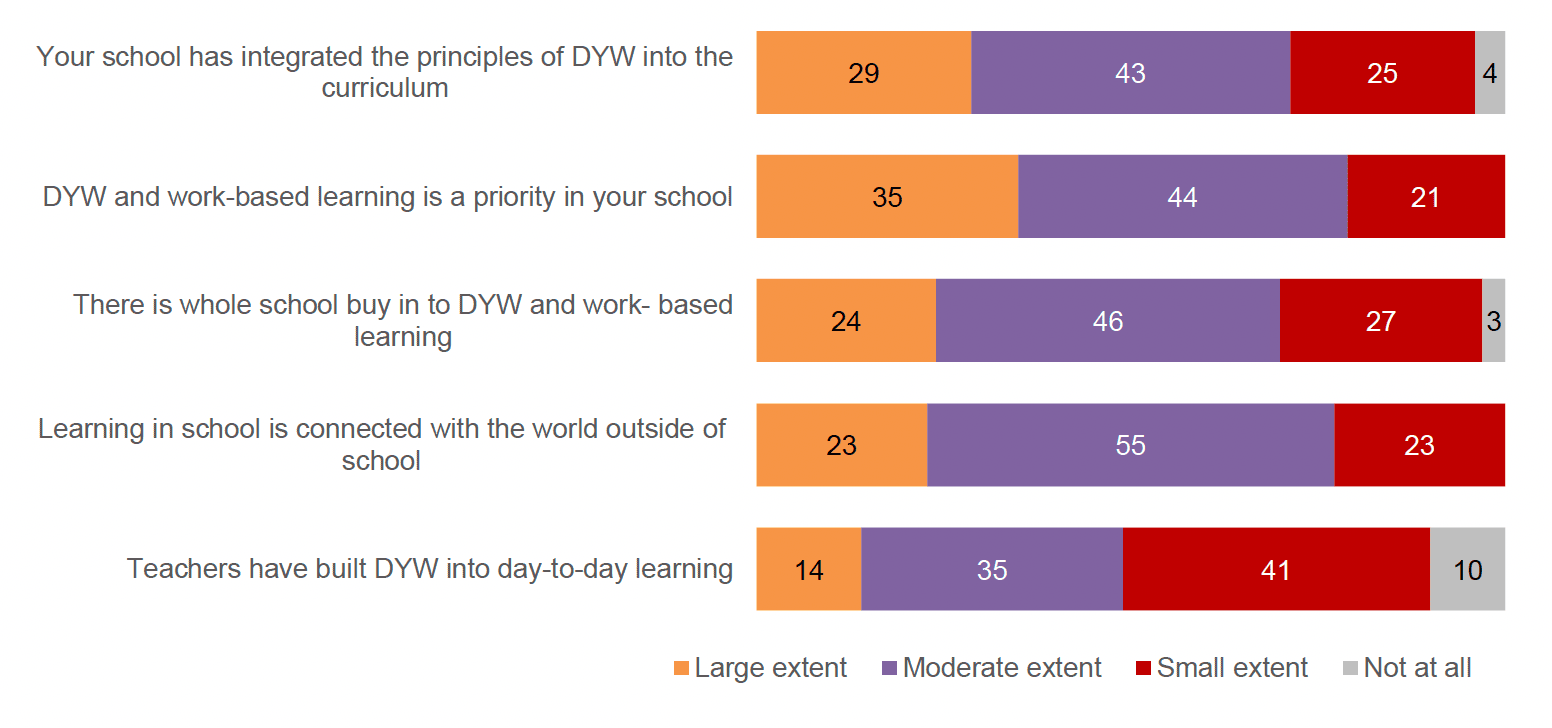
Views on the integration of DYW into the curriculum were explored in more detail. Respondents were most likely to feel that DYW and work-based learning is a priority in their school, with one third 35% indicating this is largely the case and 44% moderately so. Just under one quarter felt that there is whole school buy-in to DYW (24% to a large extent) and that learning in school relates to the world outside of school (23% to a large extent). However, there was less agreement that teachers have built DYW into day-to-day learning; 41% felt this is only happening to a small extent, with only 14% reporting it happens frequently.
Respondents were asked how whether they felt their school had been adequately supported in implementing DYW. One in ten (10%) felt they had been supported to a large extent, 63% to a moderate extent and one quarter (25%) to a small extent. One respondent felt they had not been supported at all.
To understand the main drivers of DYW in schools, respondents were given a list of options and asked to rank them in order of importance from most to least influential.
As show in Figure 2, school staff are widely seen as the driving force behind DYW. Over half (51%) selected their Senior Leadership Team as most influential (in dark green in Figure 2). One in five (21%) felt an individual member of staff was most influential, and the Regional DYW Co-ordinator and local authority were both selected by 13%.
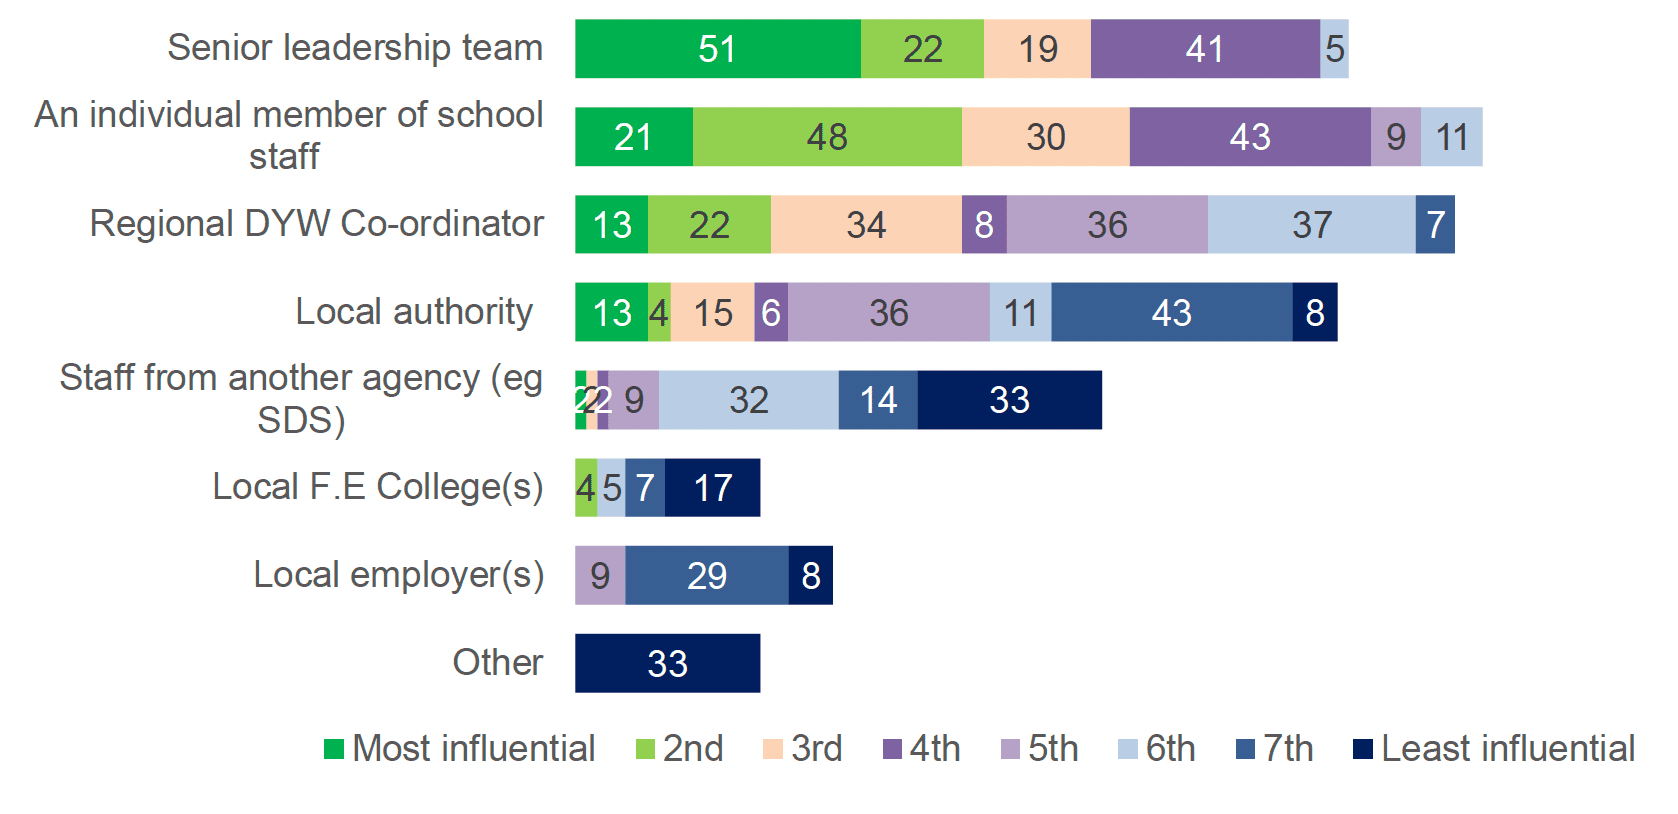
While the SLT is key, across the whole ranking exercise the most influence was attributed to individual members of staff, followed by the Regional DYW co-ordinator. Views on the role of local authorities were mixed; some saw them as influential, but 8% considered them least influential (dark blue) and 43% the second least influential. Staff from other agencies, local colleges and local employers were generally considered as having limited influence.
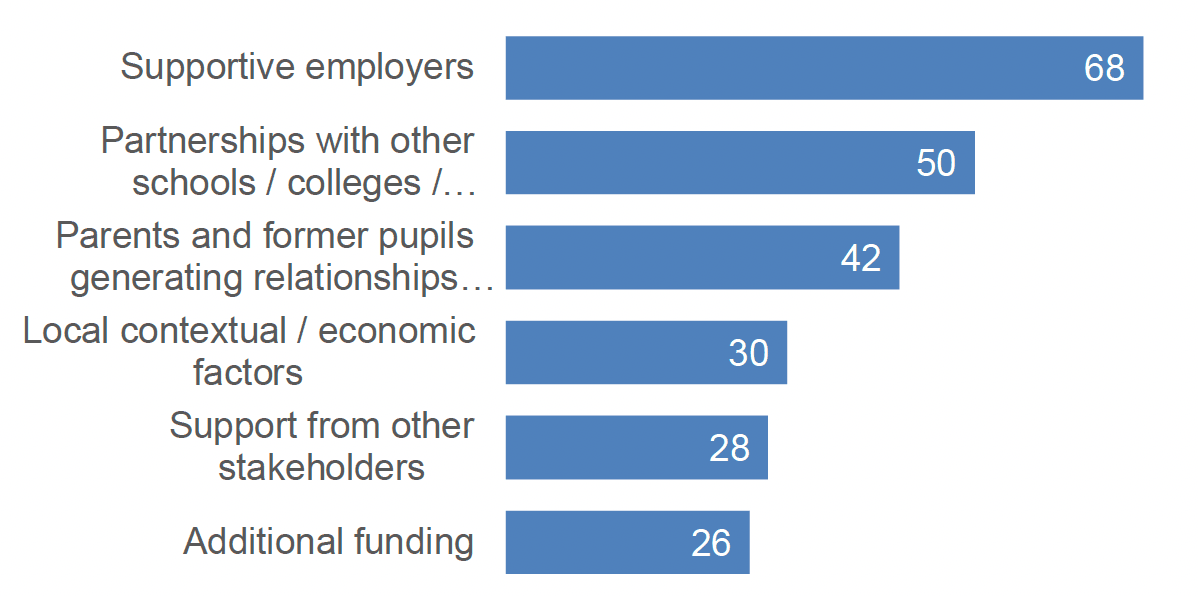
In addition to these drivers, respondents were asked what other factors have supported their implementation of DYW. Supportive employers were most commonly cited as aiding the implementation of DYW, being mentioned by 68% of respondents. Forging links with employers via parents and former pupils was also noted as being important by 42%. Half reported that partnerships with other educational institutions has supported their implementation. These are shown in Figure 3.
While there is evidence of support for DYW across a range of staff and stakeholders, respondents were also asked about the challenges they have faced in implementing DYW. These are shown in Figure 4.
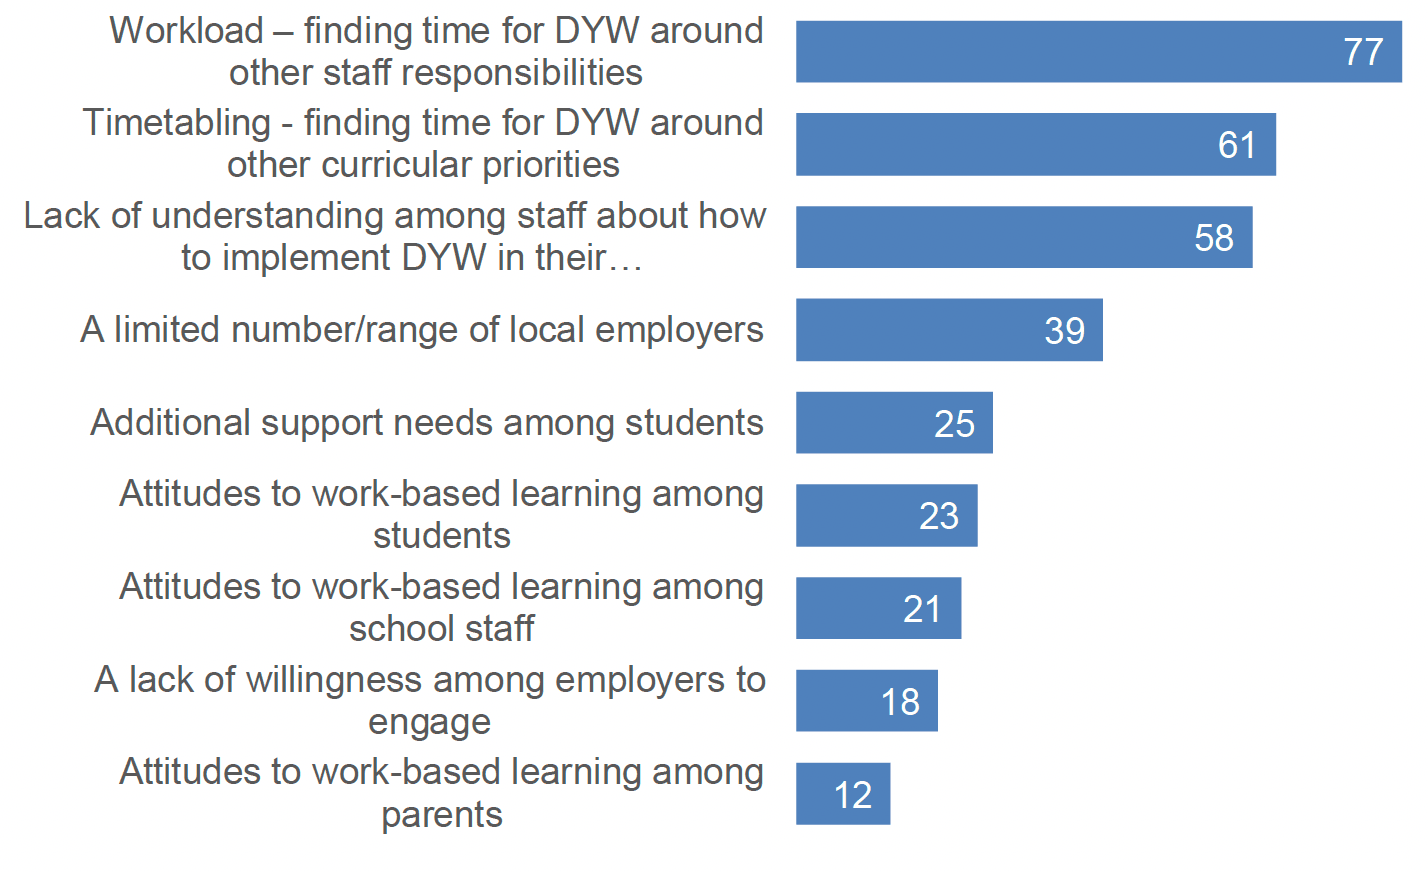
Issues around capacity are the biggest challenge to implementing DYW and work-based learning. Three quarters (77%) reported difficulties of finding time for DYW around staff members' responsibilities, with three fifths (61%) challenged by finding time for work-based learning within their other priorities. Perhaps more of a concern is that three fifths (58%) reported a lack of understanding about how to implement DYW as a barrier.
It is encouraging that employers appear willing to engage; only 18% cited a lack of willingness to engage as a challenge. However, two fifths (39%) reported that they have a limited number of local employers who they feel they can engage with.
Attitudes to work-based learning are also a less commonly mentioned concern. One fifth (21%) cited issues with attitudes among staff. While 23% felt attitudes to work-based learning among staff is a challenge, it is positive to note that only 12% felt that attitudes among parents is a barrier.
Impact of DYW
The survey also sought respondents' views on the impact of DYW in their schools. Respondents were asked whether they agreed or disagreed with four statements about impact. These are shown in Figure 5.
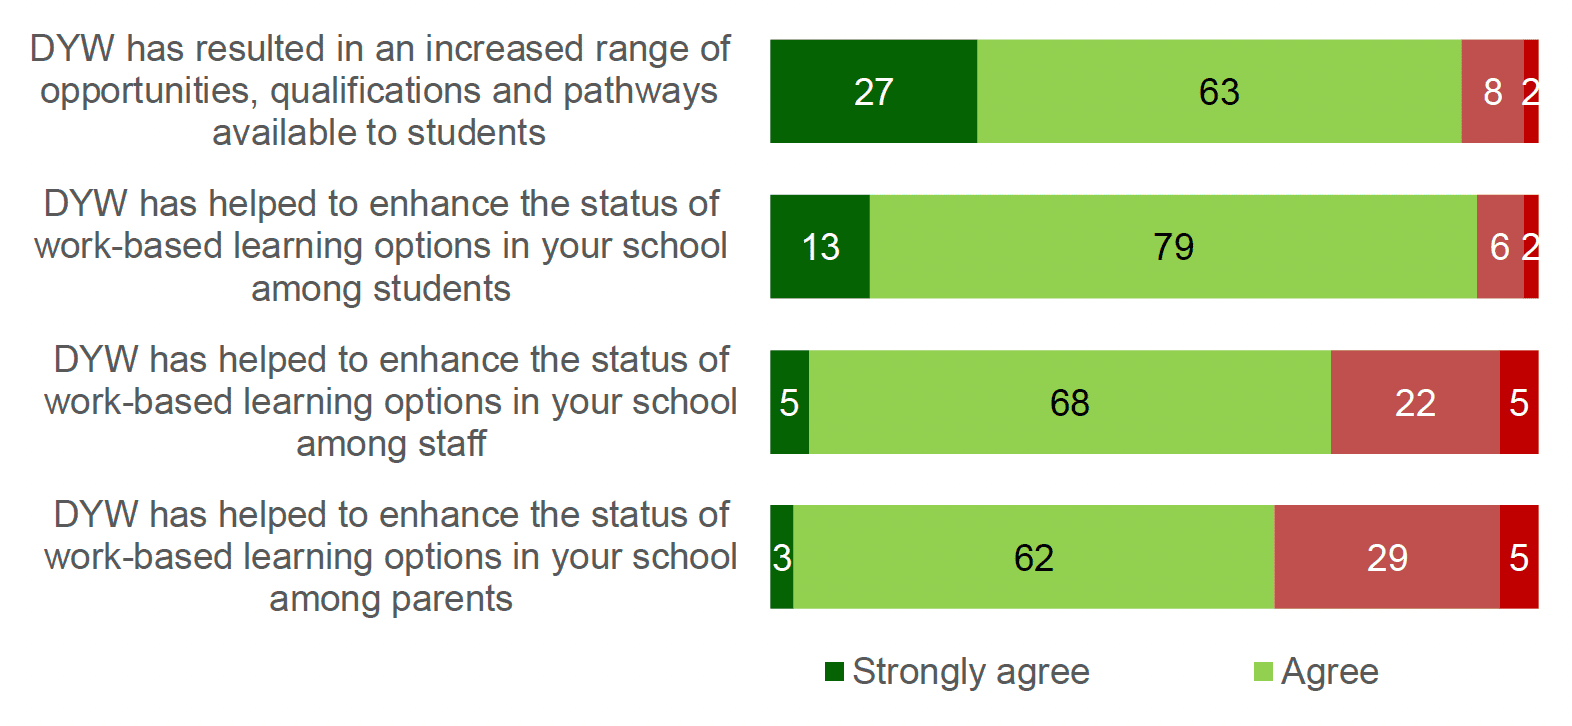
Nine out of 10 (90%) agreed that DYW has increased the range of opportunities available to pupils, with over one quarter (27%) strongly agreeing.
Although 92% overall agree that DYW has enhanced the status of work-based learning among pupils, strong agreement with this option was slightly lower at 13%. The impact of DYW on the views of work-based learning among staff and parents is also evident, with almost three quarters (73%) reporting it has positively impacted views among staff and two thirds (65%) positively impacting parents.
Respondents were also asked whether their school has used DYW to address educational and workplace inequalities e.g. disability, gender, race, SIMD profile, care experience, geography, mental health, academic ability. Among those who answered (n=55), 26% felt this was the case to a large extent, 47% to a moderate extent and 18% to a small extent. One in ten (9%) indicated that this does not happen at all.
Contact
Email: socialresearch@gov.scot