Housing statistics quarterly update: September 2021
This publication contains an update on Affordable Housing Supply approvals, starts and completions up to June 2021 with all-sector and private sector new housebuilding starts and completions up to September 2020, and social sector new housebuilding up to December 2020.
7. Affordable housing supply
Affordable Housing Supply Programme statistics reflect the broader supply of affordable homes (i.e. for social rent, affordable rent and affordable home ownership) and include off the shelf purchases and rehabilitations as well as new builds. Statistics are available up to the end of June 2021.
Quarterly affordable housing supply statistics are used to inform progress against Scottish Government affordable housing delivery targets, including to deliver the remaining 50,000 target homes as quickly as it is safe to do so over the year 2021/22, along with the longer term ambition, set out in Housing to 2040, of delivering a further 100,000 affordable homes by 2032 with 70% of these being for social rent. This ambition has now been enhanced by the SNP/Scottish Green Party Co-operation Agreement which commits to delivering 110,000 affordable homes by 2032, of which at least 70% will be for social rent and 10% will be in remote, rural and island communities. The statistics reflect the number of affordable homes delivered that have received some form of government support through loans, grant or guarantees.
Approvals, starts and completions are all measured for the Affordable Housing Supply Programme. Approval is the point at which funding is granted. Starts are recorded when an on-site presence is established to progress site work. Completion measures when the units are delivered and ready for occupation.
Social Rent includes Housing Association Rent, Council House Rent as well as Home Owner Support Fund Rent.
Affordable Rent includes Mid-Market Rent (MMR), National Housing Trust (NHT) Rent as well as other programmes such as the Empty Homes Loan Fund (EHLF) and Rural Homes for Rent (RHfR).
Affordable Home Ownership includes Open Market Shared Equity (OMSE), New Supply Shared Equity (NSSE), Shared Ownership (LCHO) as well as other programmes such as Home Owner Support Fund Shared Equity.
Latest figures to end June 2021:
COVID-19 lockdown restrictions on construction and housing market activity from mid-March 2020 to late June 2020 have lowered the total amount of activity recorded for the two quarters from January to March 2020 and April to June 2020 compared to what would otherwise have been the case.
Following this, there was a phased re-start of supply activity, in which the construction sector moved into Phase 4 of the Restart Plan in mid July 2020. This allowed for sites to work up to a steady state operation using physical distancing, barriers, or controlled close working with PPE, but in some cases may result in fewer workforce staff on site to ensure safe working and physical distancing. In addition to this, some work on new approvals may have been affected over this period by the furloughing of some social landlord and construction sector staff.
Table 6 below shows that in the latest quarter April to June 2021, 1,063 homes were approved, 1,854 homes were started, and 1,595 homes were completed. The levels of approvals, starts and completions are all higher than in the same period in the previous year, during which housebuilding activity was largely paused due to lockdown measures, with approvals being 9% (90 homes) higher, starts being over double (105%, or by 949 homes) and completions being over eight times higher than in April to June 2020 (710%, or by 1,398 homes).
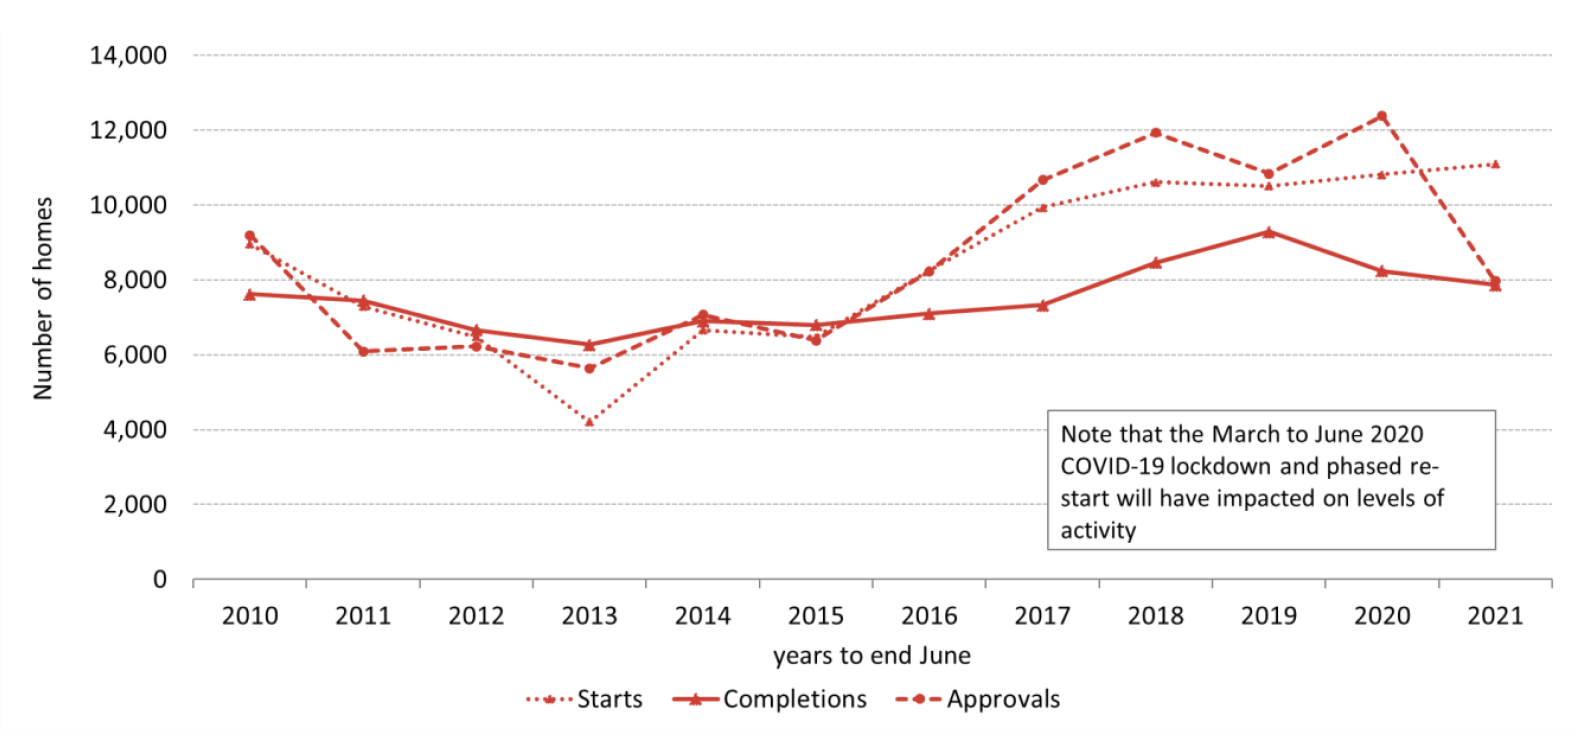
Over the latest year to end June 2021, the number of homes approved and completed in the year to June 2021 fell by 36% (4,404 homes) to 7,972 approvals and 5% (374 homes) to 7,864 completions, compared with the year to end June 2020. Starts have increased by 3% (288 homes) in the year to end June 2021 compared to the previous year. Annual figures have been affected by the lockdown measures in place between mid-March and late June 2020 , in which non-essential construction activity stopped and home buyers were advised to delay moving to a new home where possible, after which there has been a phased re-start of supply activity.
| Affordable housing supply homes | Approvals | Starts | Completions |
|---|---|---|---|
| Quarter Apr to Jun 2015 | 924 | 1,318 | 1,194 |
| Quarter Apr to Jun 2016 | 1,205 | 1,899 | 1,782 |
| Quarter Apr to Jun 2017 | 1.518 | 2,445 | 1,659 |
| Quarter Apr to Jun 2018 | 1,773 | 2,492 | 1,541 |
| Quarter Apr to Jun 2019 | 1,483 | 2,135 | 1,255 |
| Quarter Apr to Jun 2020 | 973 | 905 | 197 |
| Quarter Apr to Jun 2021 | 1,063 | 1,854 | 1,595 |
| Change over latest year | +90 | +949 | +1,398 |
| Change (%) over latest year | +9% | +105% | +710% |
| Year to Jun 2015 | 6,378 | 6,473 | 6,796 |
| Year to Jun 2016 | 8,226 | 8,263 | 7,100 |
| Year to Jun 2017 | 10,674 | 9,939 | 7,321 |
| Year to Jun 2018 | 11,932 | 10,616 | 8,460 |
| Year to Jun 2019 | 10,840 | 10,515 | 9,283 |
| Year to Jun 2020 | 12,376 | 10,815 | 8,238 |
| Year to Jun 2021 | 7,972 | 11,097 | 7,864 |
| Change over latest year | -4,404 | +282 | -374 |
| Change (%) over latest year | -36% | +3% | -5% |
Charts 11a to 11c below present quarterly trends in the number of approvals, starts and completions from January 2018 up to end June 2021.
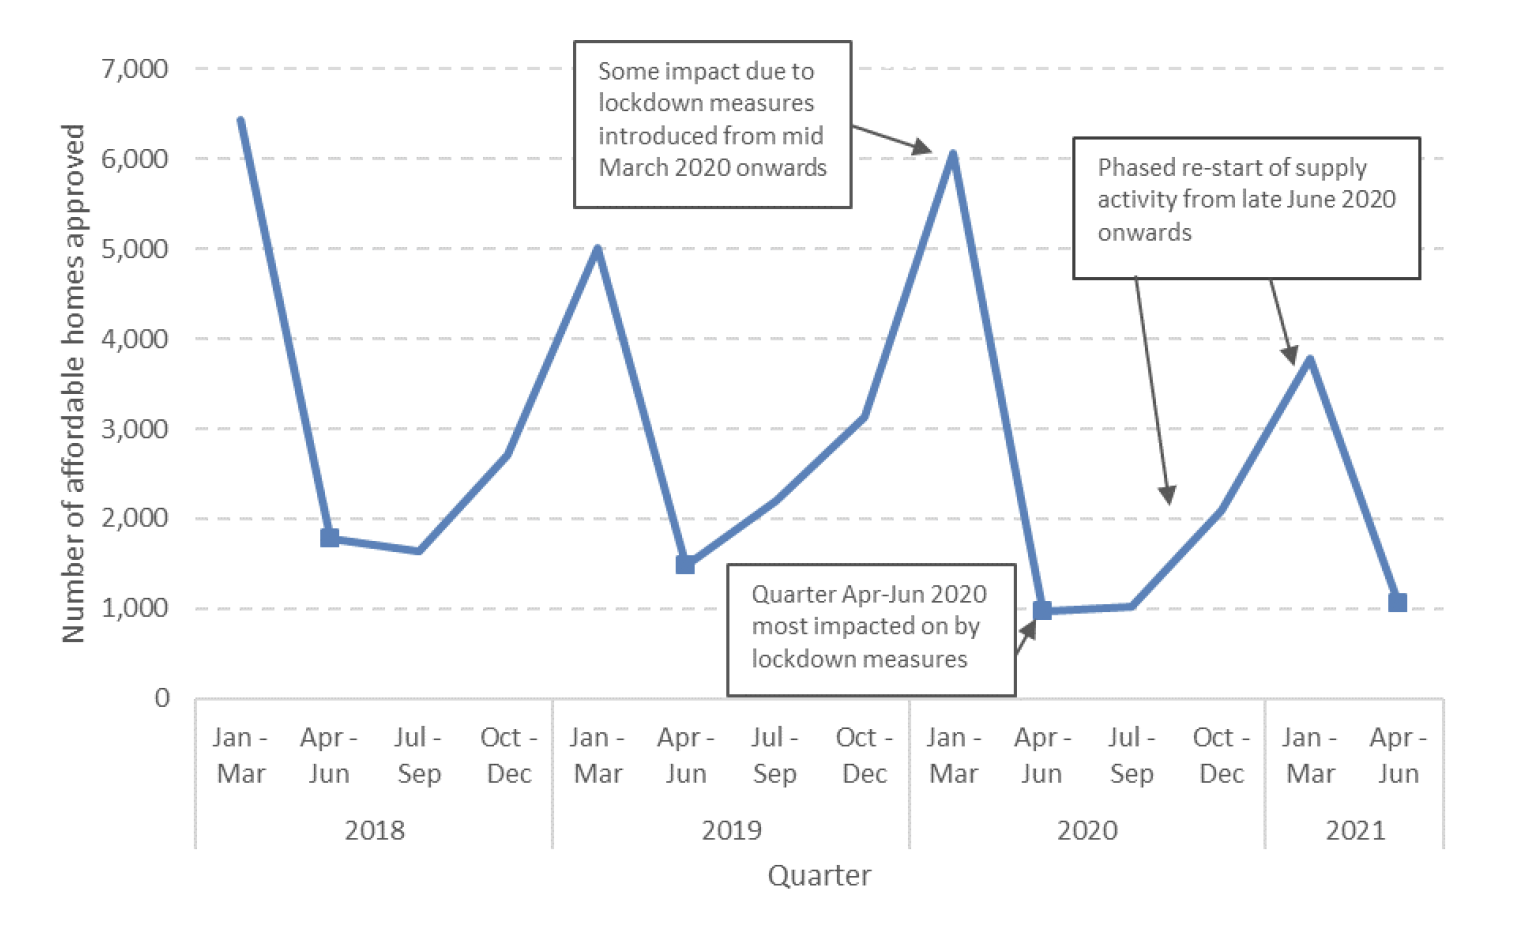
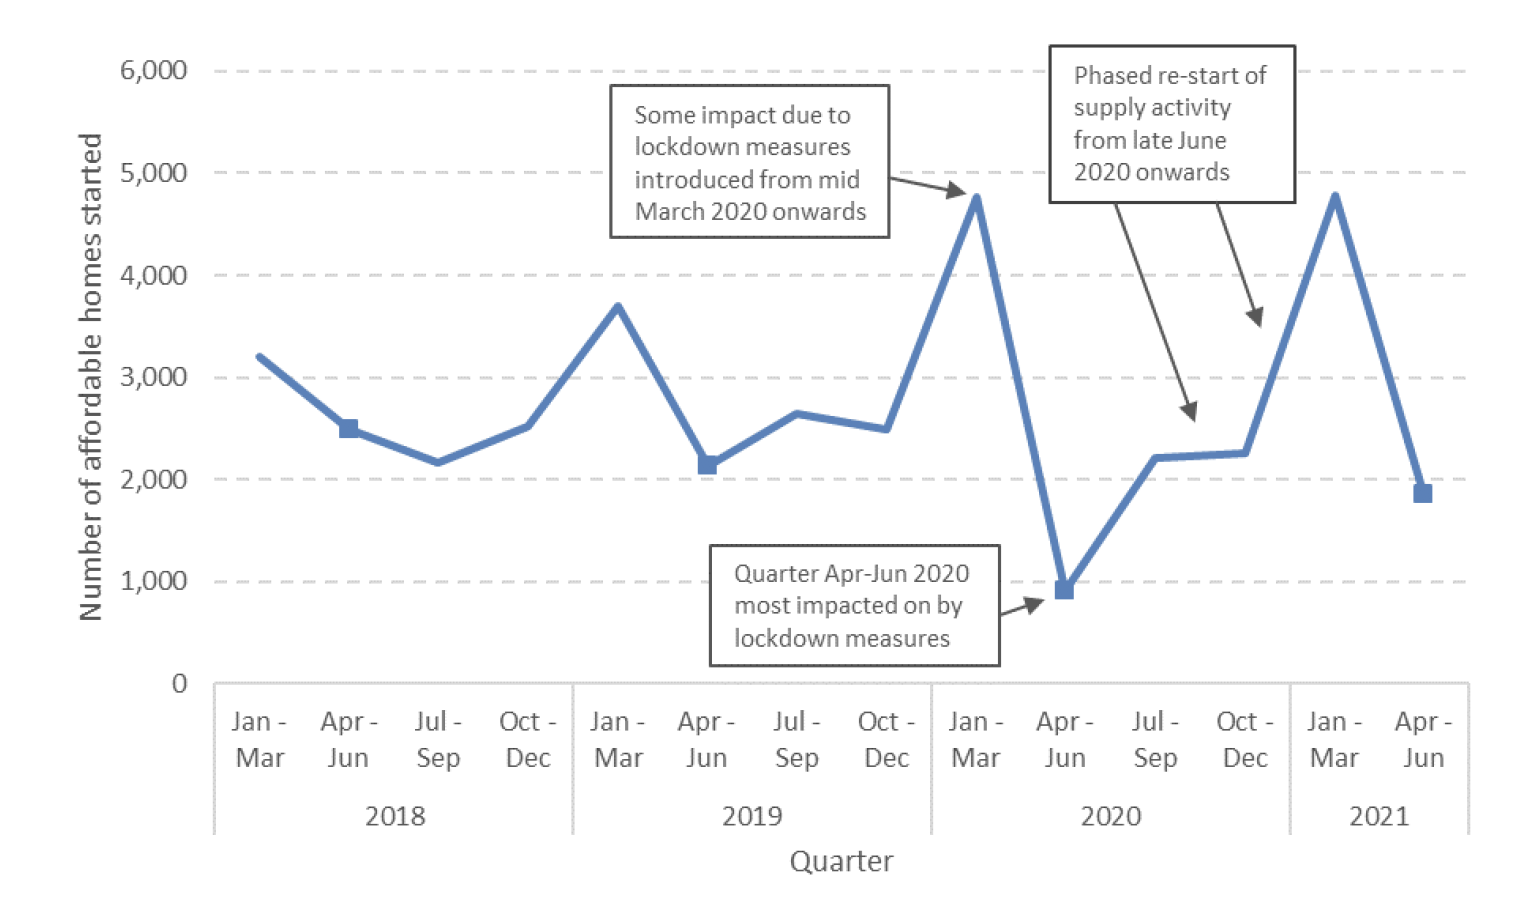
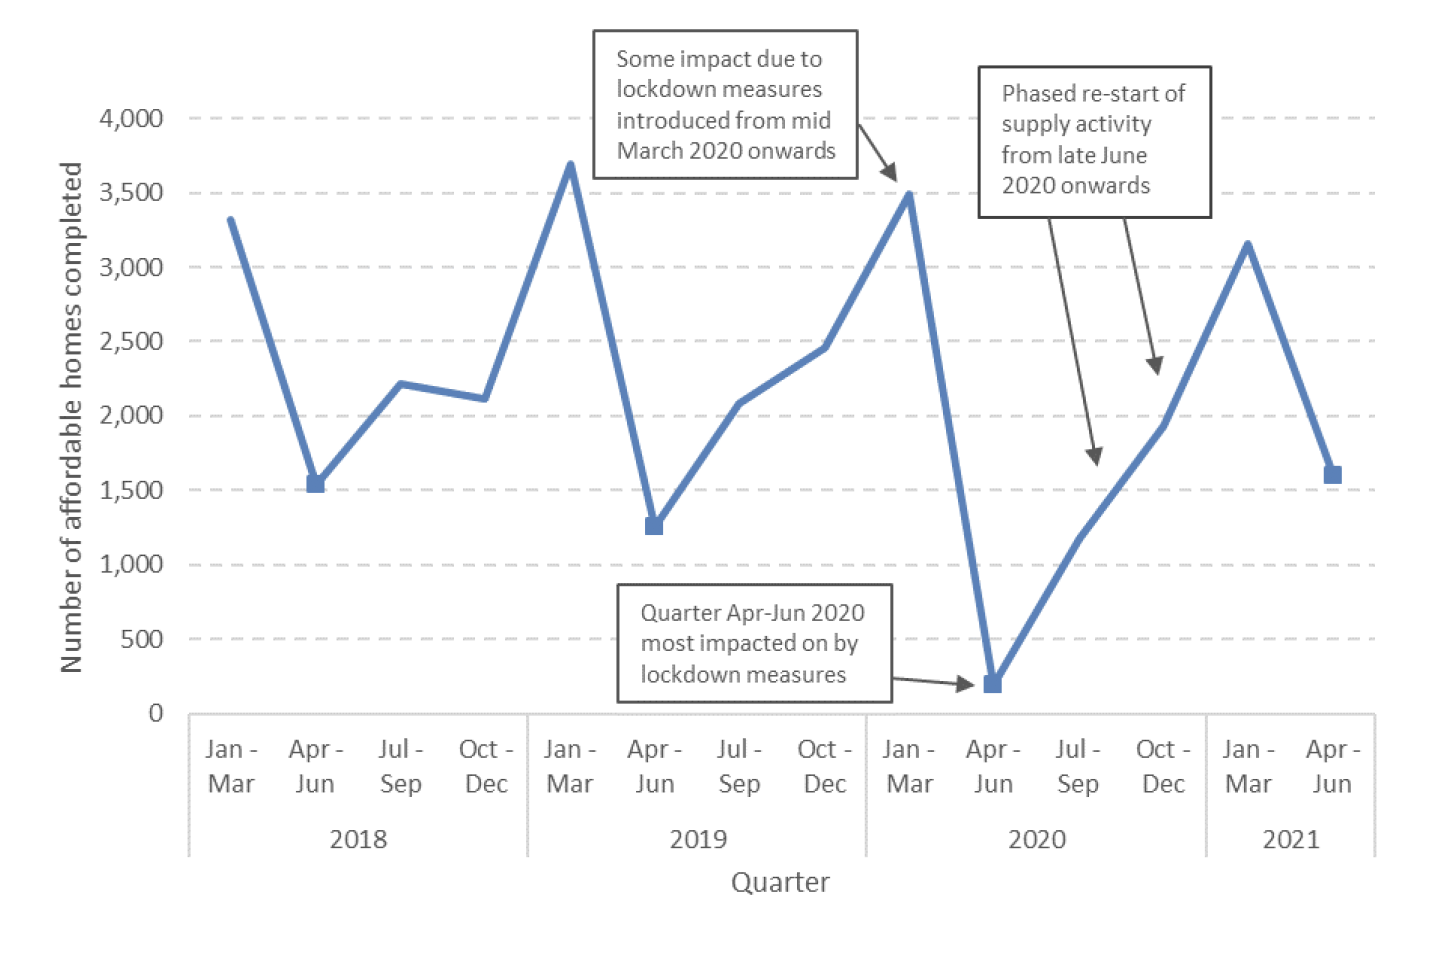
Chart 12 below shows that the numbers of affordable homes approved and completed have decreased on an annual basis over the latest year to end March 2021 but the number of starts has increased in the same time period. In the year to end June 2021, 7,972 affordable homes were approved, a decrease of 4,004 homes (36%) on the previous year, and 7,864 homes were completed, a decrease of 374 homes (5%), whilst 11,097 homes were started, an increase of 282 homes (3%).
Charts 13 to 15 below present information on trends in affordable housing supply by type. Chart 13 shows that total affordable housing supply programme approvals decreased by 36% between 2020 and 2021 (years to end June). In the latest year 2021, social rent approvals accounted for 76% of all approvals, with affordable rent and affordable home ownership each making up 12% of the remaining total.
In the year to end June 2021, there were 6,023 homes approved for social rent, a decrease of 38% (3,692 homes) on the same period in 2020. There were 991 approvals for affordable rent, a decrease of 30% (420 homes), and 958 homes were approved for affordable home ownership, a drop of 23% (292 homes).
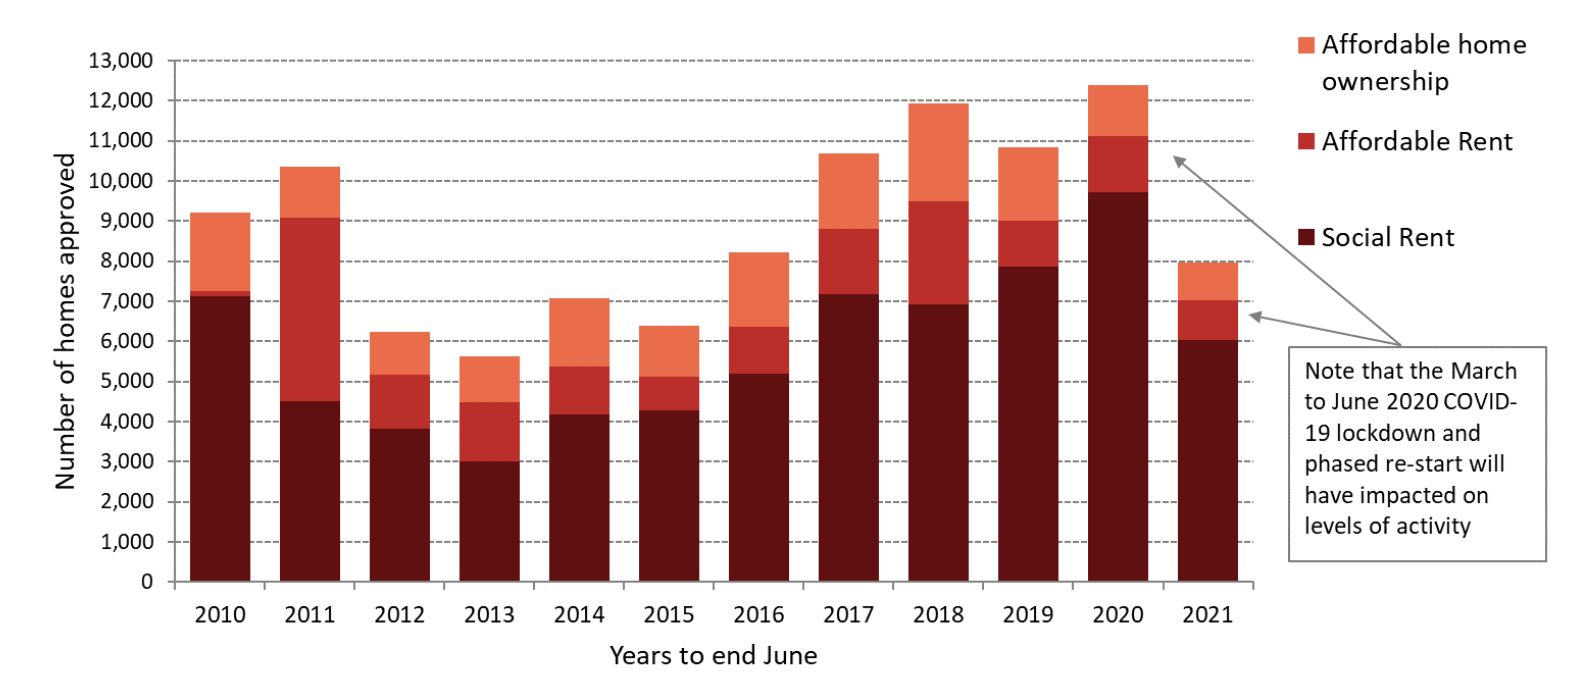
Chart 14 illustrates that total affordable housing supply programme starts increased by 3% between 2020 and 2021 (years to end June). In the latest year, social rent starts accounted for 75% of all starts, with affordable rent and affordable home ownership making up 15% and 10% of the total, respectively.
In the year to end June 2021, there were 8,356 starts for social rent, an increase of 5% (405 homes) on the previous year. There were 1,621 homes started for affordable rent, a drop of 9% (157 homes), and 1,120 homes were started for affordable home ownership, an increase of 3% (34 homes).
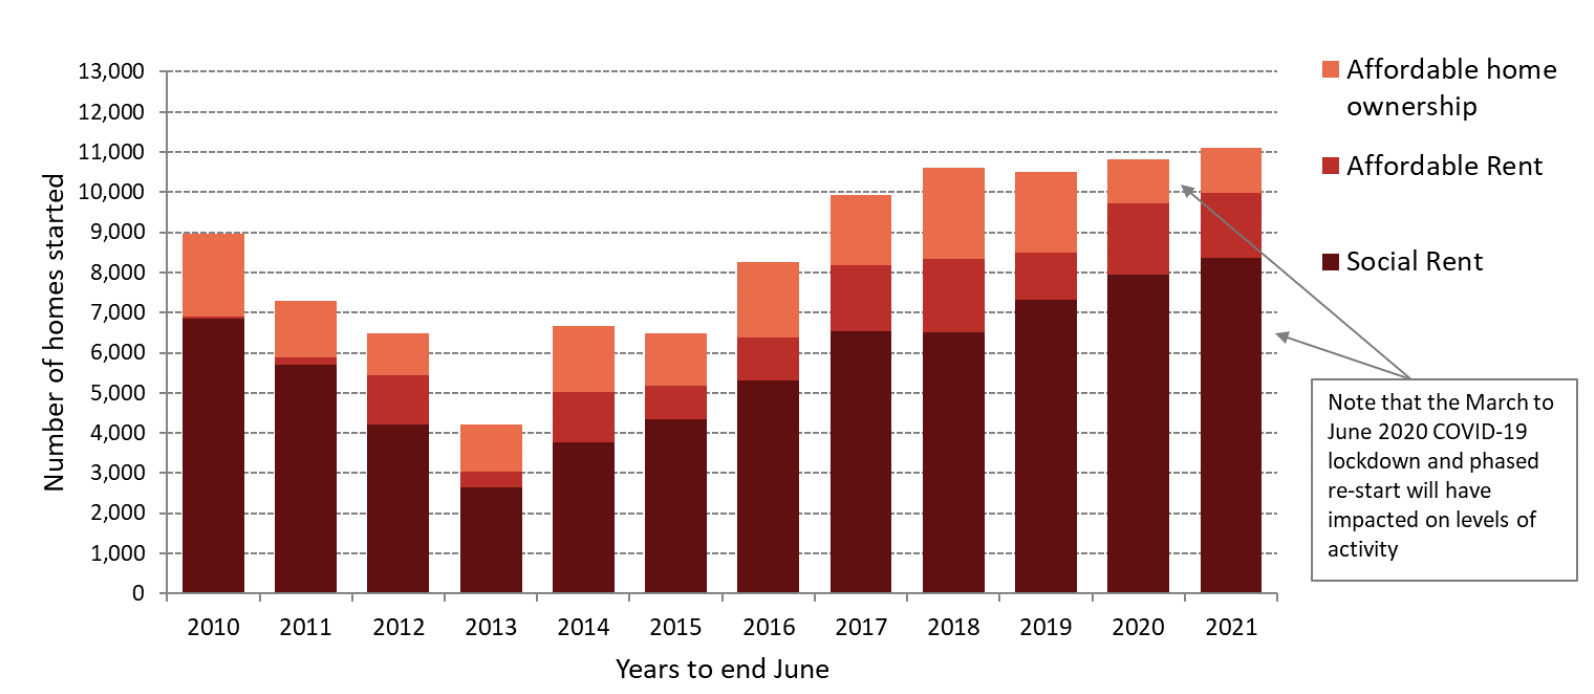
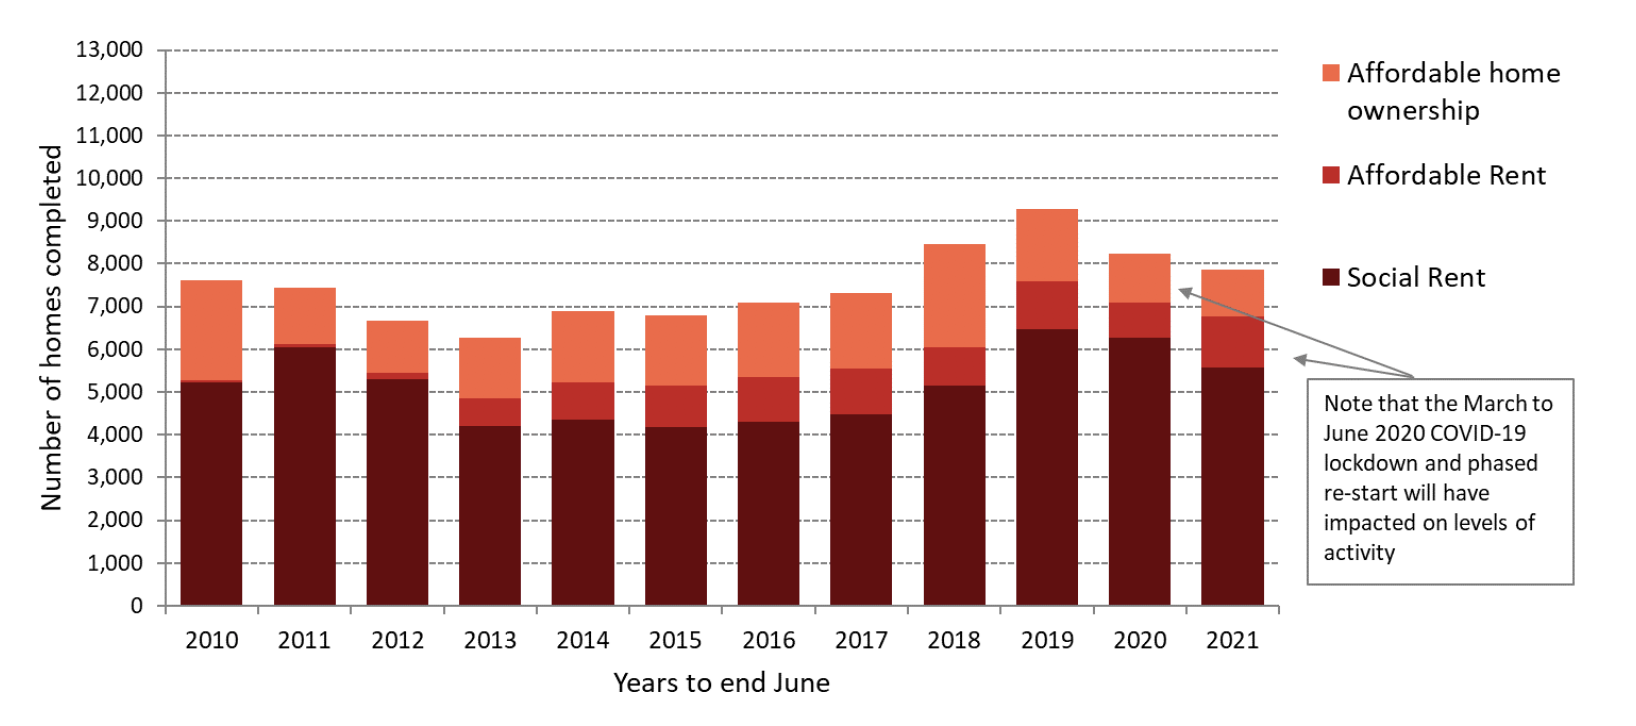
Chart 15 shows that total affordable housing supply programme completions decreased by 5% between 2020 and 2021 (years to end June). In the latest year, social rent completions accounted for 71% of all completions, with affordable rent and affordable home ownership making up 15% and 14% of the total, respectively.
In the year to end June 2021, there were 5,574 homes completed for social rent, a decrease of 11% (701 homes) on the previous year. There were 1,205 affordable rent homes completed, an increase of 48% (390 homes), and 1,085 homes completed for affordable home ownership, a decrease of 5% (63 homes).
Comparison with the rest of the UK from 2007/08 to 2020/21
This section compares how the level of affordable housing supply per head of population varies between Scotland and other UK countries, to help meet user demand for cross country analysis.
Each of the countries of the UK produces their own statistics on affordable housing supply[5]. Whilst there are some differences in the detail of affordable housing definitions and products used by each country, some comparisons can be made on how affordable housing supply varies per head of population.
Chart 16 below illustrates how the figures per 10,000 population have varied across the 2007/08 to 2020/21 period for Scotland, England, Wales and Northern Ireland.
Between 2007/08 and 2019/20, the latest year in which there are figures available across all UK countries, the annual average supply of affordable housing per head of population in Scotland has been 13.8 homes per 10,000 population, higher than England (9.7 homes per 10,000 population), Wales (7.7 homes per 10,000 population), and Northern Ireland (13.0 homes per 10,000 population – average across the years 2010/11 to 2019/20). Scotland has had annual rates above all other UK countries in most years since 2007/08, except for during 2012/13 to 2014/15, in which the rates for Northern Ireland were higher.
The 9,296 affordable homes completed in Scotland in the financial year 2019/20 equates to a rate of 17.0 homes delivered per 10,000 population. This is above the rate of 10.2 in England and the rate of 9.3 in Wales and 14.4 in Northern Ireland[6].
The 6,466 affordable homes completed in in Scotland in the latest financial year 2020/21 equates to a rate of 11.8 homes delivered per 10,000 population, the lowest rate of homes delivered in Scotland since 2012/13, athough this figure will have been impacted by the lockdown measures in place from mid-March to late June 2020, along with the subsequent phased restart of supply activity.
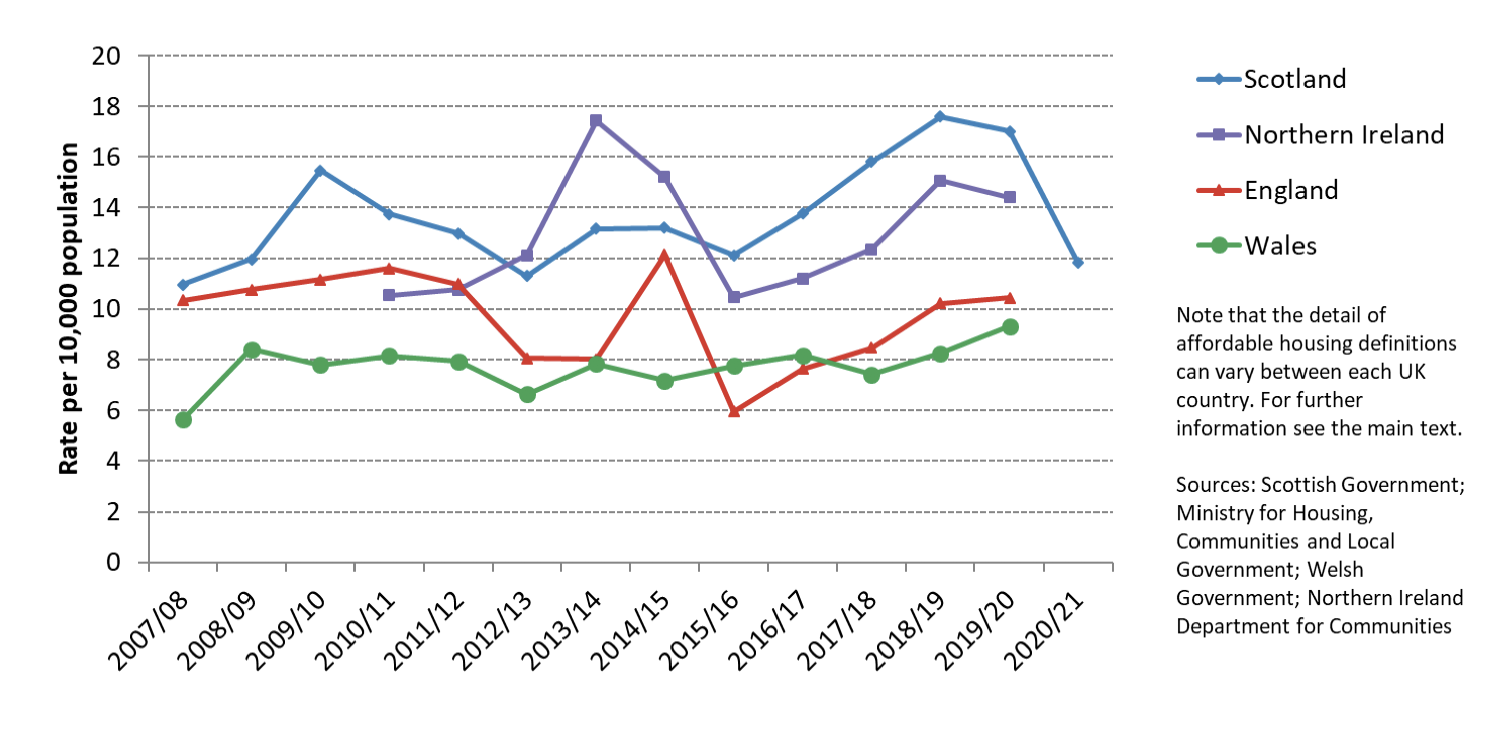
Affordable housing supply figures for 2020/21 for England, Wales and Northern Ireland are not yet available, however these will be added to Chart 16 in future publications when the figures are published
Note that the statistics for England and Wales both include developer-funded Section 106 supply, although for England it is thought that some will be missed as local authorities are not aware of it all. Northern Ireland does not currently have an equivalent mechanism. Data for Scotland include Section 75 units receiving some form of government funding. Data are not available to estimate the number of affordable homes delivered without central government funding in Scotland, but it is thought that the numbers of these homes may be relatively low based on current estimates of the number of funded Affordable and Section 75 homes being delivered.
In addition to the differences in total affordable supply between each country, there are also some differences in the use of different affordable housing products within the mix of overall affordable housing in each country. For example, in England in recent years there has been a greater use of affordable / intermediate rent compared to social rent. Therefore when looking over the four years to 2019/20, in England there have been on average 5.0 affordable / intermediate rent homes completed per 10,000 head of population and 1.1 social rented homes completed 10,000 per-head of population. This compares to a rate of 1.9 for affordable rent homes and a rate of 10.8 for social rented homes in Scotland.
Contact
Email: housingstatistics@gov.scot