Housing Statistics for Scotland 2007: Key Trends Summary
Key trends summary on Housing Trends in Scotland 2007 web tables.
Housing Statistics for Scotland 2007: Key Trends Summary
This summary document provides an introduction to the new Housing Statistics for Scotland web tables which replace the former quarterly housing trends statistical bulletins. These interactive tables present comprehensive data on housing activity in Scotland up to 30 June 2007 in a range of formats, including information on public sector stock and house sales, demolitions, new build, local authority housing management, houses in multiple occupation, special needs housing, rent registration and private sector improvement grants.
The trends described below represent a general overview of a few key areas, and users requiring more information can obtain this directly from the housing statistics data library at http://www.scotland.gov.uk//Topics/Statistics/Browse/Housing-Regeneration/Datasets.
The web tables will be updated regularly as new data become available and the timetable for updates posted on the website. These tables replace the quarterly housing trends statistical bulletins. However the intention is to use the website to disseminate other analyses which may be carried out by the Scottish Government or other users.
Background
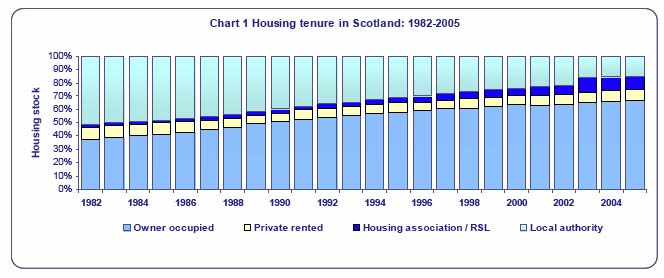
The last quarter of a century has seen a significant change in housing tenure. In 1982, under 40% of households were owner occupiers. By 2005, this had risen to nearly 70%. Although there has been a similar pattern of change across much of Europe, the change has been particularly dramatic in Scotland, where the level of owner-occupation has increased by almost a third since the early 1980s.
Mirroring changes in cultural attitudes toward home ownership, two structural factors have contributed to this shift: the introduction of the right to buy for public authority tenants in 1979 coupled with the decline of public authority new build, and the increased contribution of private sector building.
Stock
New build
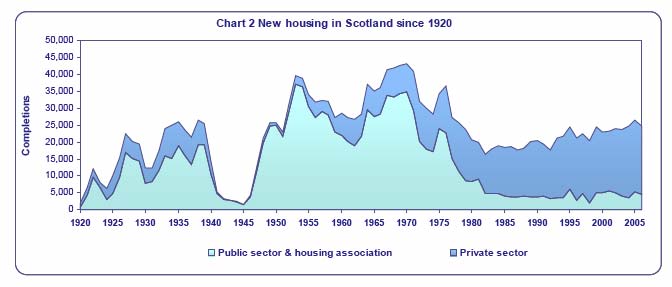
Historic trends in new build showed peaks in the early 1950s and late 1960s resulting primarily from programmes of post-war reconstruction and slum clearances. From a high point of about 41,000-43,000 completions a year, mainly in the public sector, the level of new build fell during the early 80s to under 20,000 completions per year. Since then, there has been an overall upward trend to just under 25,000 completions per year during the past few years, predominantly due to private sector new build which currently represents over 80% of all completions. The remainder of new build is predominantly by housing associations. To give some indication of future building levels, over recent years new build starts are running at about 27,000 per year.
Sales of social sector housing to sitting tenants
The introduction of right to buy legislation in 1979 had a substantial impact on the profile of Scottish housing, and the scale and nature of these changes are shown in the 2006 report to the Scottish Parliament The right to buy in Scotland: pulling together the evidence.
Over the years, nearly half a million sales of public sector stock have taken place. The annual rate of sales to sitting tenants peaked at just under 40,000 in 1989, at the height of the housing boom. It then fell rapidly in the early 1990s as the housing market crashed, settling at around 15,000 per year from the mid 1990s onwards. Legislation introduced as part of the Housing (Scotland) Act 2001 then resulted in significant changes in right to buy terms for new tenants from 2002.
After a small upturn in 2002 and 2003, sales have declined consistently with decreases varying between 12% and 19% per year, to a current level of about 8,500 public authority right to buy sales for 2006-07 (including local authorities with total stock transfers). This is to be expected as the vast majority of tenants buying over this period have the preserved right to buy, and tenancies for new tenants are on modernised terms which in most cases means they cannot buy until October 2007 at the earliest, and this on less favourable terms then previously.
Local authorities can also apply for the Scottish Government to grant pressured area status for designated localities, resulting in the suspension of the right to buy for all modernised tenancies in local authority and registered social landlord properties for up to five years. So far, eight local authorities have made successful applications for pressured area status. Furthermore, the 2007 Scottish Government discussion document Firm foundations: the future of housing in Scotland suggests that new social housing should be exempt from right to buy.
Public authority housing
Public authority stock levels have been decreasing each year since the 1980s. This is mainly due to tenants buying their homes under right to buy coupled with a decline in the number of new public authority dwellings being built, as well as community ownership programmes whereby a public authority transfers either all or part of its housing stock and management function to registered social landlords ( RSLs).
The New Towns established during the 40s, 50s and 60s were wound up in the mid 90s, with most of the stock being transferred to other public authorities. Between 1990 and 2005, Scottish Homes transferred about 75,000 units previously owned by the Scottish Special Housing Association to housing associations and co-operatives.
During 2003, three councils transferred their stock to RSLs (Dumfries and Galloway, Glasgow and Scottish Borders). While the decrease in housing stock had been running at 3%-4% per year since the late 1990s, primarily due to right to buy sales, the transfers resulted in the loss of over 20% of the total stock. Since then, Argyll and Bute Council and Comhairle nan Eilean Siar have also transferred their stock, and Inverclyde Council is currently in the process of doing so.
Current figures for social sector stock as at March 2007 show that of the 608,000 units, just under 60% is owned by public authorities. This represents a substantial change since the mid 1990s when public authorities owned nearly 90% of the 777,000 units of social rented stock. The increased contribution of registered social landlords to the social rented sector is reflected in rising stock levels since the late 1990s.
Public sector vacant stock
Public sector dwellings can be vacant for a variety of reasons, such as being part of a planned disposal or modernisation/repair programme, or in low demand areas. While the overall amount of stock is decreasing, the proportion of vacant stock as at 31 March for both normal letting and all stock remaining shows a small but fairly consistent decrease in recent years, from 2% to about 1% for normal letting stock. The most recent snapshot figures for 2007 show about 10,600 vacant dwelling, of which about 3,200 consist of normal letting stock.
Housing for older people and those with disabilities
Housing for older people and those with disabilities is provided by both public authorities and housing associations. In addition, programmes such as Supporting People have helped to meet specific housing needs of older and other vulnerable people to give them the opportunity to continue to live in their own homes. Housing for people with variable needs is currently mainly classified as very sheltered, sheltered, medium dependency, wheelchair and ambulant disabled, although figures can vary from year to year as dwellings may be adapted to suit the particular needs of tenants, or re-classified by providers.
Overall, the amount of very sheltered accommodation has shown consistent increases every year, rising from about 700 in 1996 to 5,100 in 2007. Figures for sheltered accommodation have remained fairly constant during the past 10 years at about 33,000-35,000 units, while the less specialised medium dependency housing has shown an overall drop from 17,600 to 12,800 units since 1996. Wheelchair housing has increased from 2,300 in 1996 to 5,800 in 2007.
Housing management
Local authority lettings
Mirroring the falling stock levels, the number of local authority lettings has decreased each year since the early 2000s. During 2006-07 there were about 30,000 permanent lettings made, a decrease of over 40% compared to 2001-02.
The proportion of lets allocated to homeless applicants is a key indicator in measuring local authorities' capacity to respond to changes in homelessness legislation in relation to removing the distinction between priority and non-priority need in 2012. Over the past couple of years, the proportions of local authority lets to homeless applicants have increased, with the latest figures confirming the observed upward trend. In 2006-07, 34% of all local authority lettings were to homeless households, compared to 32% for 2005-06. This represents a substantial increase compared to the situation a decade ago (12% in 1996-97).
Local authority evictions
Local authority evictions are currently running at about 1,000 per year, with a small but consistent increase over the past three years. This represents about 6% of all cases proceeding to court.
Houses in multiple occupation
The number of licences in force has increased year on year since the introduction of the mandatory licensing scheme in 2001. The most recent figures for 2007 show about 7,900 licences in force at 31 March, 4% more than the previous year. There were 2,500 new applications received in 2006-07, 6% more than the year before.