Herring in the Firth of Clyde - setting the total allowable catch for 2022: consultation
Marine Scotland is carrying out this consultation on behalf of the UK Fisheries Administrations, to seek views on the level of the 2022 TAC, to permit the allocation of Clyde herring quota to UK fishermen.
5. Scientific information on the status of herring (Clupea harengus) in the Clyde Sea (ICES Statistical Rectangles 39E4 - 40E5) in 2022
Dr Neil Campbell and Dr Campbell Pert, Marine Scotland Science
Marine Scotland Science, 375 Victoria Road, Aberdeen, AB11 9DB
Executive Summary
The herring fishery in the Clyde has declined from its peak in the 1960s, with catches typically less than 500 tonnes over the last 20 years and only 180 tonnes landed in 2021.
Scientific surveys suggest that the herring population currently found in the Clyde is heavily dominated by young age classes (1- and 2-year old herring). These fish are below the minimum landing size in place for this area.
Clyde herring are known to be linked to other herring stocks to the west of Scotland, which are currently in poor condition.
There is no evidence that the current total allowable catch (TAC) for the Clyde should be increased beyond its current level of 583 tonnes.
There is also no evidence to suggest that the TAC should be reduced, nor that the other management measures in place for herring in the Clyde should be changed.
History of the fishery
The Firth of Clyde is a fjordic like system, reaching over 100 km into the southwest coast of Scotland which has a centuries-long history of fishing. Advances in fishing gears and vessels, and a succession of fishery management regulations have altered the fishery and the fish stocks of the Clyde.
The herring fishery in the Firth of Clyde was one of the most economically important species to fishers during the first half of the 20th century. Annual landings of herring between 1900 and 1940 were typically 10 – 20,000 tonnes/year and reached its peak between the late-1950s and mid-1960s. From the mid-1960s to 1980s landings fluctuated between 2,000 and 5,000 tonnes. A TAC was first introduced in 1984; the TAC was 1,000 tonnes from 1993 until 2007, and has been gradually reduced since (Table 1). The TAC since 2015 has been 583 tonnes per year.
Over time, the fishery has been prosecuted by Scottish and Northern Irish vessels. Between 1995 and 2000 the majority of the catch was taken by Scotland vessels. During the 2000s the majority of the catch was been taken by Northern Ireland although from 2013 there were no reported landings until 2021 when a Northern Irish vessel had a single landing of 180 tonnes (Figure 1).
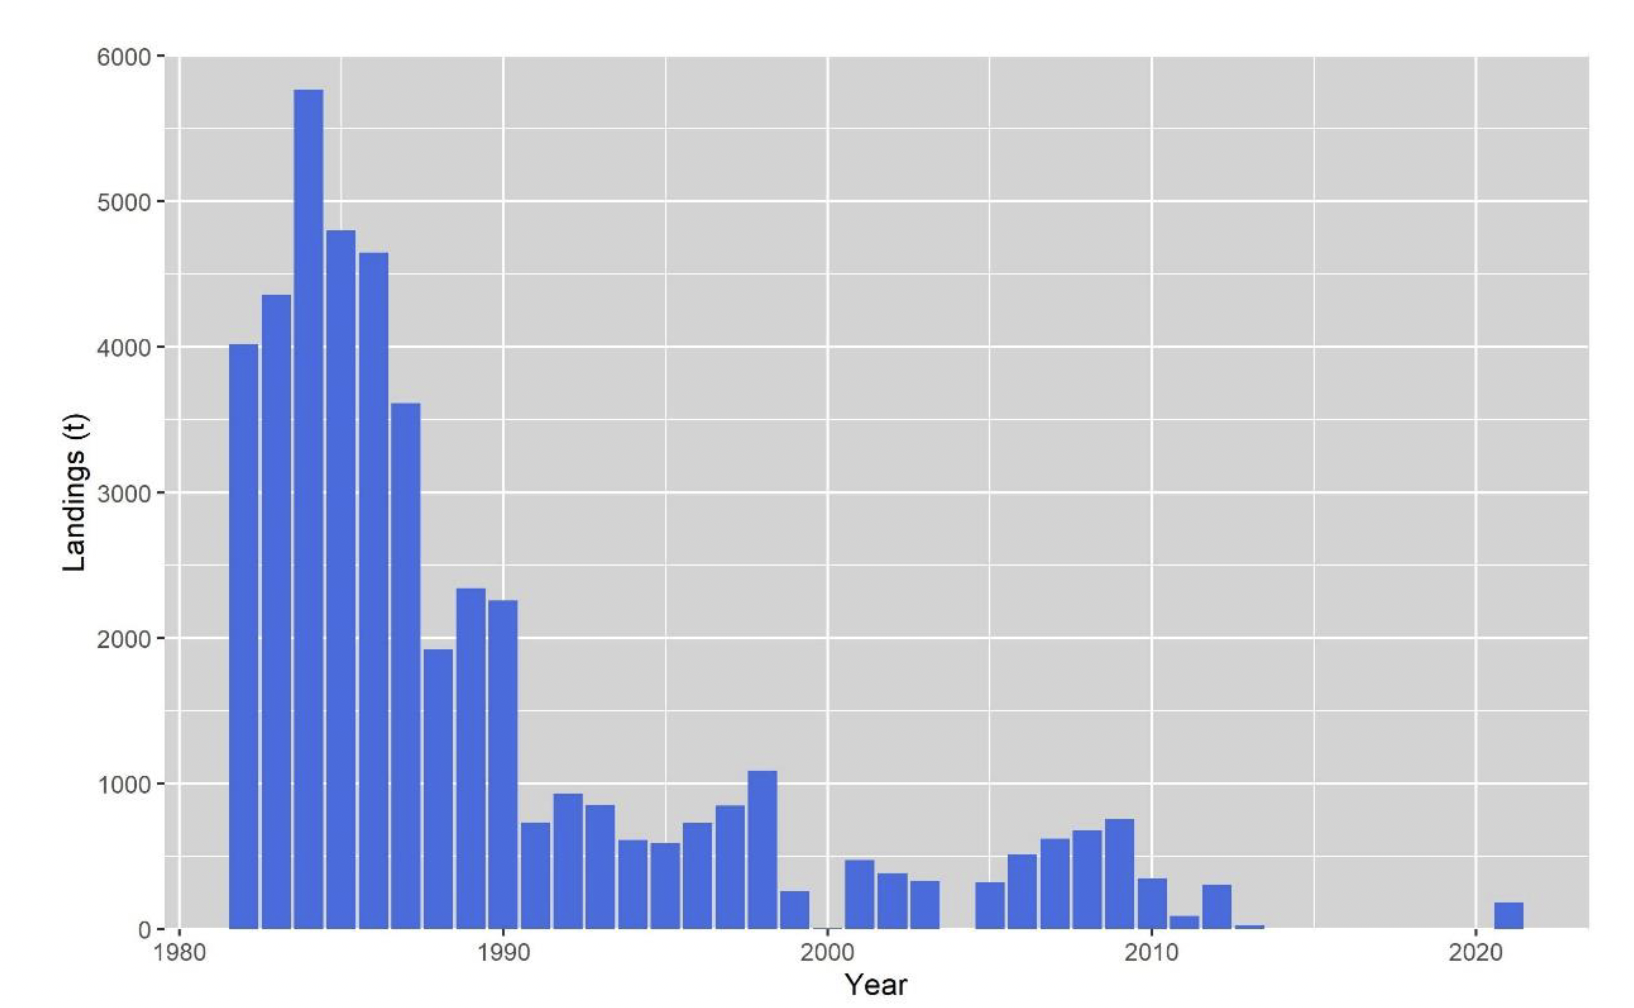
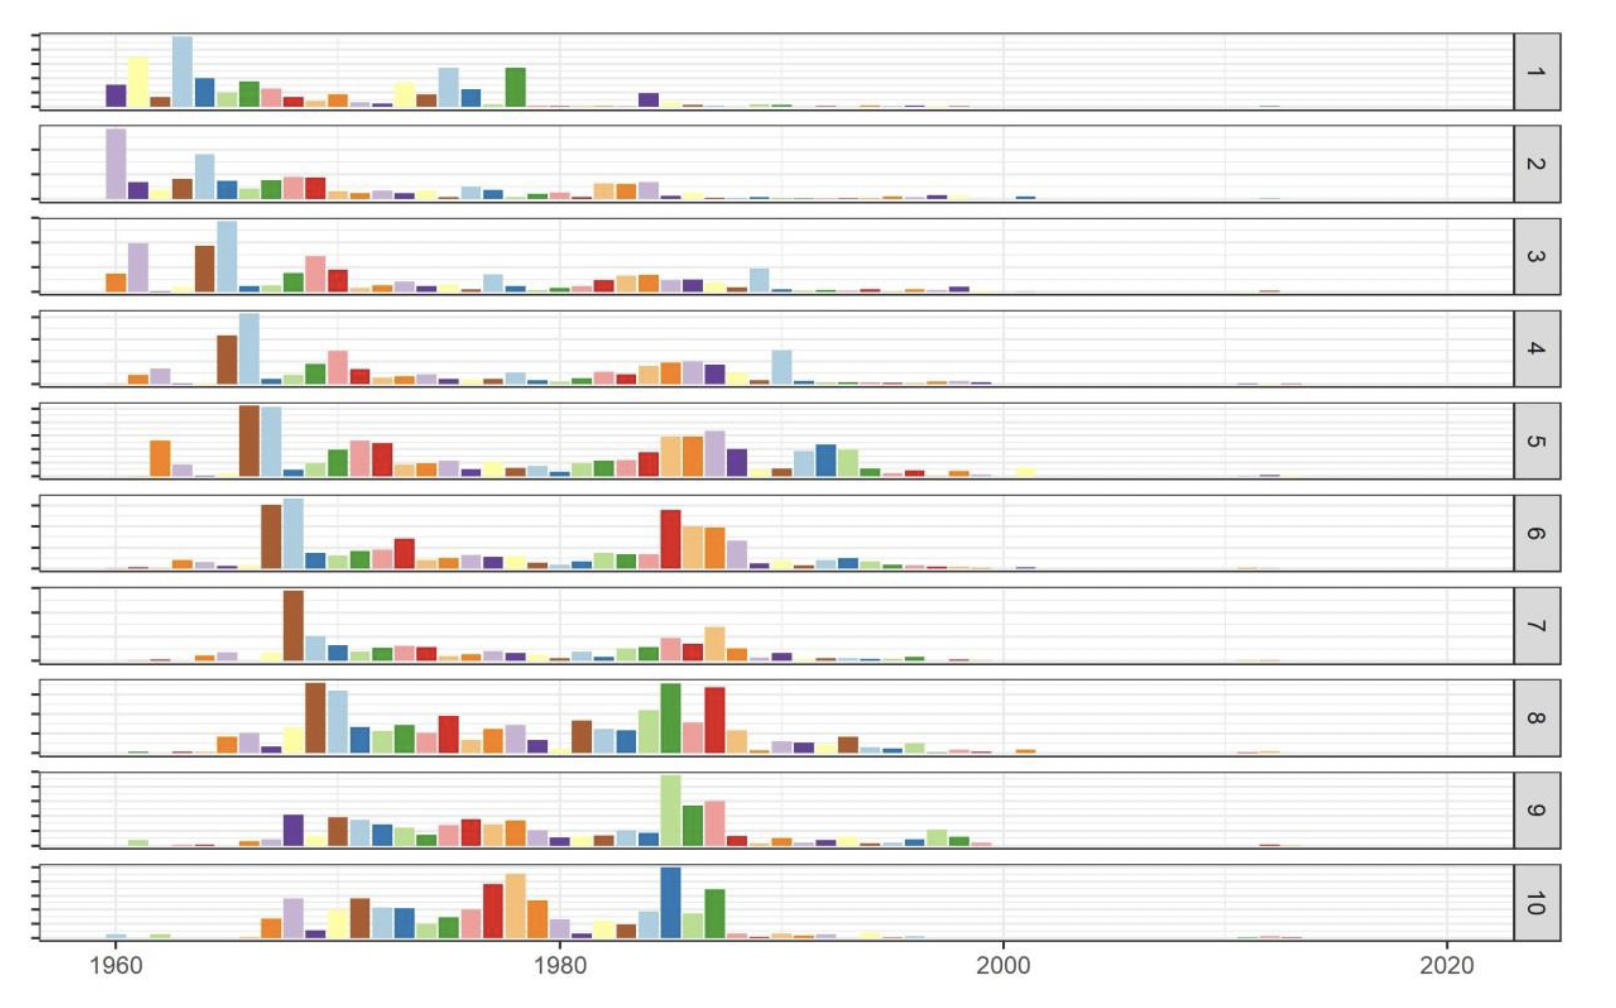
Since 1995 there has been virtually no unallocated catch or discarding in the Clyde herring fishery. Landings data are available from 1955, with data for 1982 – 2020 presented in Figure 1 and Table 1, but catch and sampling data are incomplete resulting in a large proportion of the data being estimated; sampling effort has been low and the numbers-at-age data are unavailable from 2002 to 2010 and in 2021. Nevertheless, it is possible to track cohorts of herring as they move through the population. Figure 2 shows there have been no strong year classes found in the Clyde since the 1990s.
| Year | 1982 | 1983 | 1984 | 1985 | 1986 | 1987 | 1988 | 1989 | 1990 | 1991 | 1992 | 1993 | 1994 | 1995 |
|---|---|---|---|---|---|---|---|---|---|---|---|---|---|---|
| Scotland | 2 506 | 2 530 | 2 991 | 3 001 | 3 395 | 2 895 | 1 568 | 2 135 | 2 184 | 713 | 929 | 852 | 608 | 392 |
| Other UK | - | 273 | 247 | 22 | - | - | - | - | - | - | - | 1 | - | 194 |
| Unallocated1 | 262 | 293 | 224 | 433 | 576 | 278 | 110 | 208 | 75 | 18 | - | - | - | - |
| Discards | 1 253 | 1 265 | 2 3083 | 1 3443 | 6793 | 4394 | 2454 | -2 | -2 | -2 | -2 | -2 | -2 | -2 |
| Agreed TAC | 3 000 | 3 000 | 3 100 | 3 500 | 3 200 | 3 200 | 2 600 | 2 900 | 2 300 | 1 000 | 1 000 | 1 000 | ||
| Total | 4 021 | 4 361 | 5 770 | 4 800 | 4 650 | 3 612 | 1 923 | 2 343 | 2 259 | 731 | 929 | 853 | 608 | 586 |
| Year | 1996 | 1997 | 1998 | 1999 | 2000 | 2001 | 2002 | 2003 | 2004 | 2005 | 2006 | 2007 | 2008 | 2009 |
| Scotland | 598 | 371 | 779 | 16 | 1 | 78 | 46 | 88 | - | - | - | 163 | 54 | 266 |
| Other UK | 127 | 475 | 310 | 240 | 0 | 392 | 335 | 240 | - | 318 | 512 | 458 | 622 | 488 |
| Unallocated1 | - | - | - | - | - | - | - | - | - | - | - | - | - | - |
| Agreed TAC | 1 000 | 1 000 | 1 000 | 1 000 | 1 000 | 1 000 | 1 000 | 1 000 | 1 000 | 1 000 | 1 000 | 800 | 800 | 800 |
| Total | 725 | 846 | 1089 | 256 | 1 | 470 | 381 | 328 | 0 | 318 | 512 | 621 | 676 | 754 |
| Year | 2010 | 2011 | 2012 | 2013 | 2014 | 2015 | 2016 | 2017 | 2018 | 2019 | 2020 | 2021 | ||
| Scotland | 48 | 90 | 118 | 21 | 0 | 0 | 0 | 0 | 0 | 0 | 0 | 0 | ||
| Other UK | 301 | 0 | 184 | 0 | 0 | 0 | 0 | 0 | 0 | 0 | 0 | 180 | ||
| Agreed TAC | 720 | 720 | 720 | 648 | 648 | 583 | 583 | 583 | 583 | 583 | 583 | 583 | ||
| Total | 349 | 90 | 302 | 25 | 0 | 0 | 0 | 0 | 0 | 0 | 0 | 180 |
1 Calculated from estimates of weight per box and/or by-catch in the sprat fishery
2 Reported to be at a low level, assumed to be zero, for 1989-1995.
3 Based on sampling.
Information collected since 2011
Fishery data
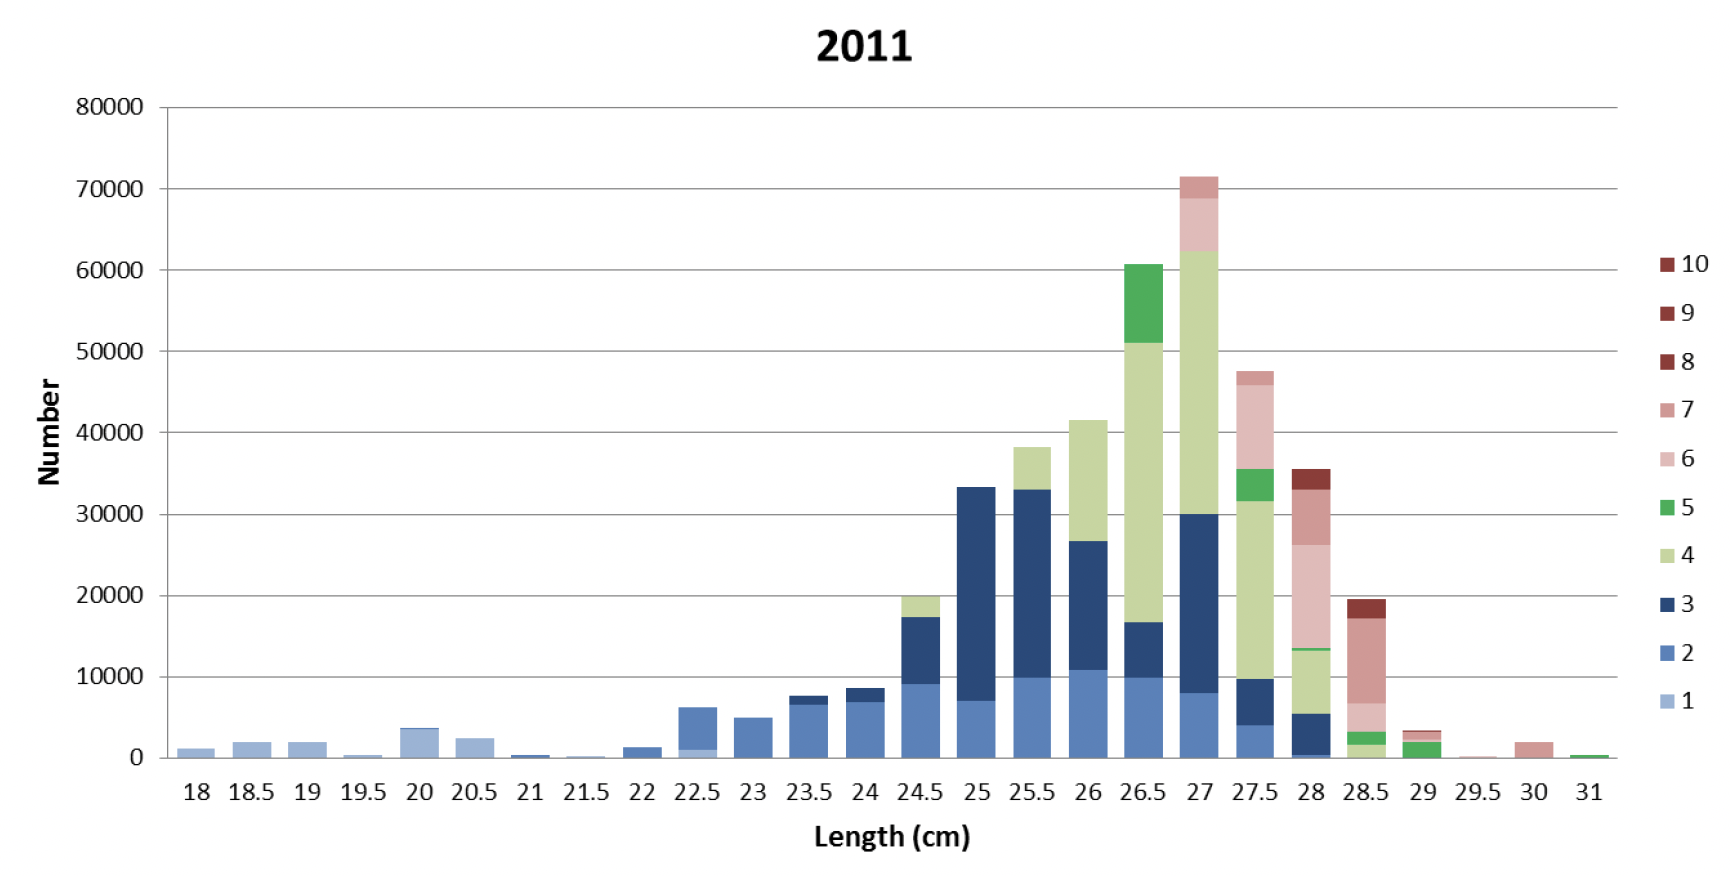
In 2011 the targeted sampling of Clyde herring landings was successfully resumed in collaboration with the Marine Scotland Compliance fishery office in Campbeltown. During the 2011 herring season a total of 6 samples were collected from a total of 7 landings (Table 2). Length information was collected from 693 herring and otoliths were taken and aged from 229 fish.
The fish ranged in size from 18 to 31 cm with a modal length around 27 cm (Figure 3). The landings were composed of fish spanning the full range of ages from 1 to 10 years. Around 40% of the landed fish were 4 years or older.
The 2012 fishery was pursued by two vessels from Scotland operating as a pair team and one from Northern Ireland. The two Scottish vessels made a total of 11 trips and the Northern Irish vessel made one, which accounted for 61% of the total landings (Table 1). From these 12 trips a total of 6 samples were collected. A total of 683 herring were measured and 191 fish were aged (Table 2).
| Year | Landings | Landings sampled | Proportion Sampled | Measured herring | Aged herring |
|---|---|---|---|---|---|
| 2011 | 7 | 6 | 86% | 693 | 229 |
| 2012 | 12 | 6 | 50% | 683 | 191 |
| 2013 | 4 | 2 | 50% | 420 | 280 |
| 2014 | 0 | - | - | - | - |
| 2015 | 0 | - | - | - | - |
| 2016 | 0 | - | - | - | - |
| 2017 | 0 | - | - | - | - |
| 2018 | 0 | - | - | - | - |
| 2019 | 0 | - | - | - | - |
| 2020 | 0 | - | - | - | - |
| 2021 | 1 | 0 | - | - | - |
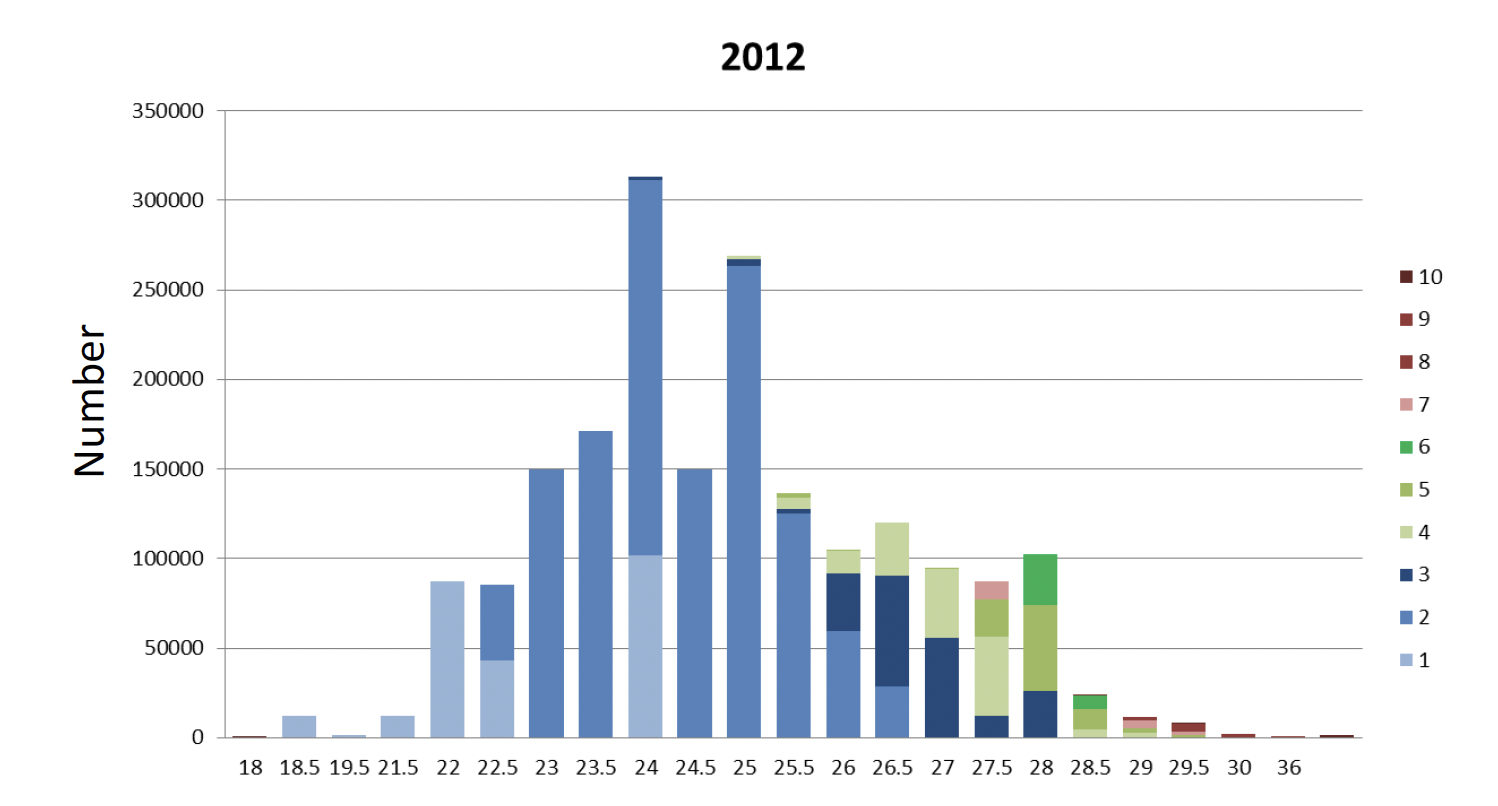
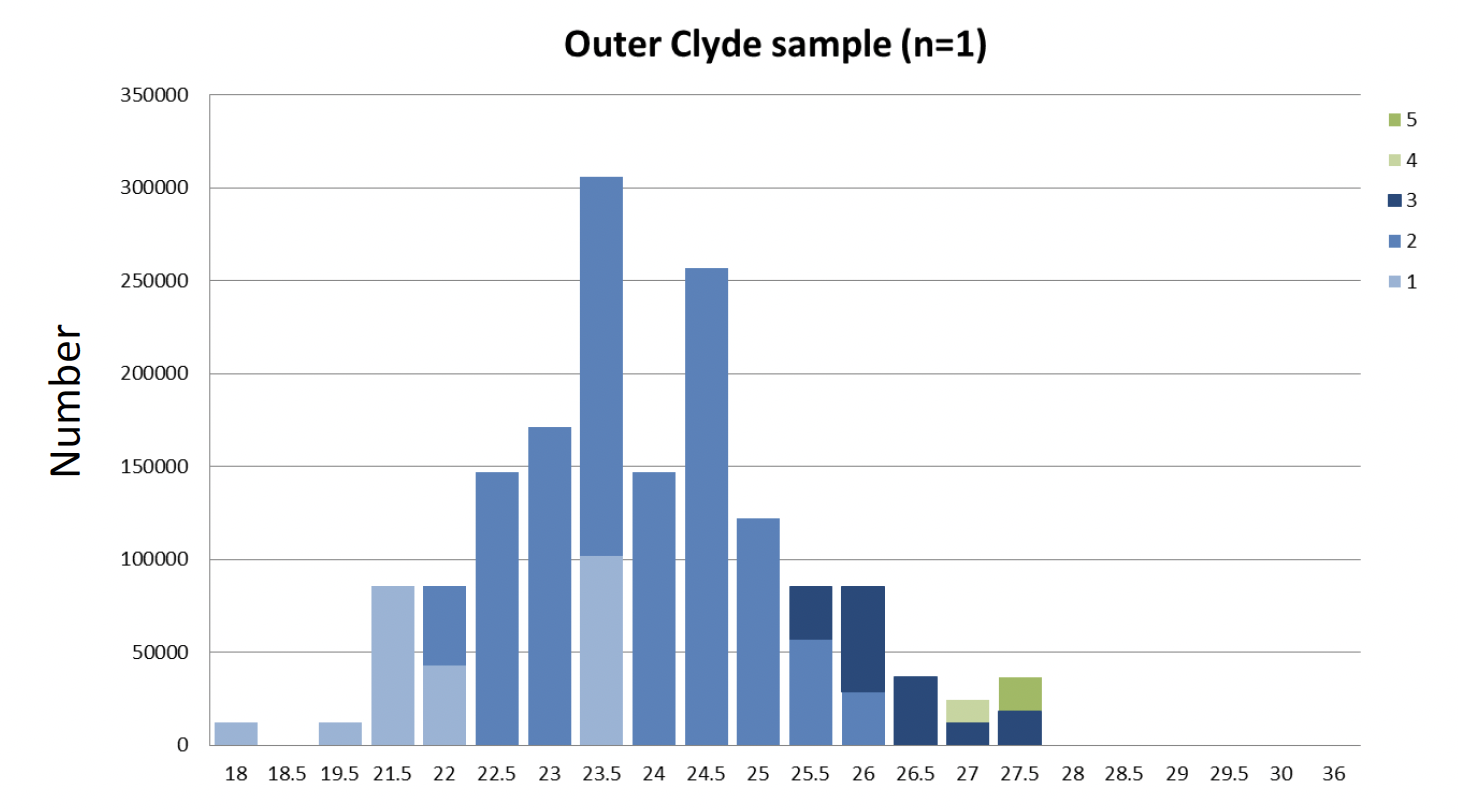
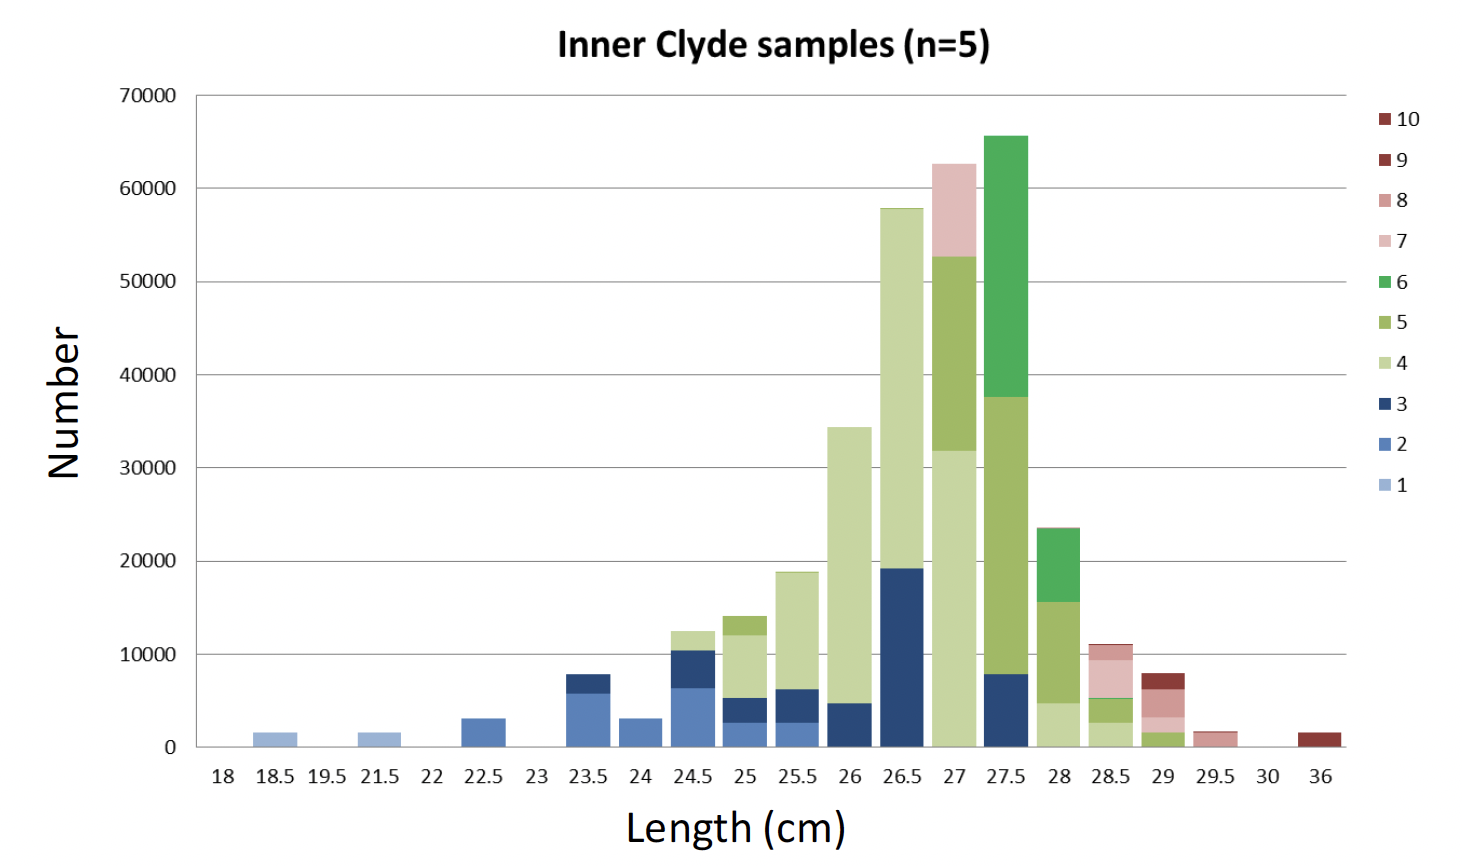
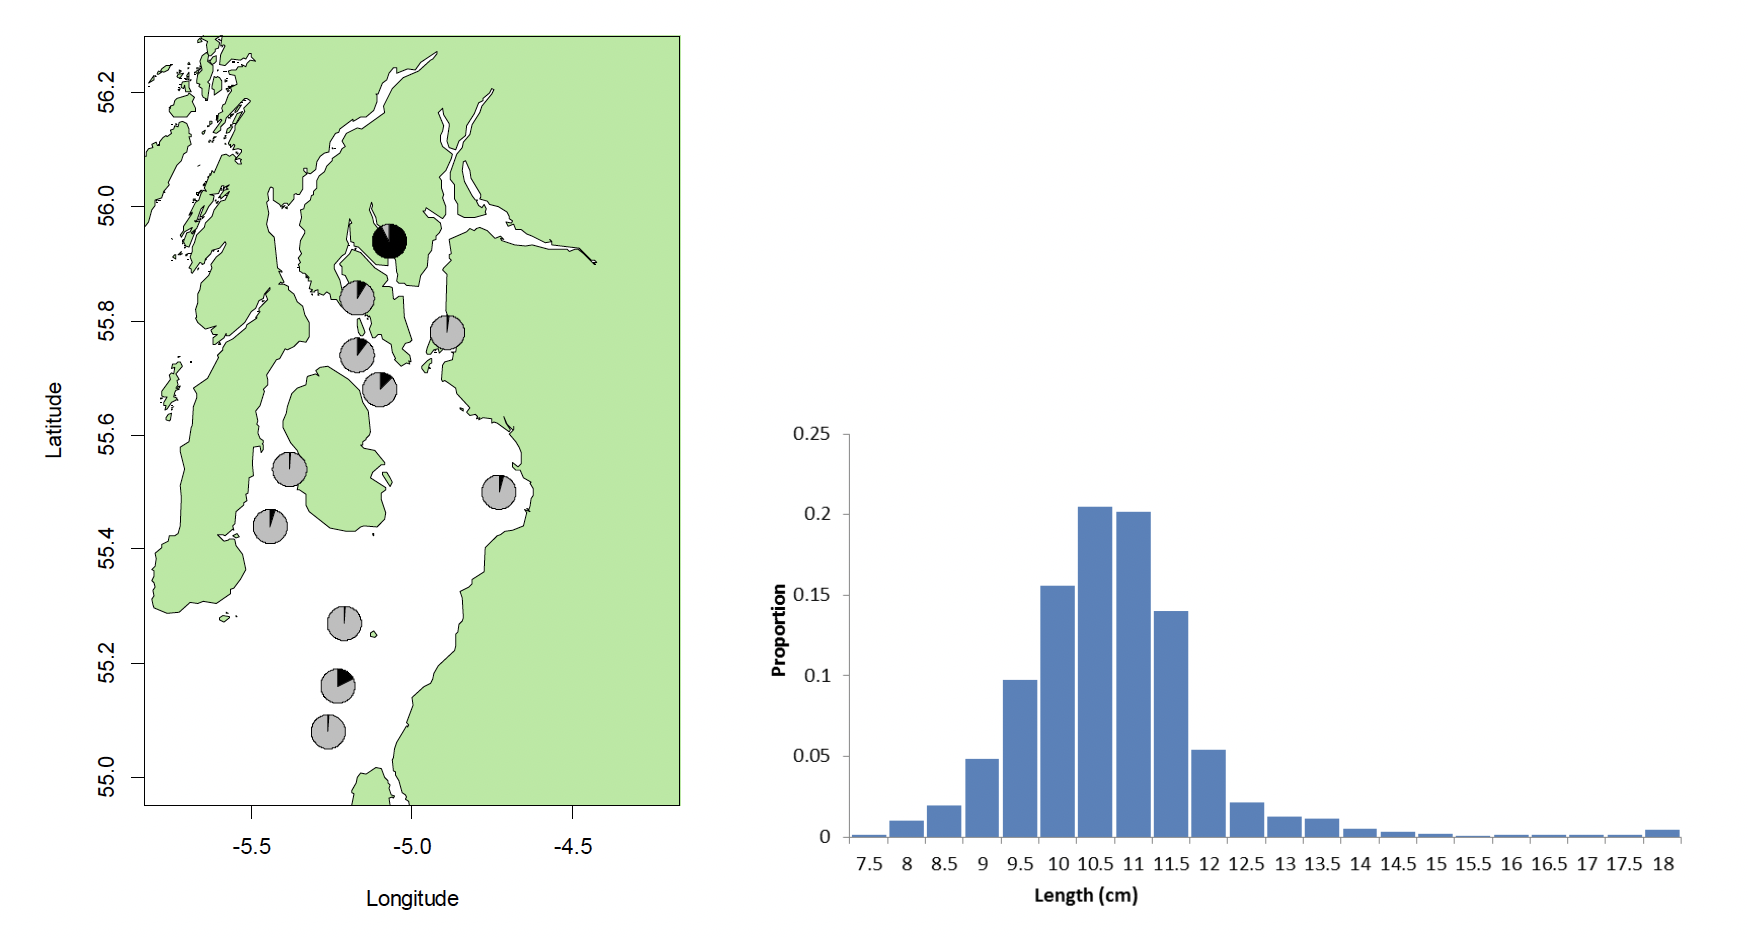
The modal length of the 2012 landings was smaller than in 2011 at 24 cm and the landings were dominated by fish between 1 and 3 years (Figure 4). However the results were dominated by one large landing caught at the outer edge of the Firth of Clyde in contrast to all the other landings sampled in both 2011 and 2012 (Pers. Comm. SFO Campbeltown). The remaining samples all came from the Inner Firth of Clyde and Figure 2 indicates that the samples from this area were distinctly different. The large landing from the outer Clyde was composed solely of smaller, young herring (modal length 23.5 and age range 1 to 5 with 95% of the fish age 3 or below, Figure 3, middle panel). The catches from the Inner Clyde were markedly different and were of a composition much more similar to 2011 (Figure 3, bottom panel). These catches were of fish of a modal length of 27.5 cm spanning the full range of ages. Fish of age 4 or above accounted for 67% of these catches.
The numbers at age in the catch in 2011 were dominated by 2 – 4 year old fish with a reasonable number of older fish (Figure 3). In contrast the 2012 samples are completely dominated by age 2 fish with a very small proportion of older fish. This is, however, entirely driven by the composition of the one very large landing as mentioned above.
In 2013 the fishery was very small with only 21t of registered landings (Table 1). Two out of the 4 trips carried out by the Scottish pair team pursuing the fishery were sampled (Table 2). Length measurements were collected from 420 fish and 280 fish were aged.
The length range of fish from the 2013 fishery was much wider (11.5 to 29 cm) than in previous year although the modal range was similar at 27.5 cm (Figure 5). The landings were dominated by age 5 fish (35%) and close to 90% of the fish were age 5 or below (Figure 6).
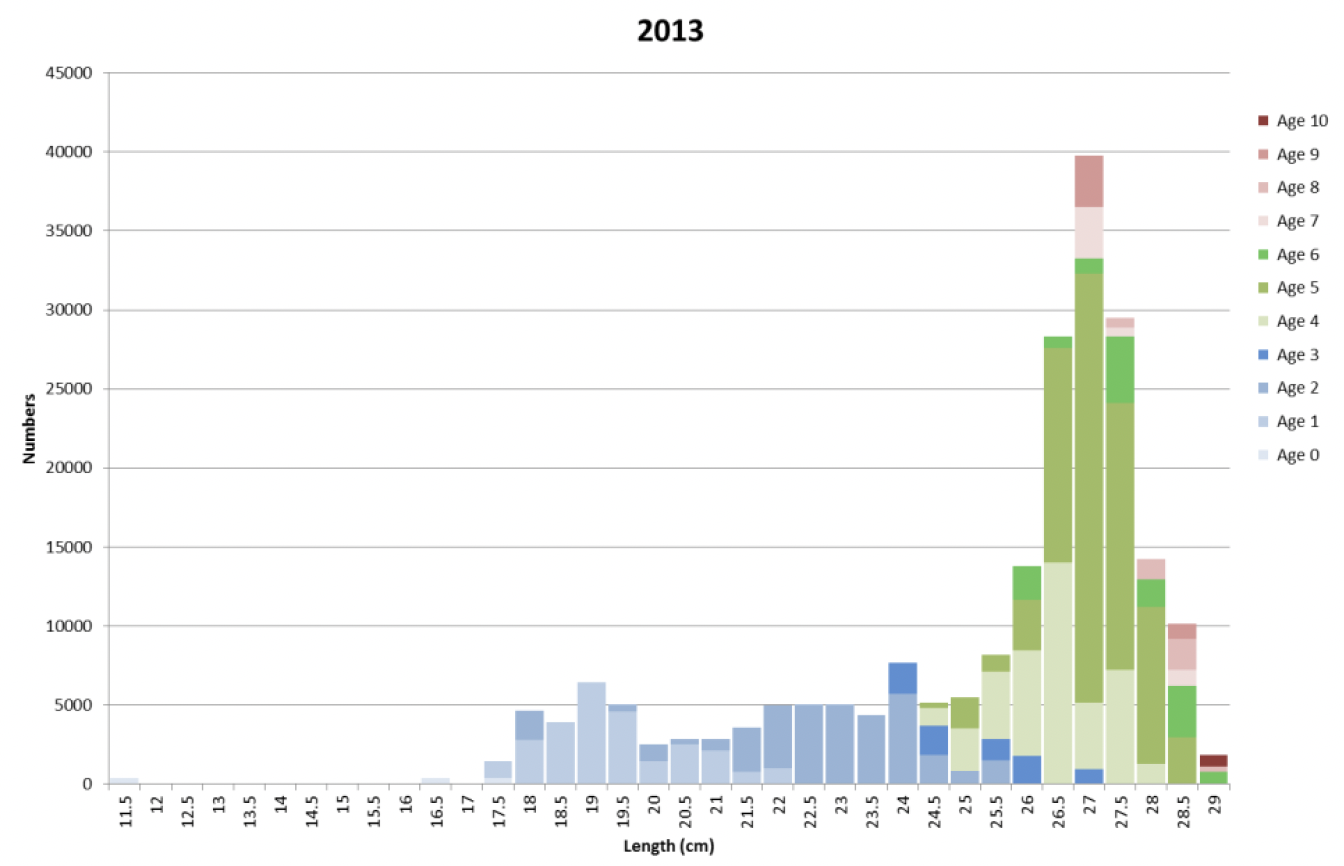
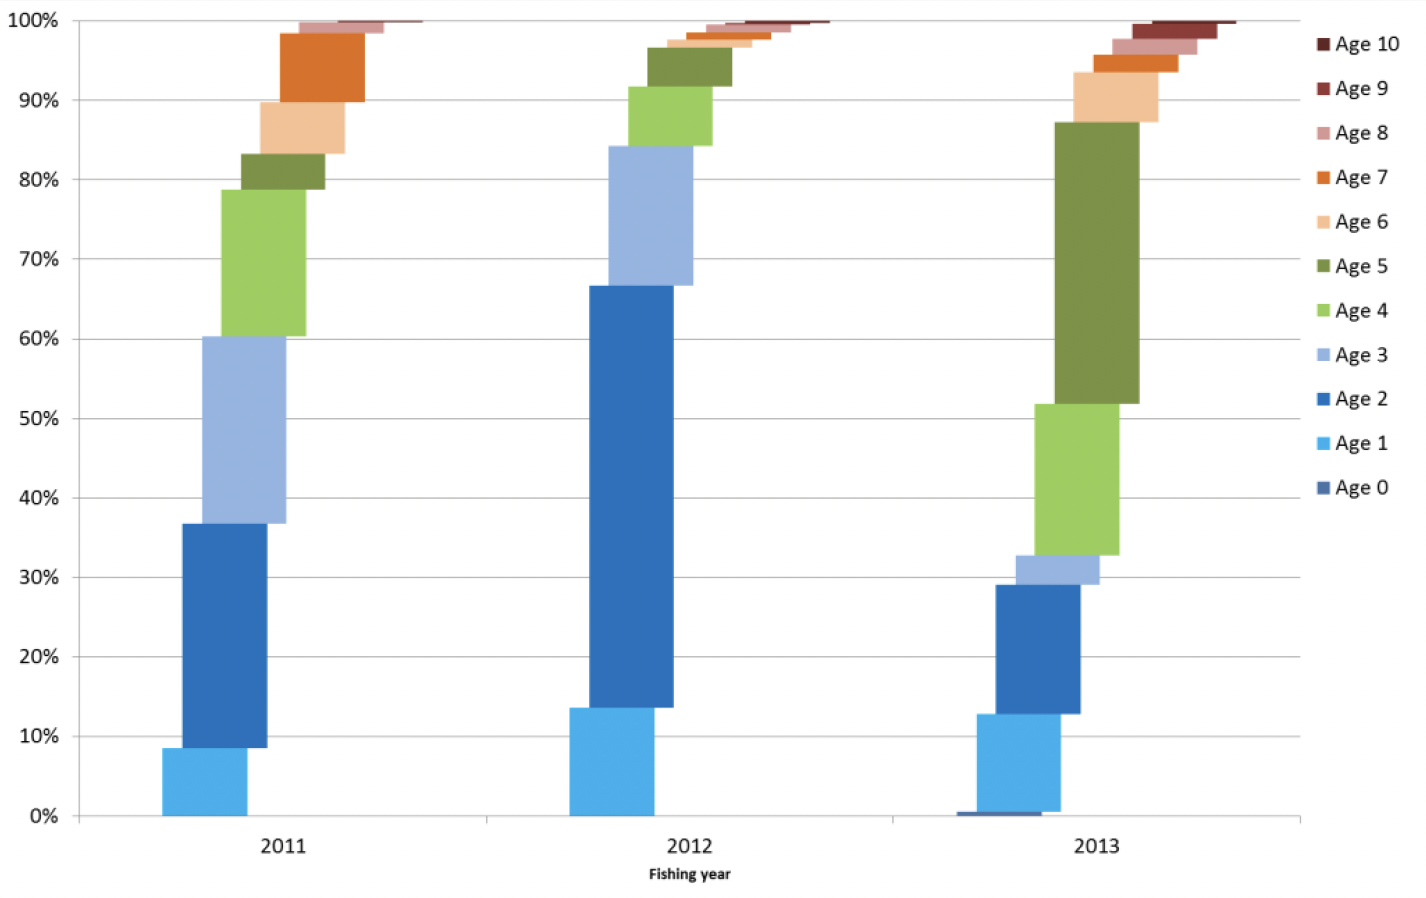
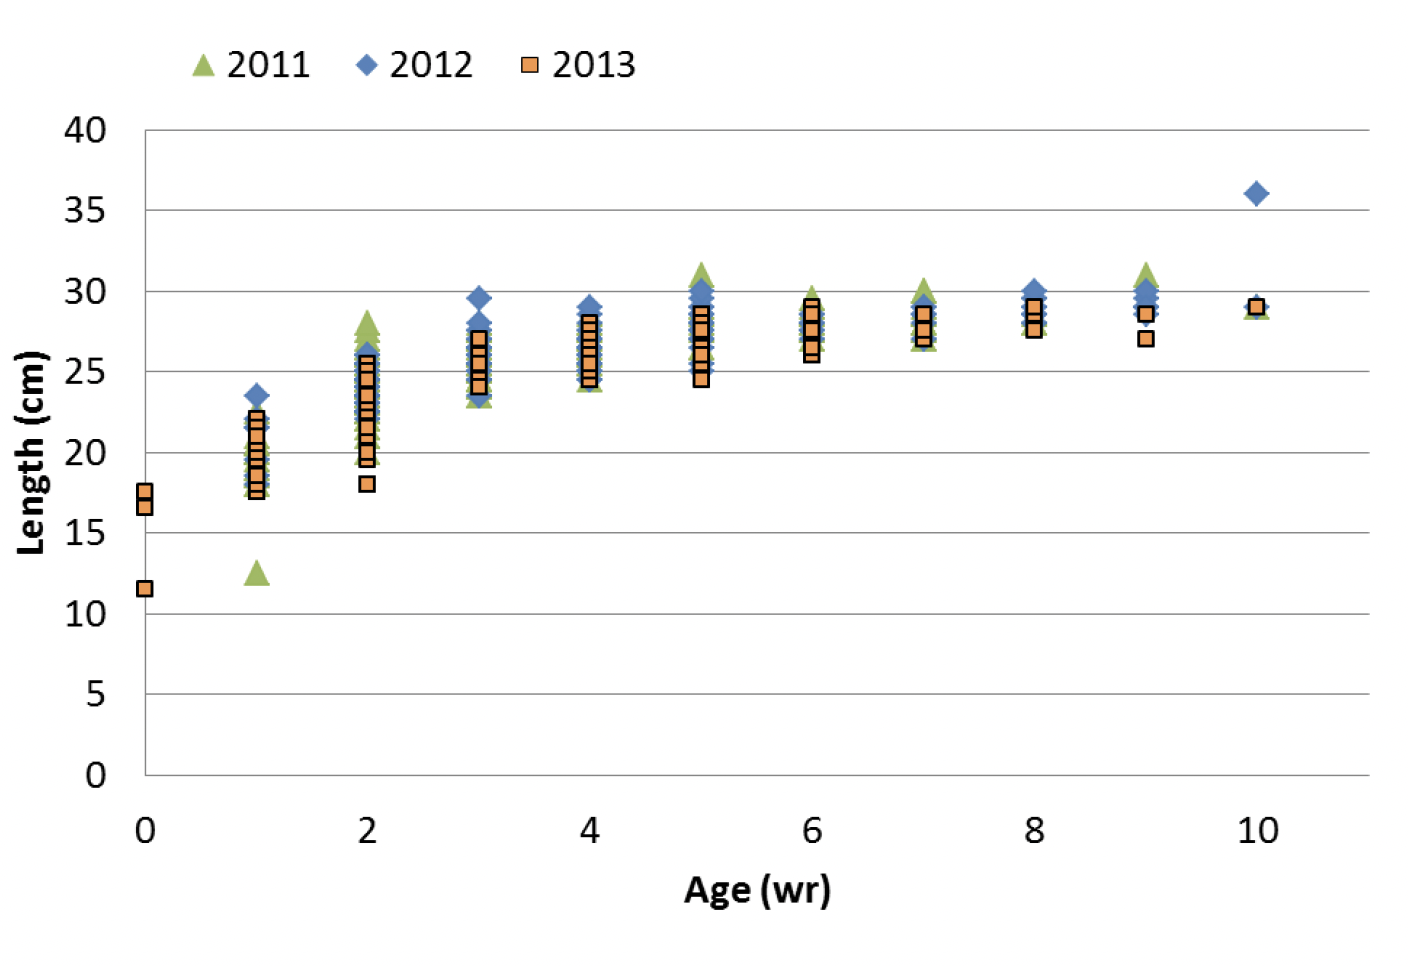
Figure 7 provides a length against age plot, which suggests a fairly rapid growth in the first couple of years, followed by slower growth over a protracted period. This does not fully track the growth of individual year classes and should be treated as a preliminary analysis. Data from the three years from which this data exists so far is in good agreement.
Since 2013 there has only been a single official landing of Clyde herring. During 2021 there was a single landing of 180t of herring, however no samples were provided.
Additional licence conditions for vessels operating in the Clyde fishery require the supply of GPS data from the vessels operating in the area and a haul by haul log of catches. Together with the specific sample information described above this will play an important role in furthering our knowledge of the state of the stock.
2. Assessment and surveys
Prior to 2011
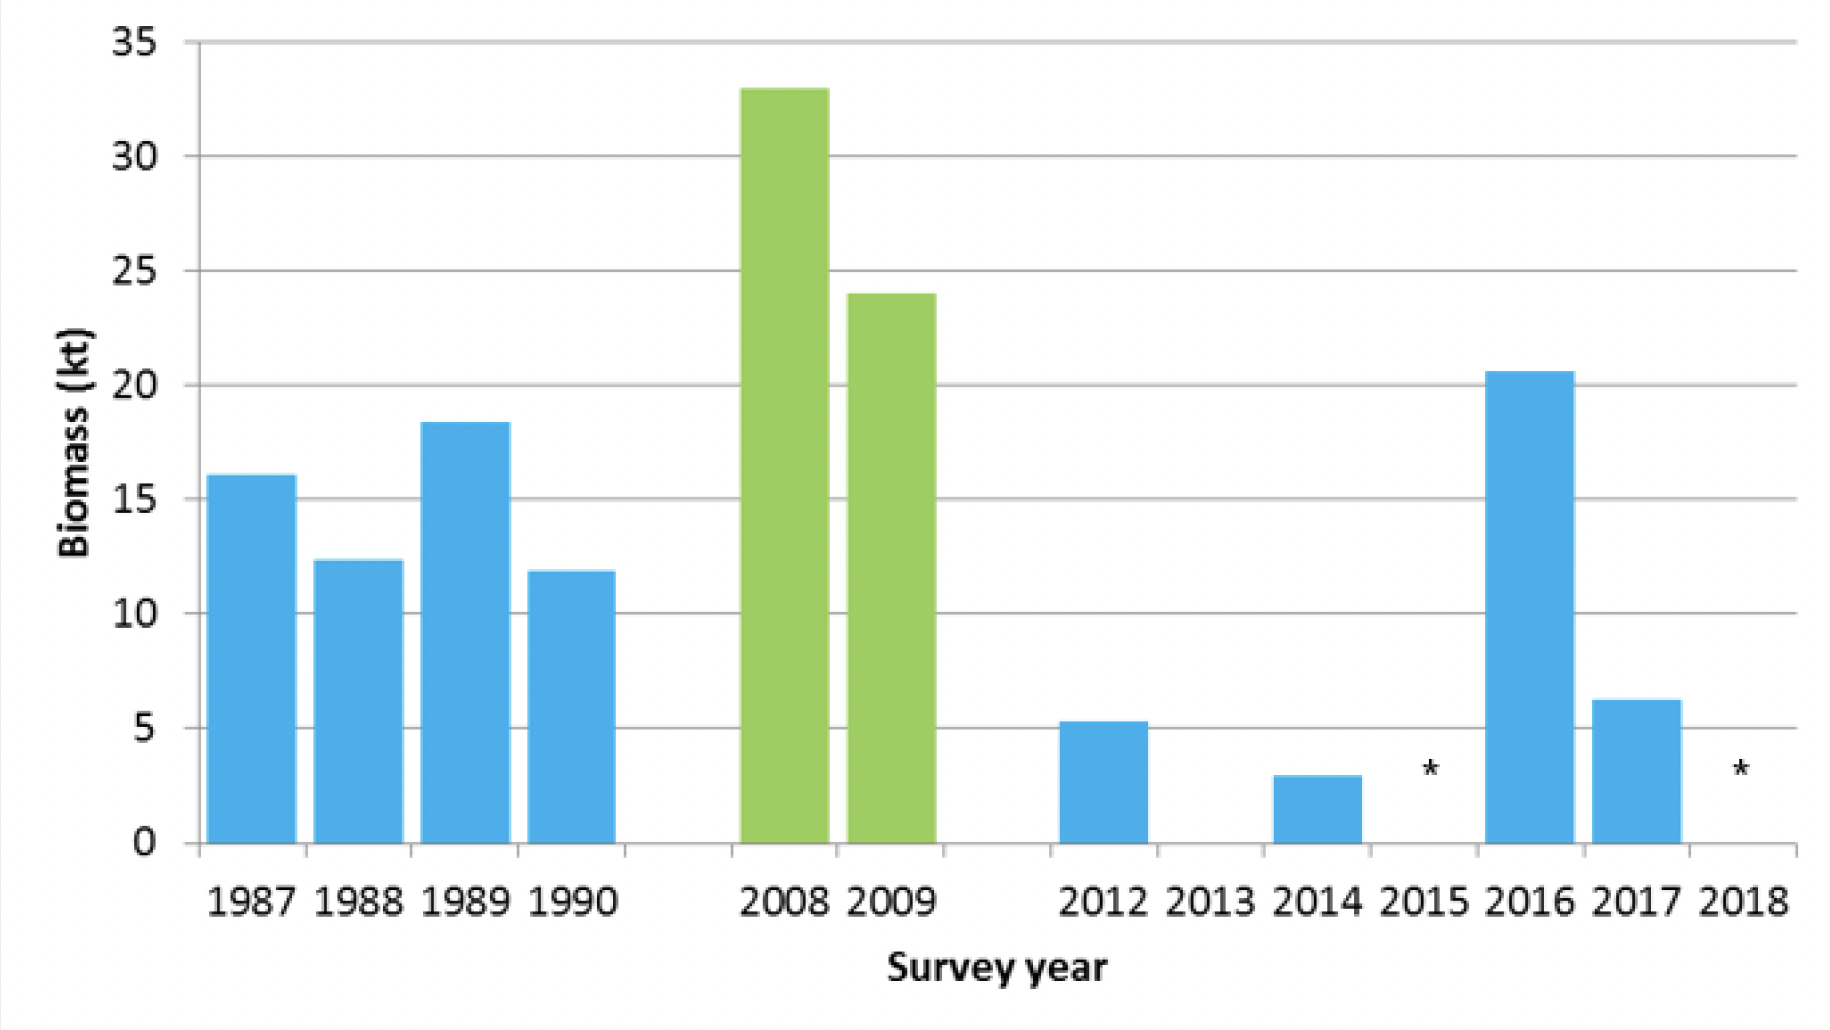
The last analytical assessment for Clyde herring was performed in 1990. Spring trawl surveys were carried out from 1985 to 1993. Egg surveys (on spring spawners) were carried out from 1988 to 1993. Acoustic surveys were carried out in July from 1987 to 1990 and again in 2008-2009 (Table 3, Figure 8 and Figure 9).
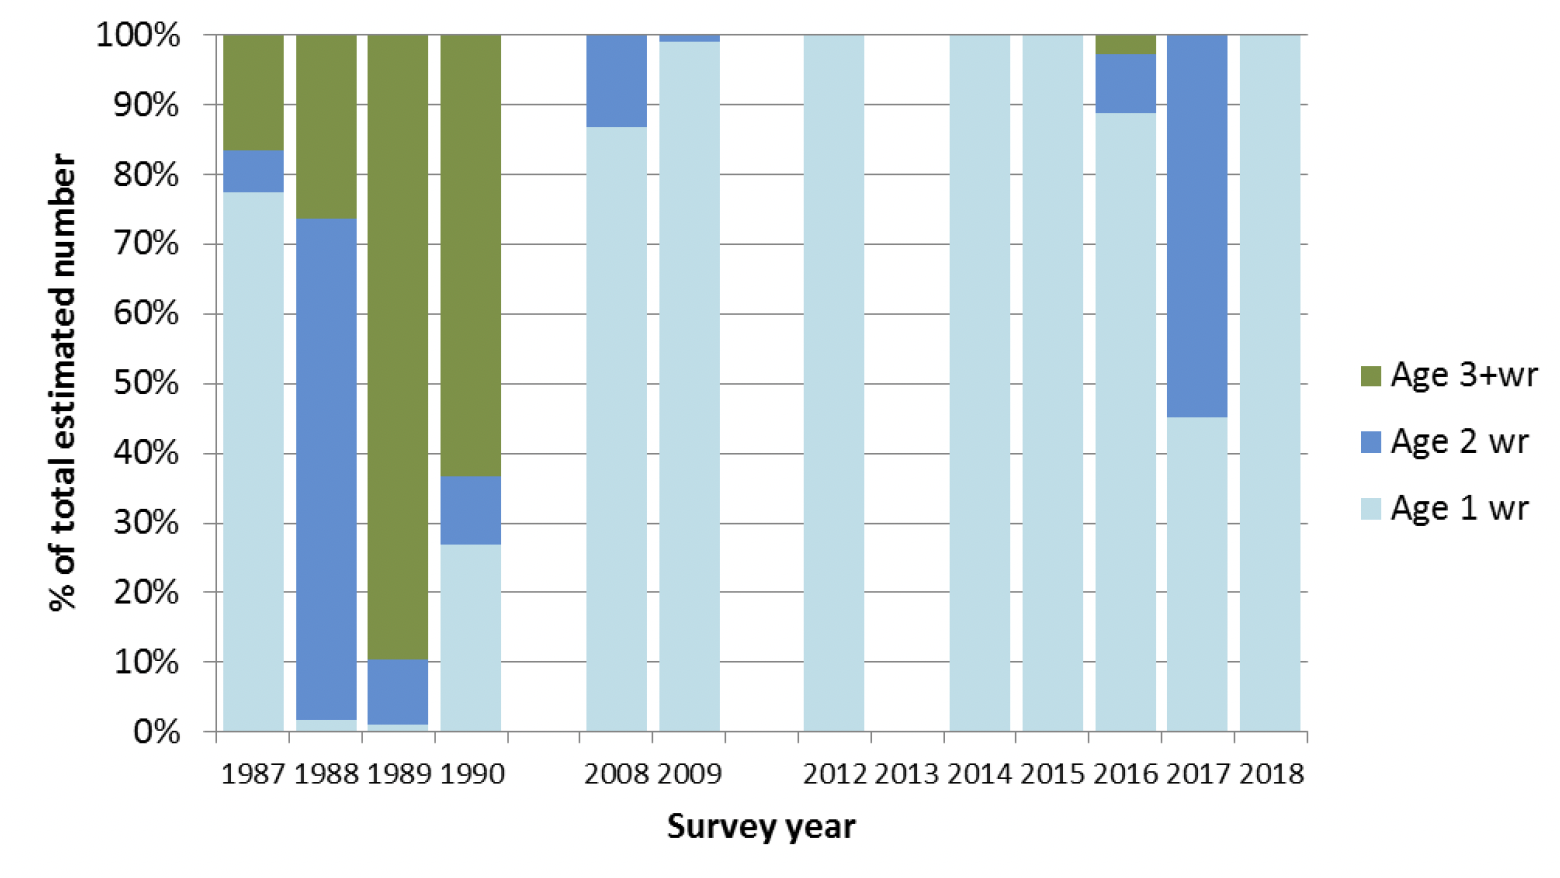
The 2008 and 2009 acoustic surveys showed a higher biomass than in earlier years (33kt and 24kt respectively, Figure 12). The biomass was predominantly within the boundaries of the Clyde, and composed solely of juveniles (2008: 86% 1-group, 13% 2-group; 2009: 99% 1-group, 1% 2-group) and a complete lack of herring of the size targeted by the fishery (Figure 13).
| Age (year) | 1987 | 1988 | 1989 | 1990 | 2008 | 2009 |
|---|---|---|---|---|---|---|
| 1 | 148.2 | 1.6 | 1.2 | 19.9 | 86 | 99 |
| 2 | 11.5 | 67.4 | 9.5 | 7.1 | 13 | 1 |
| 3 | 9.2 | 6.2 | 80.3 | 5.5 | 0 | 0 |
| 4 | 11.5 | 4.8 | 6.7 | 33.3 | 0 | 0 |
| 5 | 5.7 | 5.5 | 2.4 | 4.0 | 0 | 0 |
| 6 | 3 | 3.6 | 1.8 | 2.5 | 0 | 0 |
| 7 | 1.2 | 2.8 | 1.1 | 0.7 | 0 | 0 |
| 8 | 0.7 | 1.5 | 0.32 | 0.6 | 0 | 0 |
| >9 | 0.4 | 0.4 | 0.1 | 0.2 | 0 | 0 |
| Biomass | 16.1 | 12.4 | 18.4 | 11.9 | 33 | 24 |
Acoustic surveys 2012 - 2018
A new series of pelagic acoustic surveys in the Clyde was carried out each October between 2012 and 2018, apart from 2013 where the survey was cancelled due to vessel breakdown.
In 2015 and 2018 intermittent faults with the 38kHz transducer means that it was not possible to estimate total biomass for these years. The results with regards to the size and age composition of herring as well as the distribution of herring and sprat in the Clyde is however available from those years.
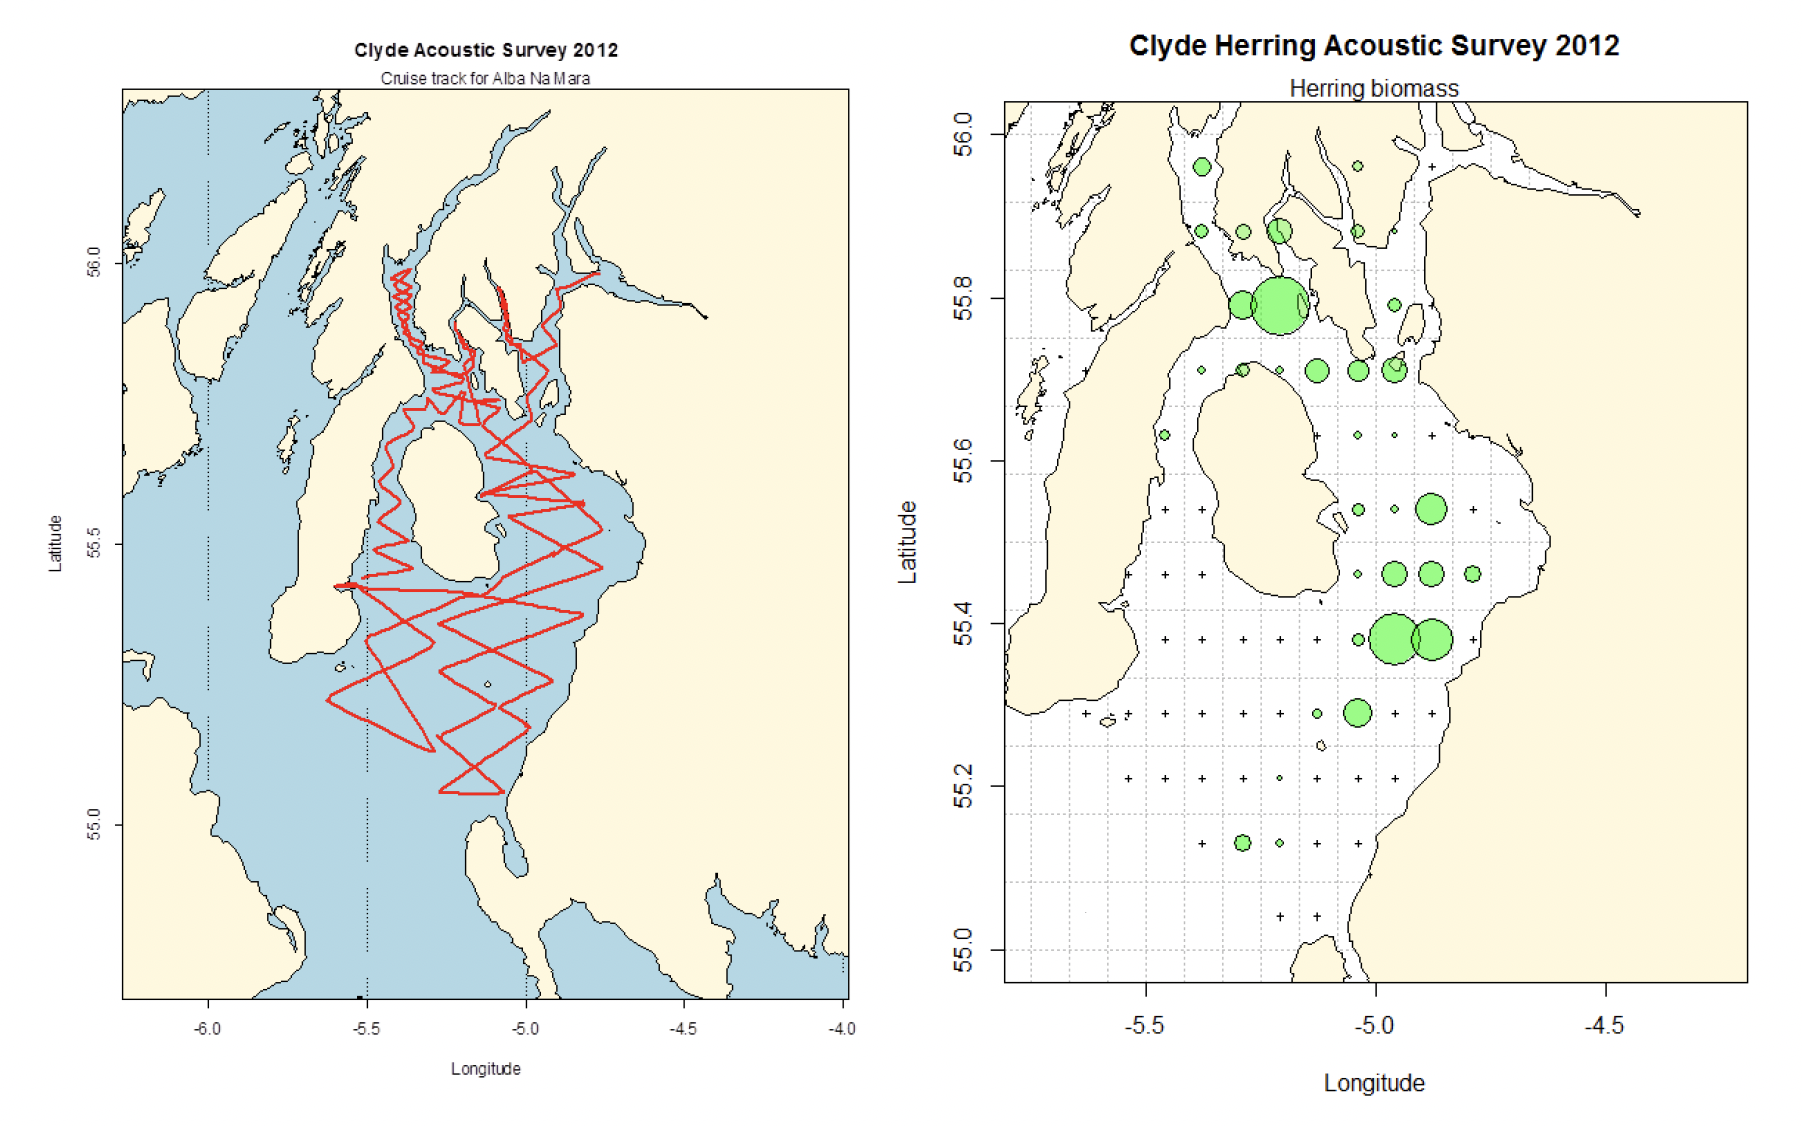
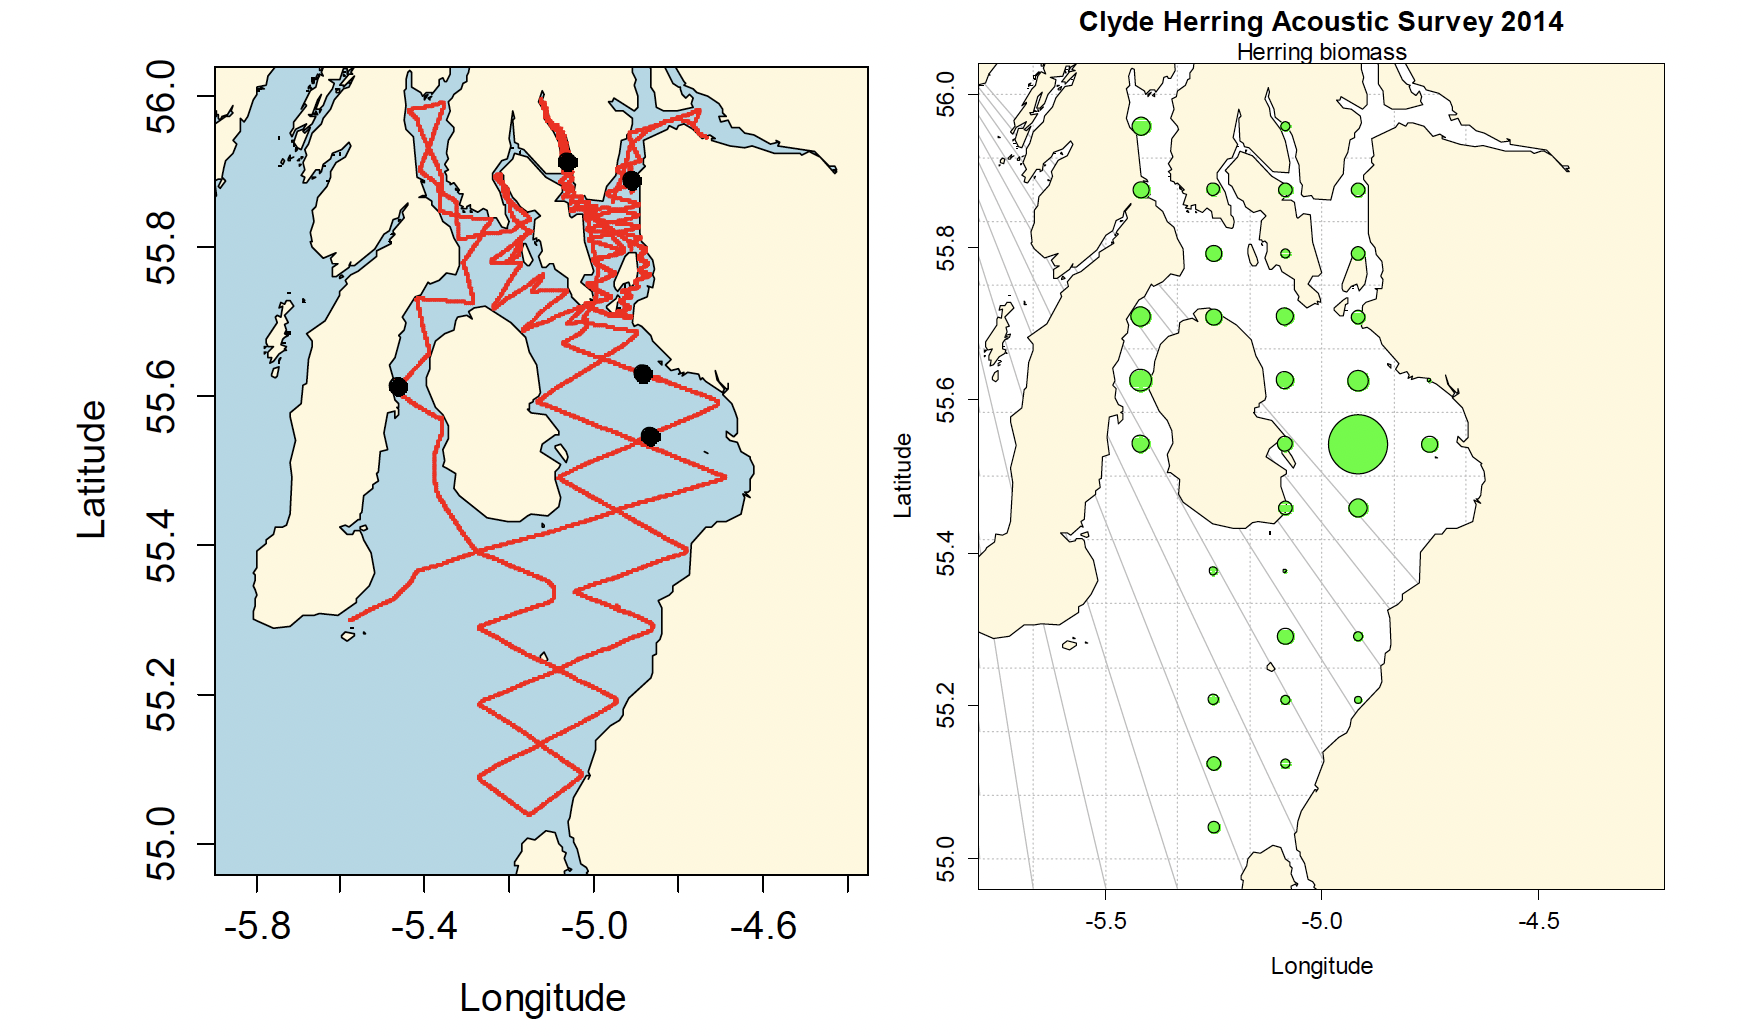
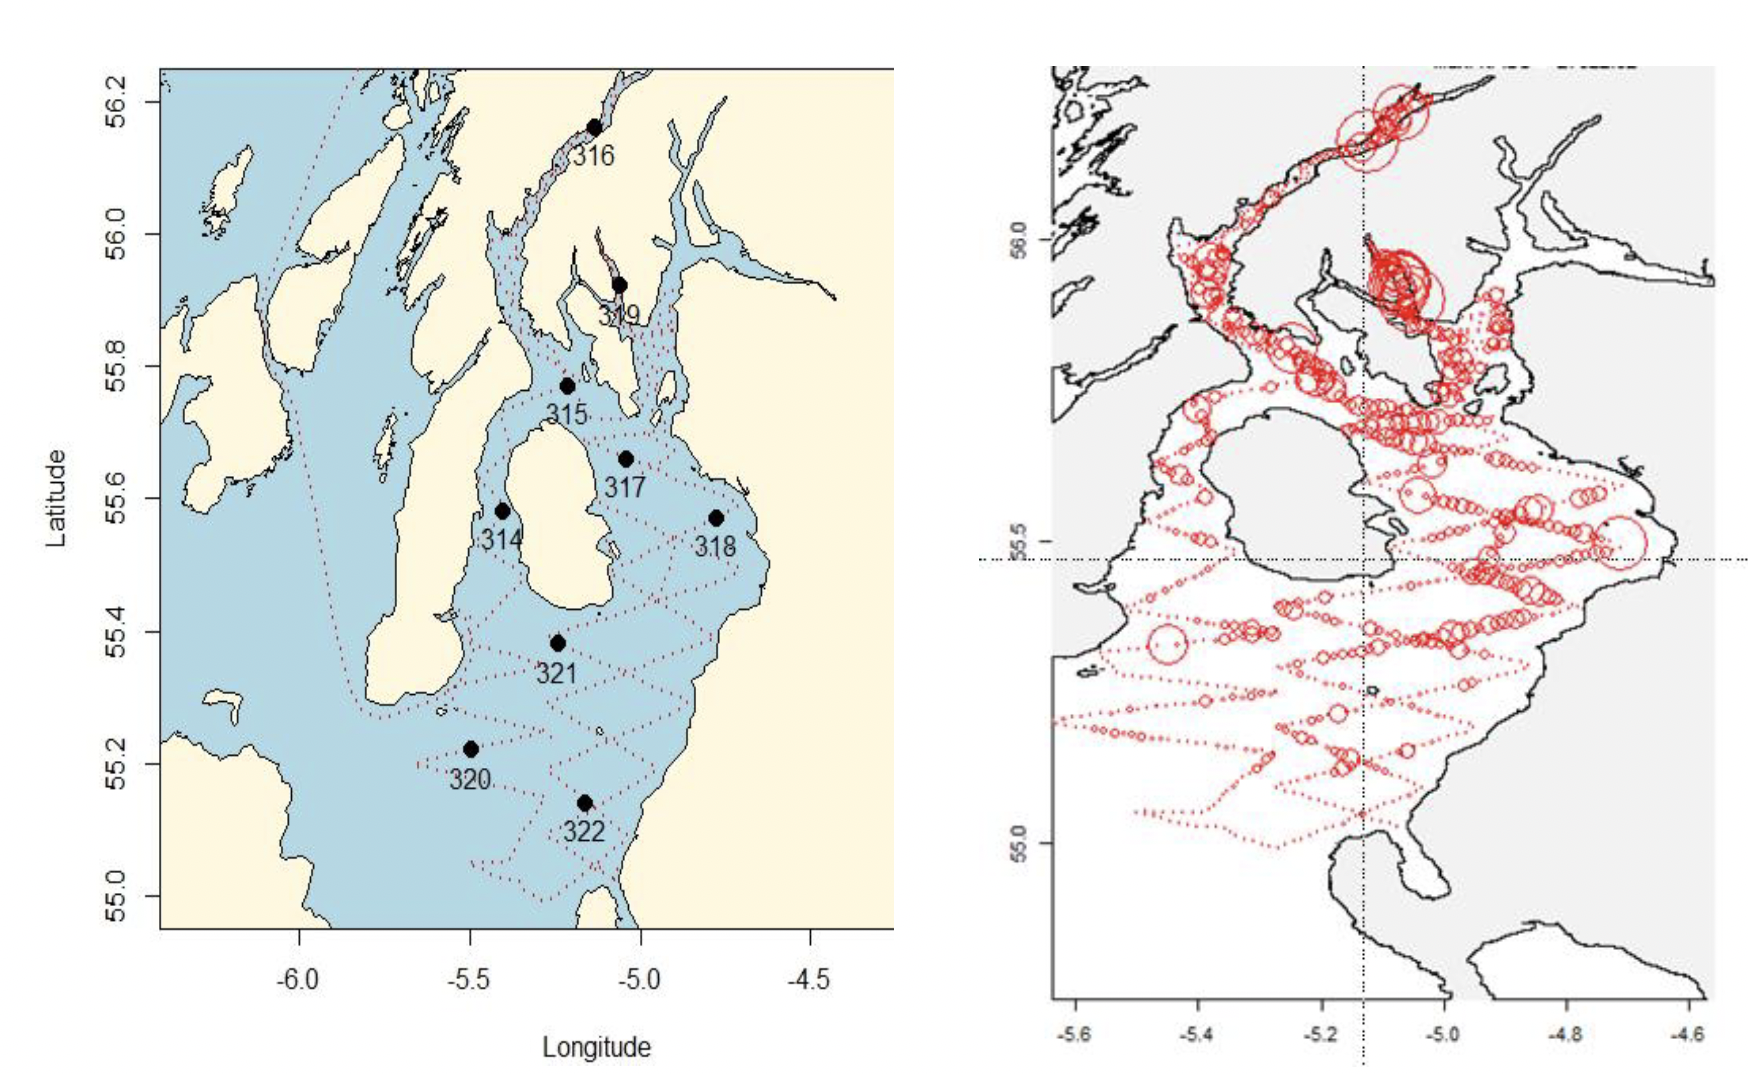
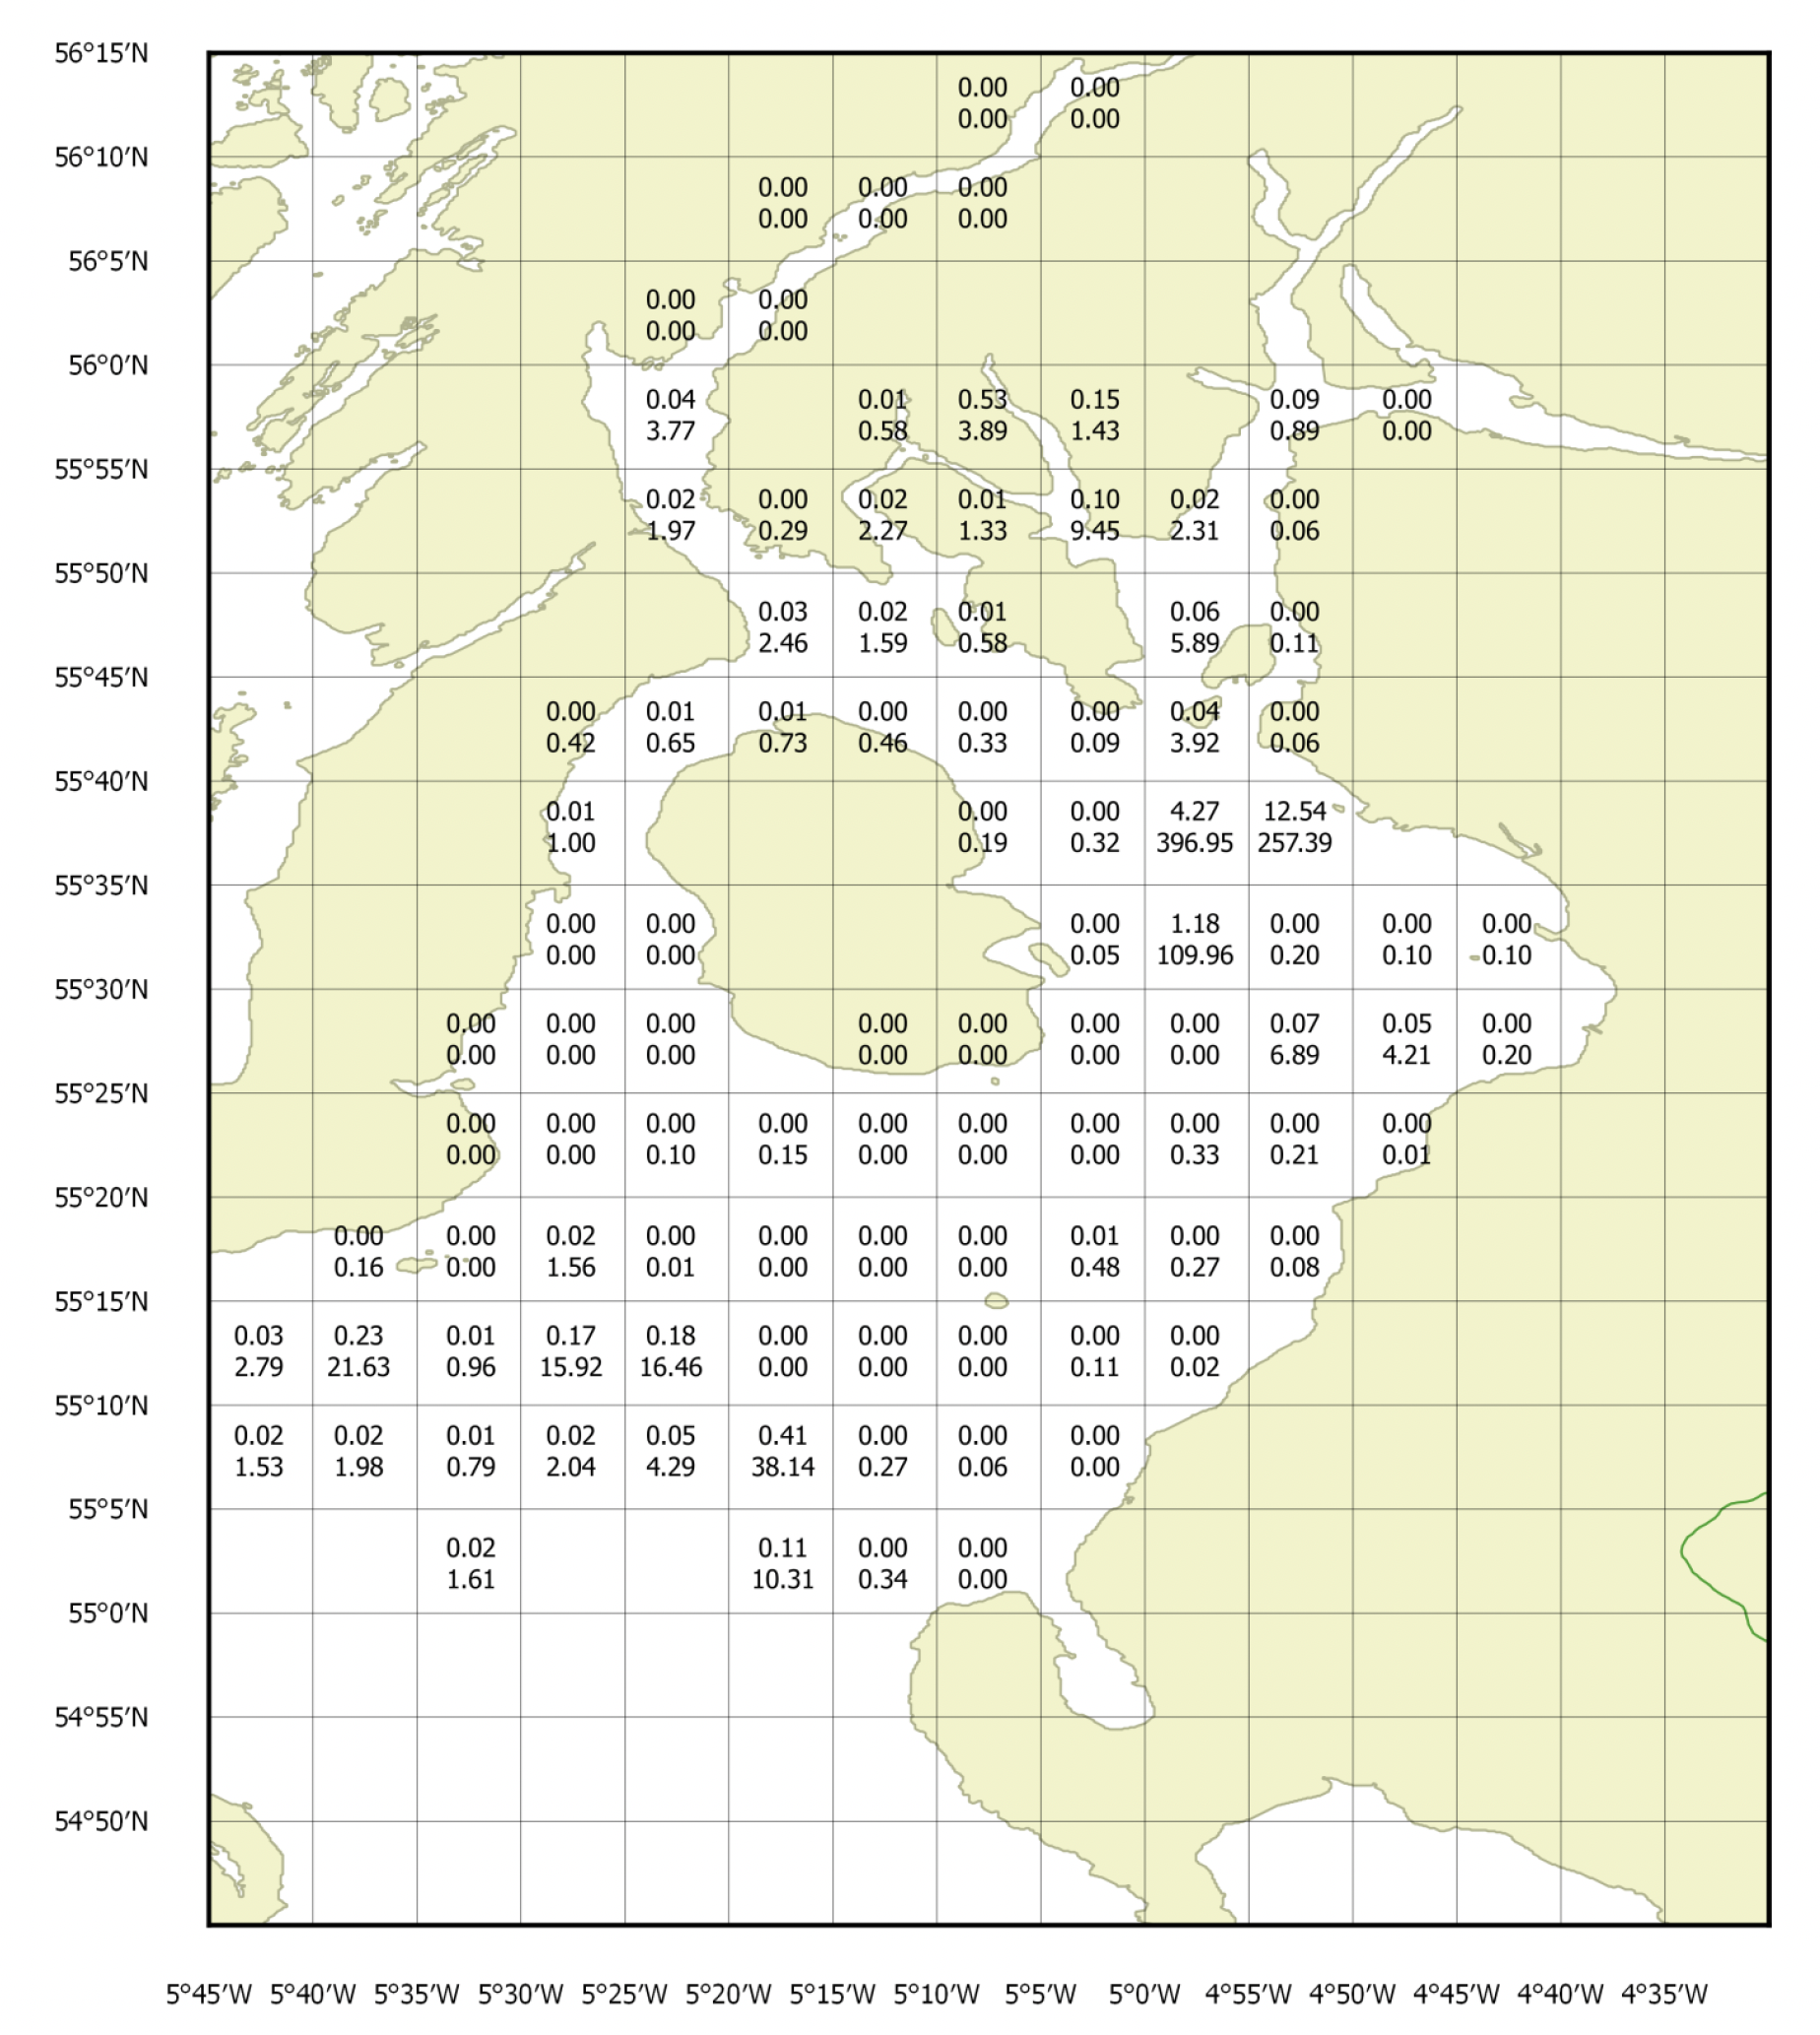
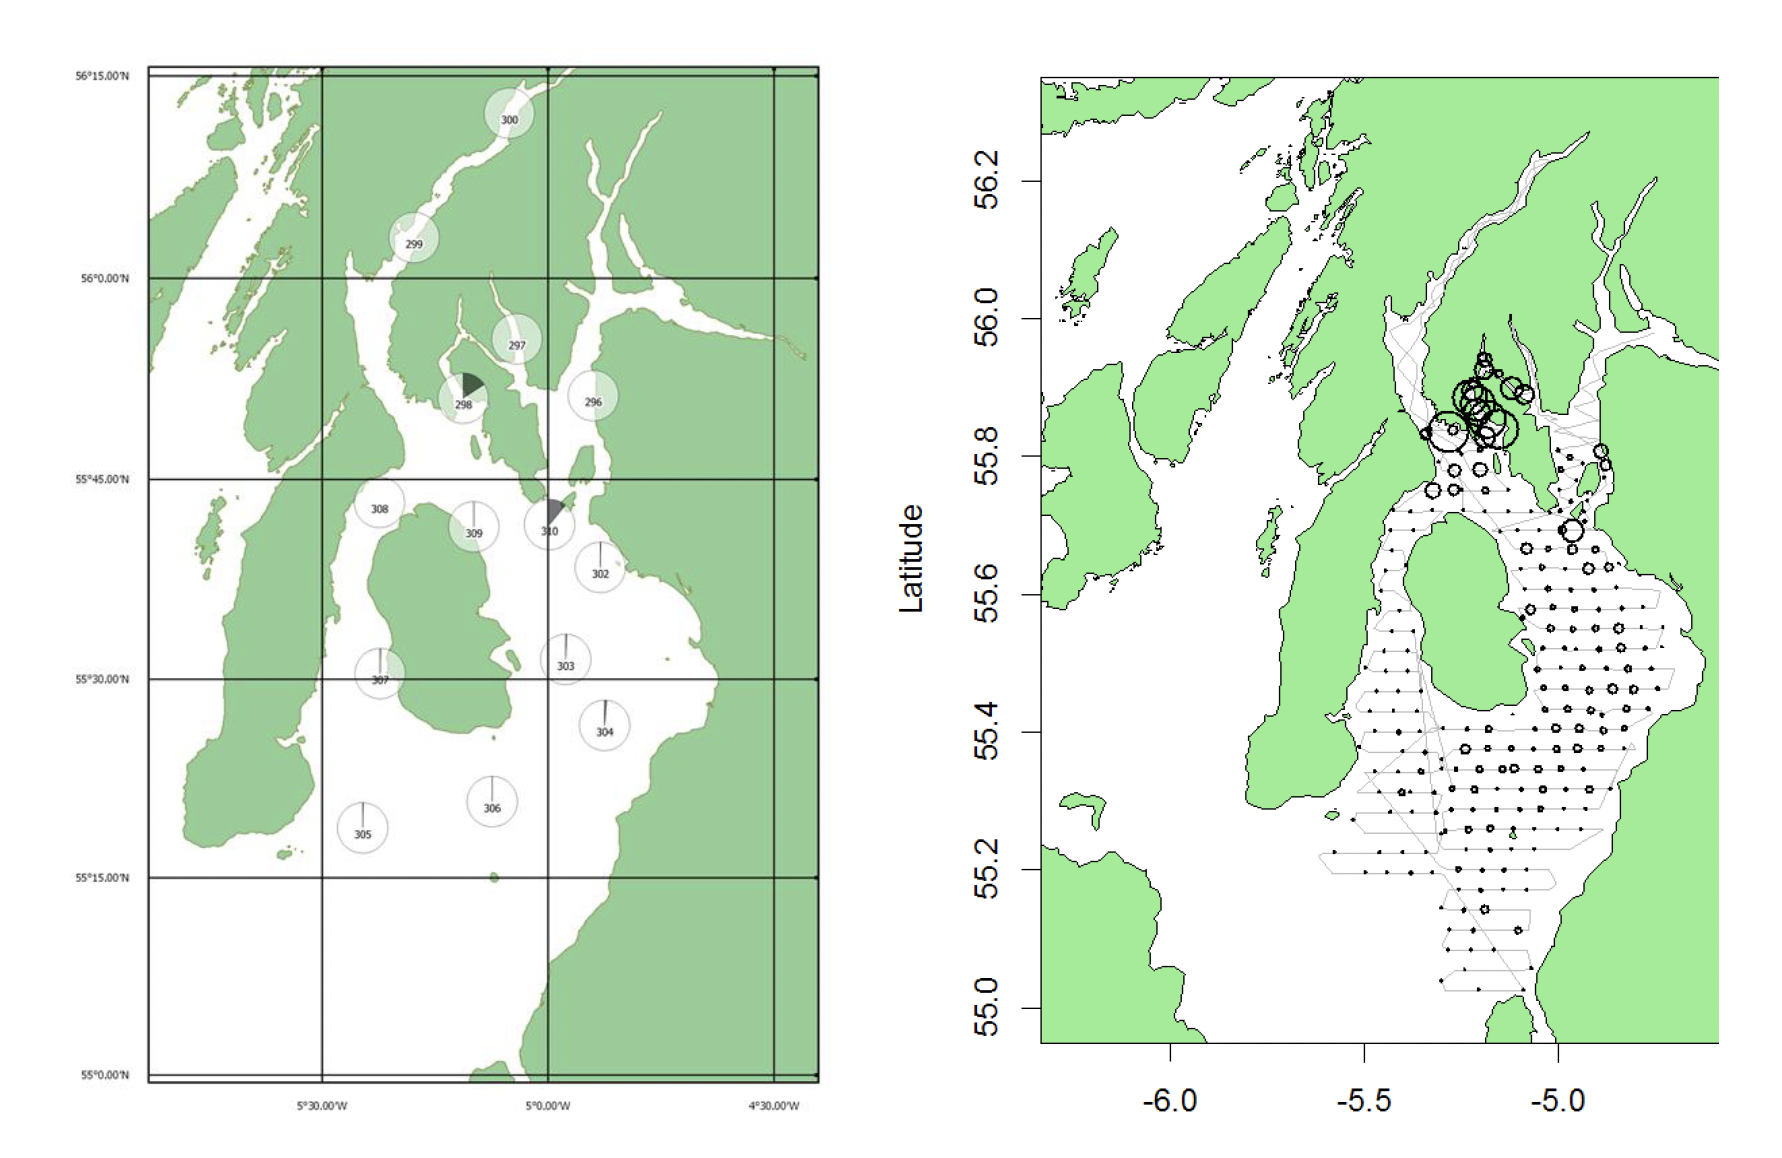
Distribution of herring in the surveys were similar amongst the years with the majority of herring encountered in the Inner Clyde to the west and south of Isle of Bute and in the deeper parts to the east and southeast of Arran (Figure 10 – 15). Biomass estimates from all surveys apart from 2016 were low compared to previous surveys series, in most cases less than half of the estimates from previous surveys in the late 1980s (Figure 8). In 2016 the biomass estimate was comparable to the estimates from the earlier survey series. In contrast to these earlier surveys the biomass has been almost exclusively composed of small immature herring in recent times, including 2016 (Figure 9).
Although the total biomass estimate for 2015 and 2018 surveys are not available this does not change the perception of the stock composition (i.e. one which is entirely composed of small juvenile herring) regardless of whether they show higher or lower abundance than previous or later surveys.
The methods used as well as size and capabilities of the survey vessel were similar between the surveys in the 1980's and the lack of larger adult herring in the recent surveys is not an effect of changes in the approach to the survey. However, there is a difference in season (summer vs. winter survey) and total area covered between the earlier surveys and the new series of surveys meaning the results are not directly comparable. Given the fishery was mainly been pursued in the early winter in recent years it was deemed more appropriate to carry out the survey to coincide with the fishery.
These surveys were not conducted during the years 2019 - 2021.
Bottom Trawl Survey Data
Marine Scotland Science (MSS) carries out two annual bottom trawl surveys in West of Scotland waters with stations in the Firth of Clyde. The time series extends from 1986 and 1997 to 2021 for Q1 and Q4 respectively – the Q1 2022 survey did not take place due to technical issues with the vessel. While a bottom trawl survey is not ideal for capturing the dynamics of a pelagic species such as herring, these surveys were recently both included in the assessment of the neighbouring West of Scotland herring stocks.
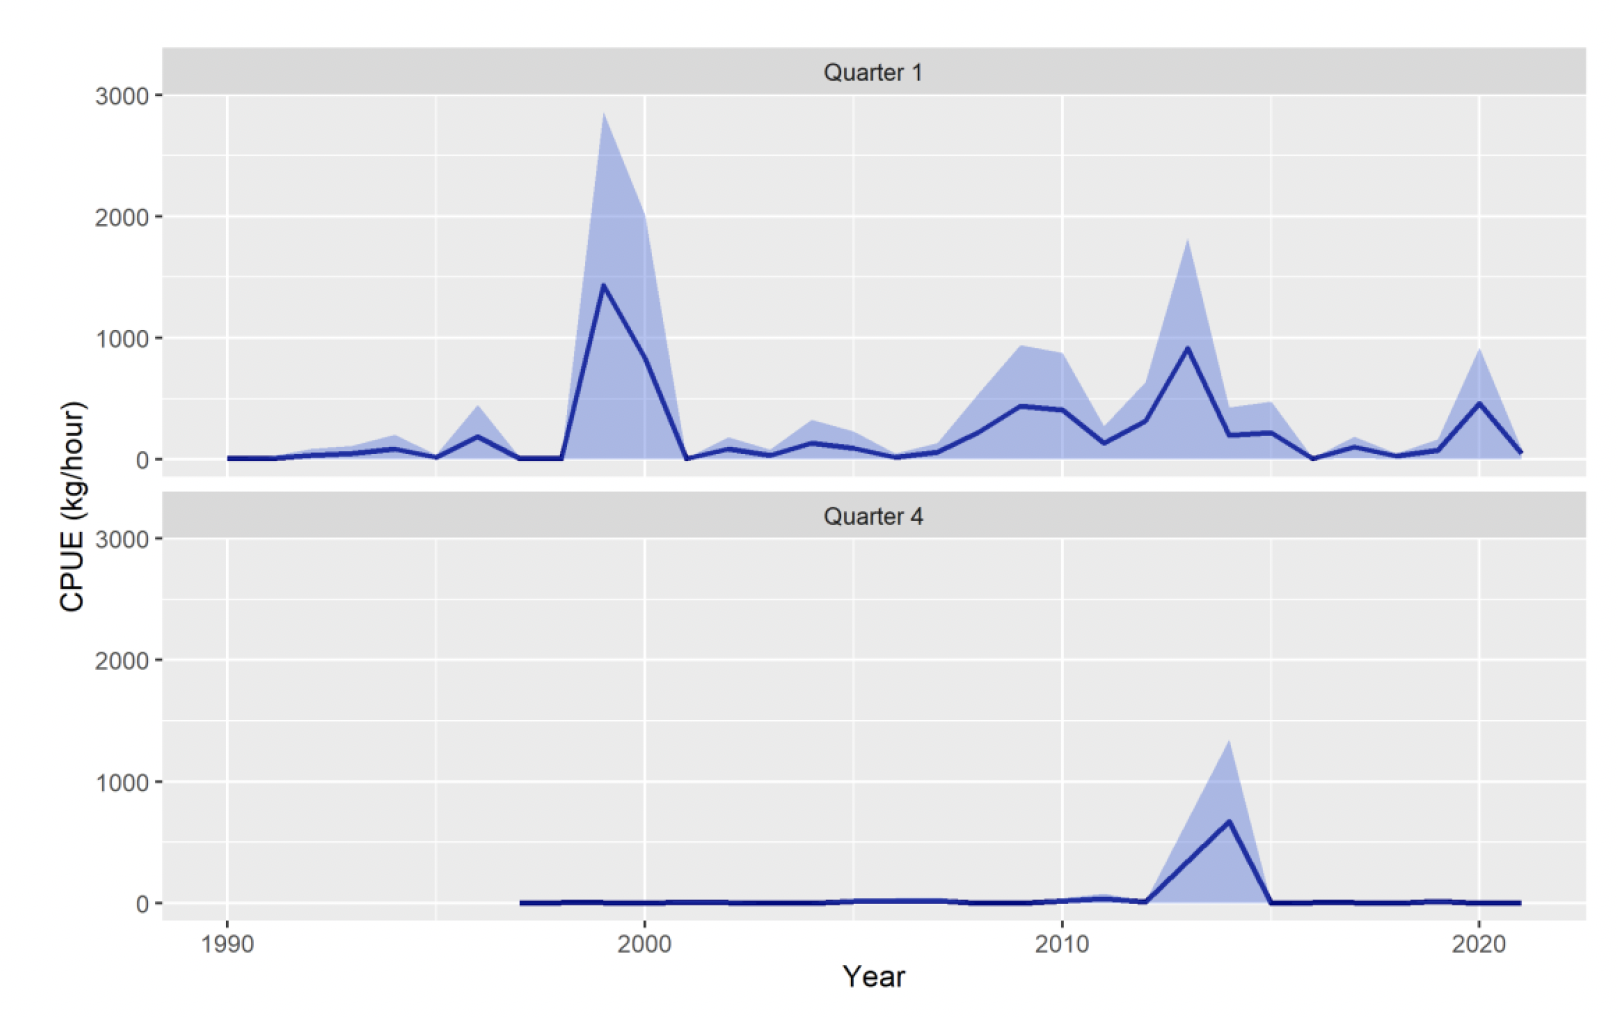
An analysis of trends in catch per unit effort (CPUE) reveals that the mean catch rate of herring in tows within the Clyde remains low, and uncertainty around these figures remains high, due to the small number of tows carried out each year (Figure 16). Catches are consistently higher in quarter 1, compared to quarter 4, which may be explained by the herring overwintering in areas further up the Clyde sea lochs where the survey does not operate.
Figure 16. IBTS Survey time series of herring catch per unit effort, standardised to 1 hour tows. Confidence intervals are ± two standard errors.
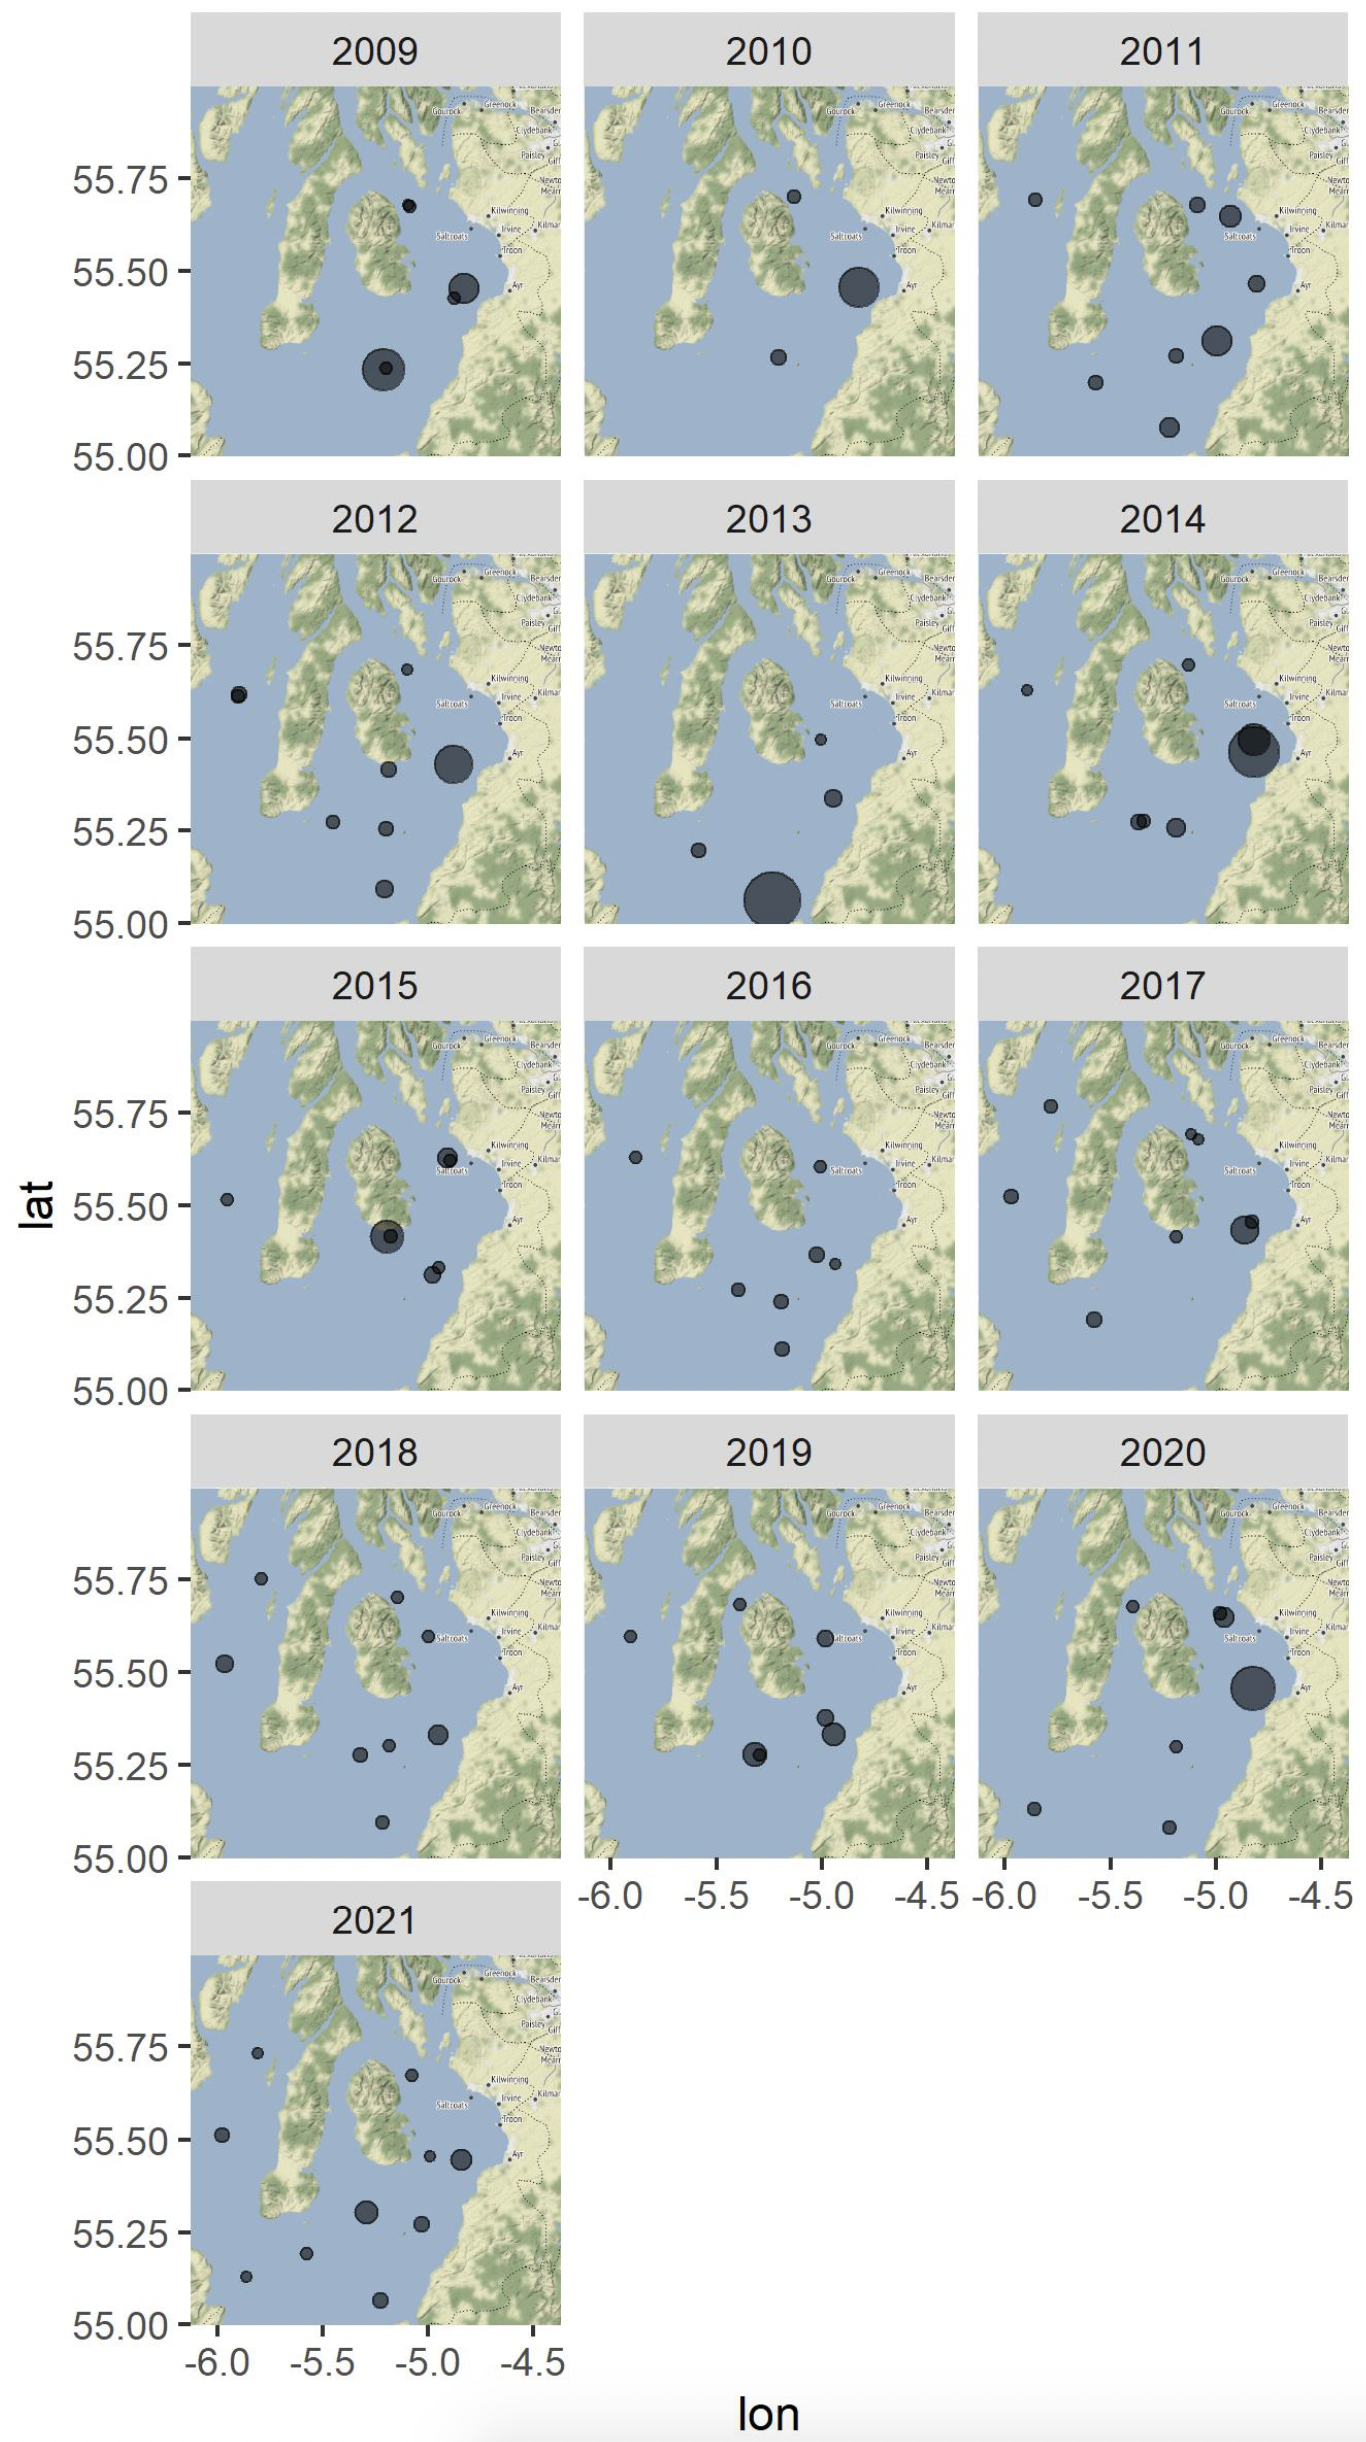
An examination of the spatial distribution of catches in the IBTS surveys suggests that herring are not evenly distributed throughout the Clyde, but rather have a patchy distribution, leading to a perception of the stock which can be strongly influenced from year to year depending on whether a large haul, such as those seen in some years in Ayr Bay, is taken (Figure 17, Figure18).
Figure 17. Herring abundances on IBTS tows, 1997 - 2008, in the Clyde area (ICES Rectangles 39-40 E4 & E5).
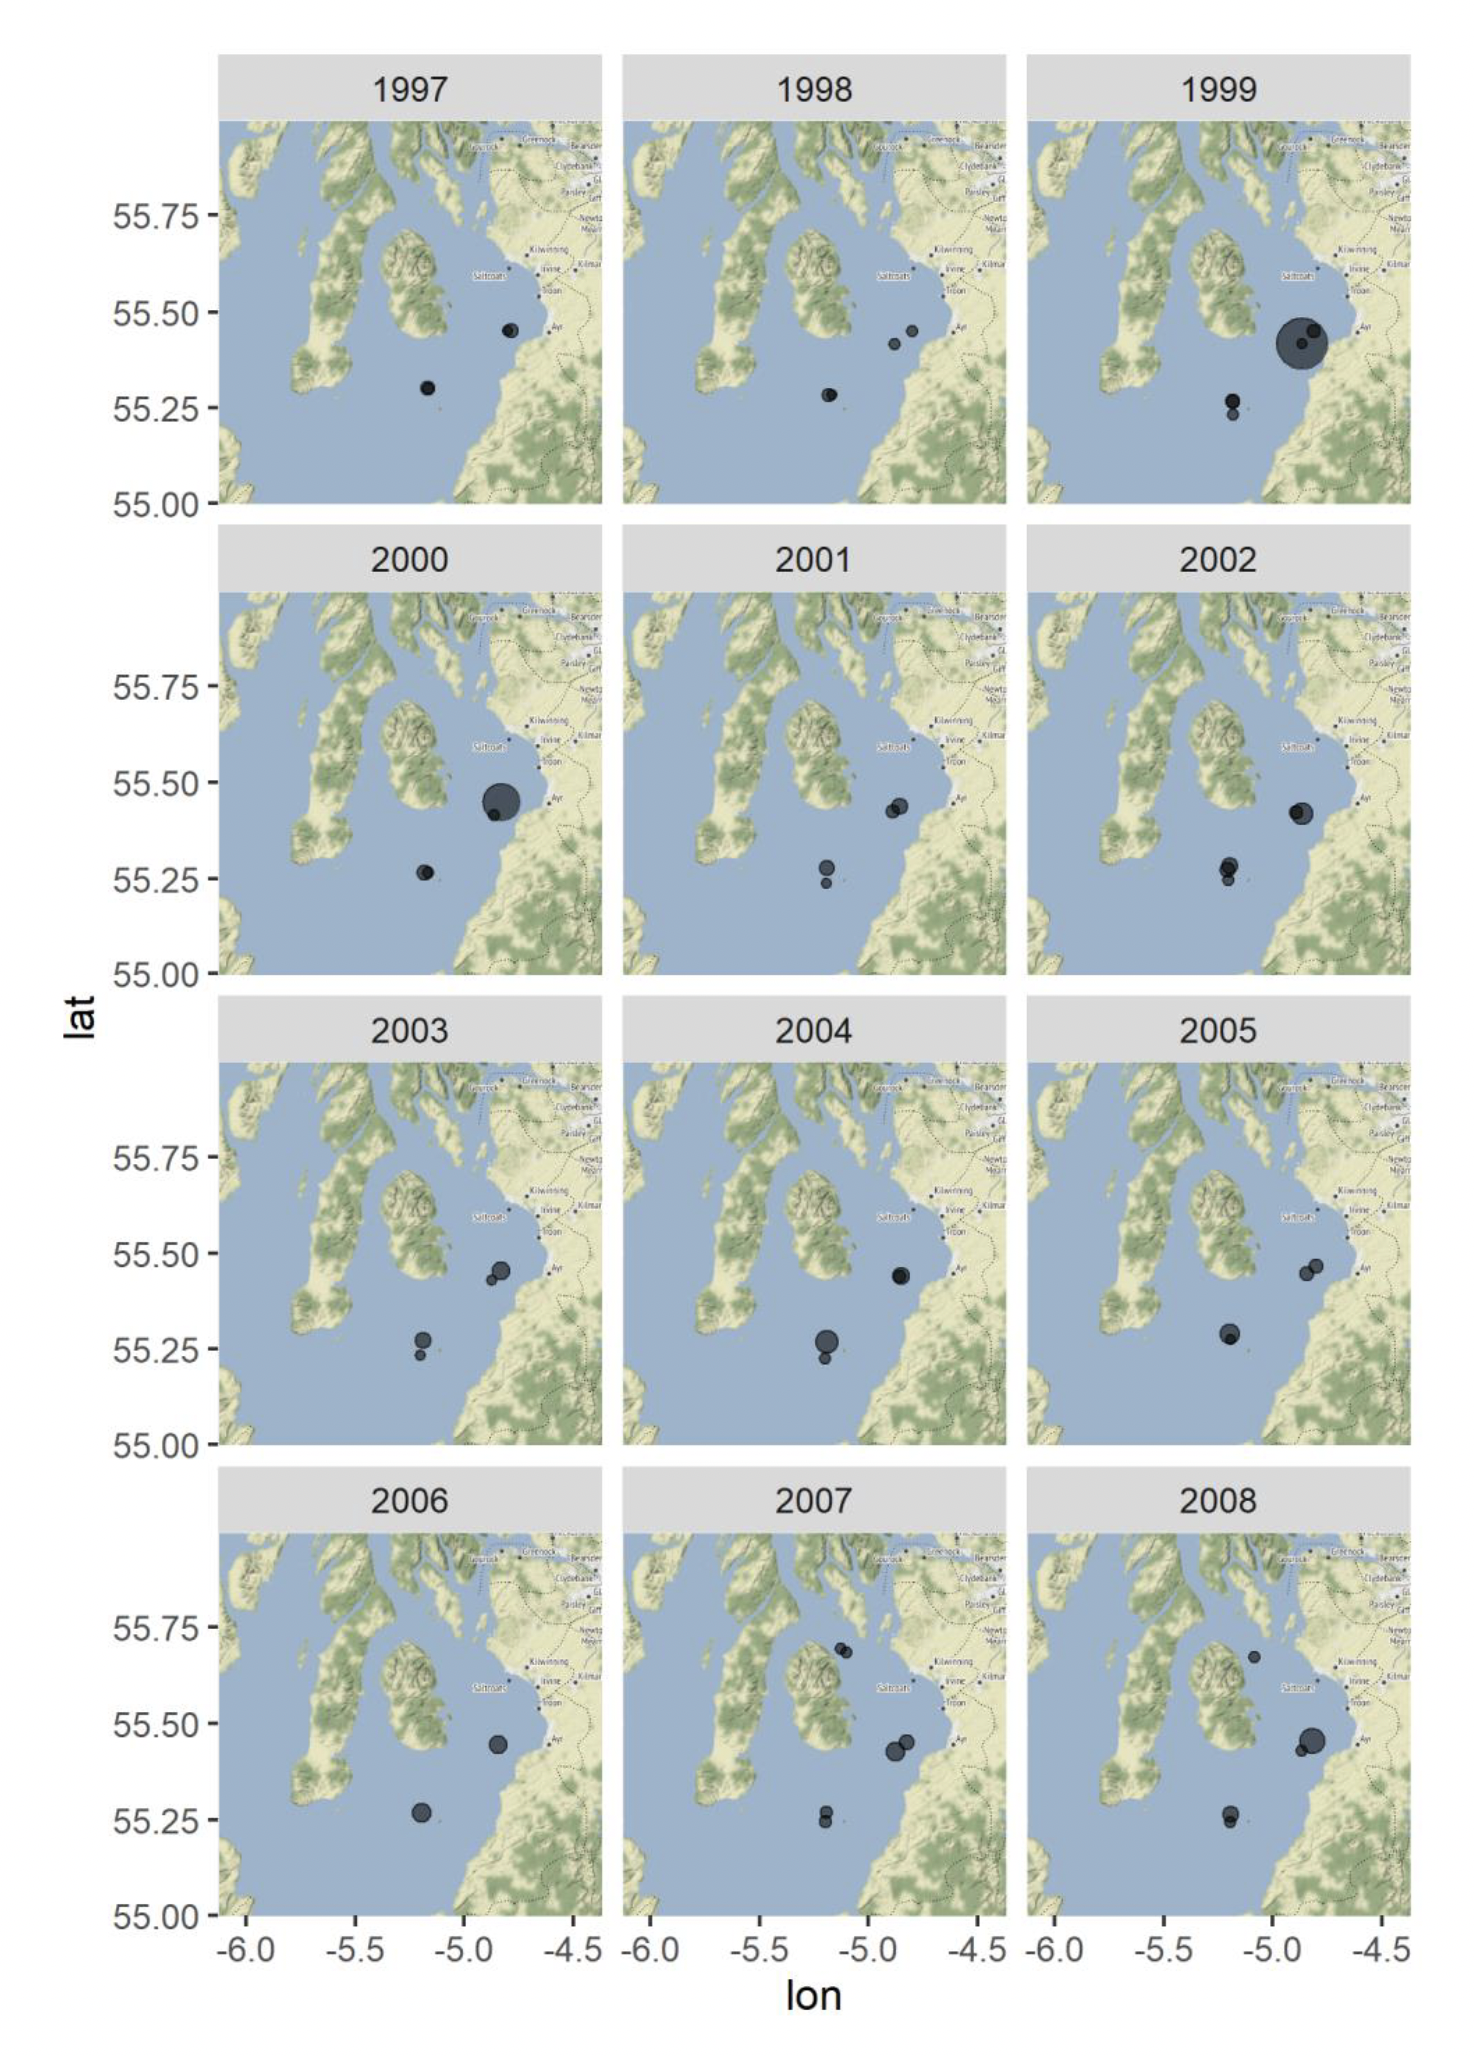
Figure 18. Herring abundances on IBTS tows, 2009 - 2021, in the Clyde area (ICES Rectangles 39-40 E4 & E5).
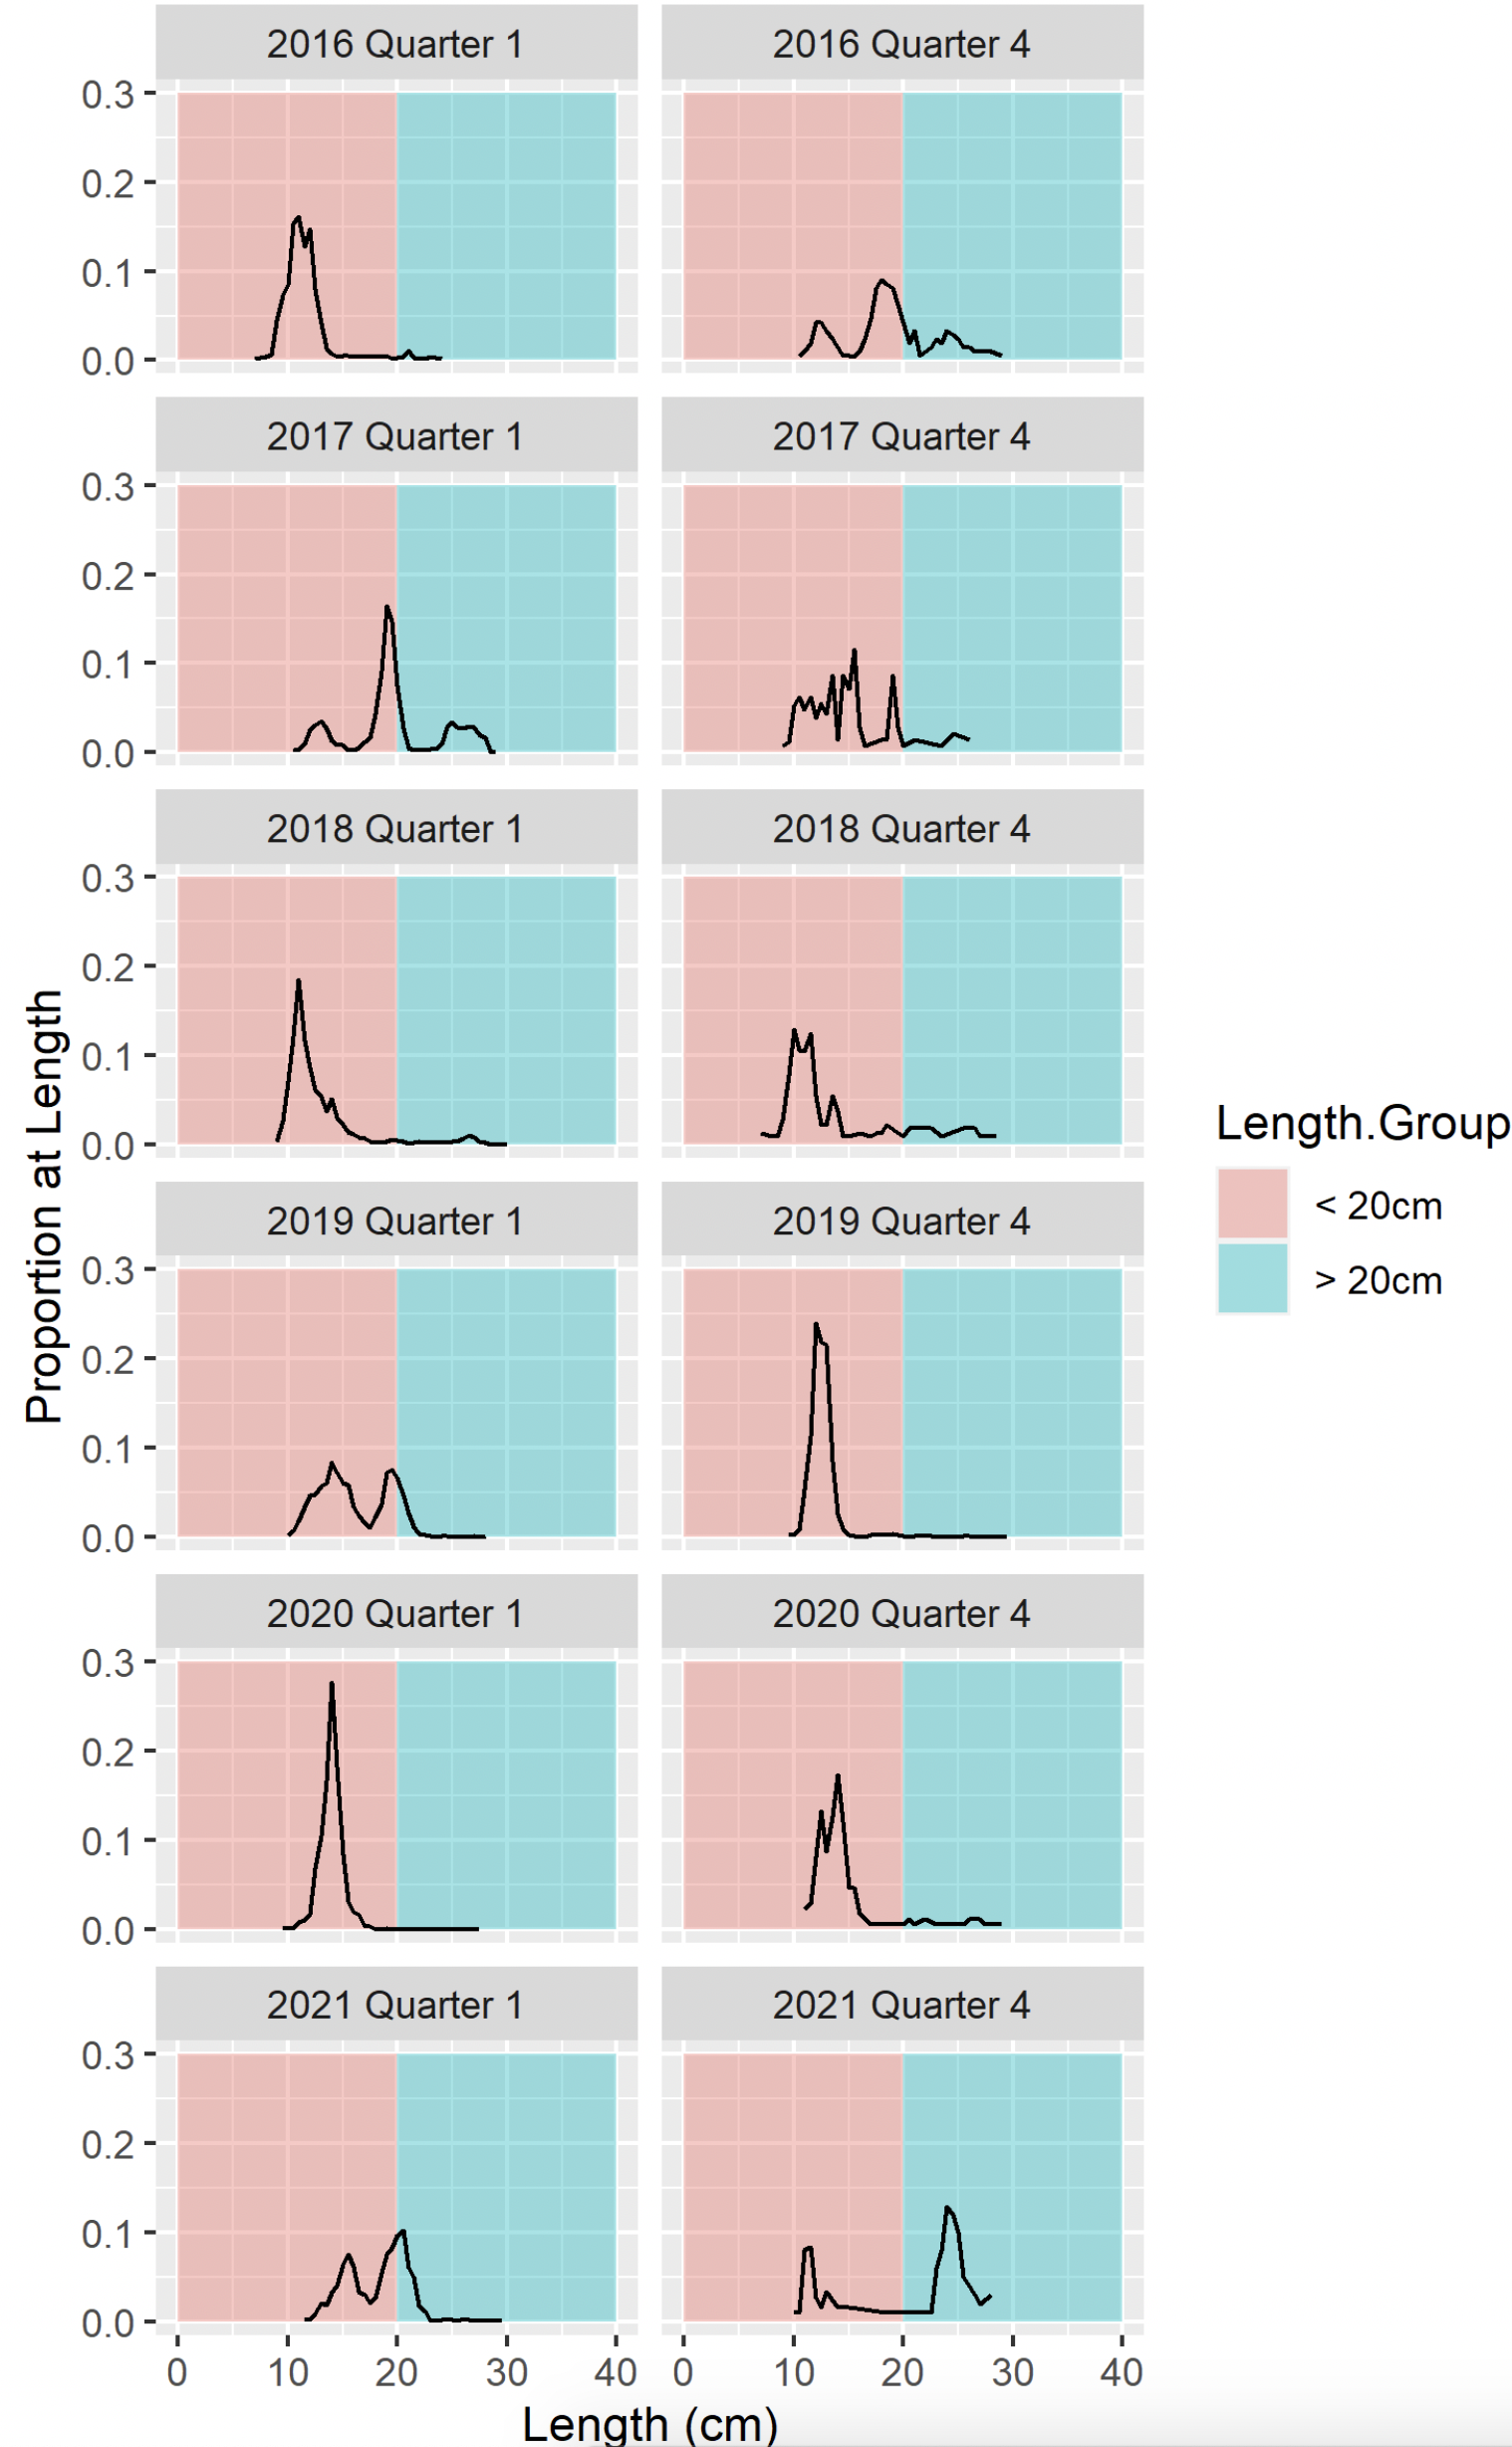
An analysis of the length-frequencies of herring in IBTS catches shows the Clyde herring stock to have been dominated by small fish in the 0-2 size range, with very few older larger fish seen, particularly in recent years (Figure 19 - Figure22). With a minimum landing size of 20cm in place for this area, it is likely that a fishery targeting herring in the Clyde would encounter significant quantities of undersized fish.
Figure 19. Proportion of herring at length from IBTS Catches in Q1 and Q4, 2000 - 2004.
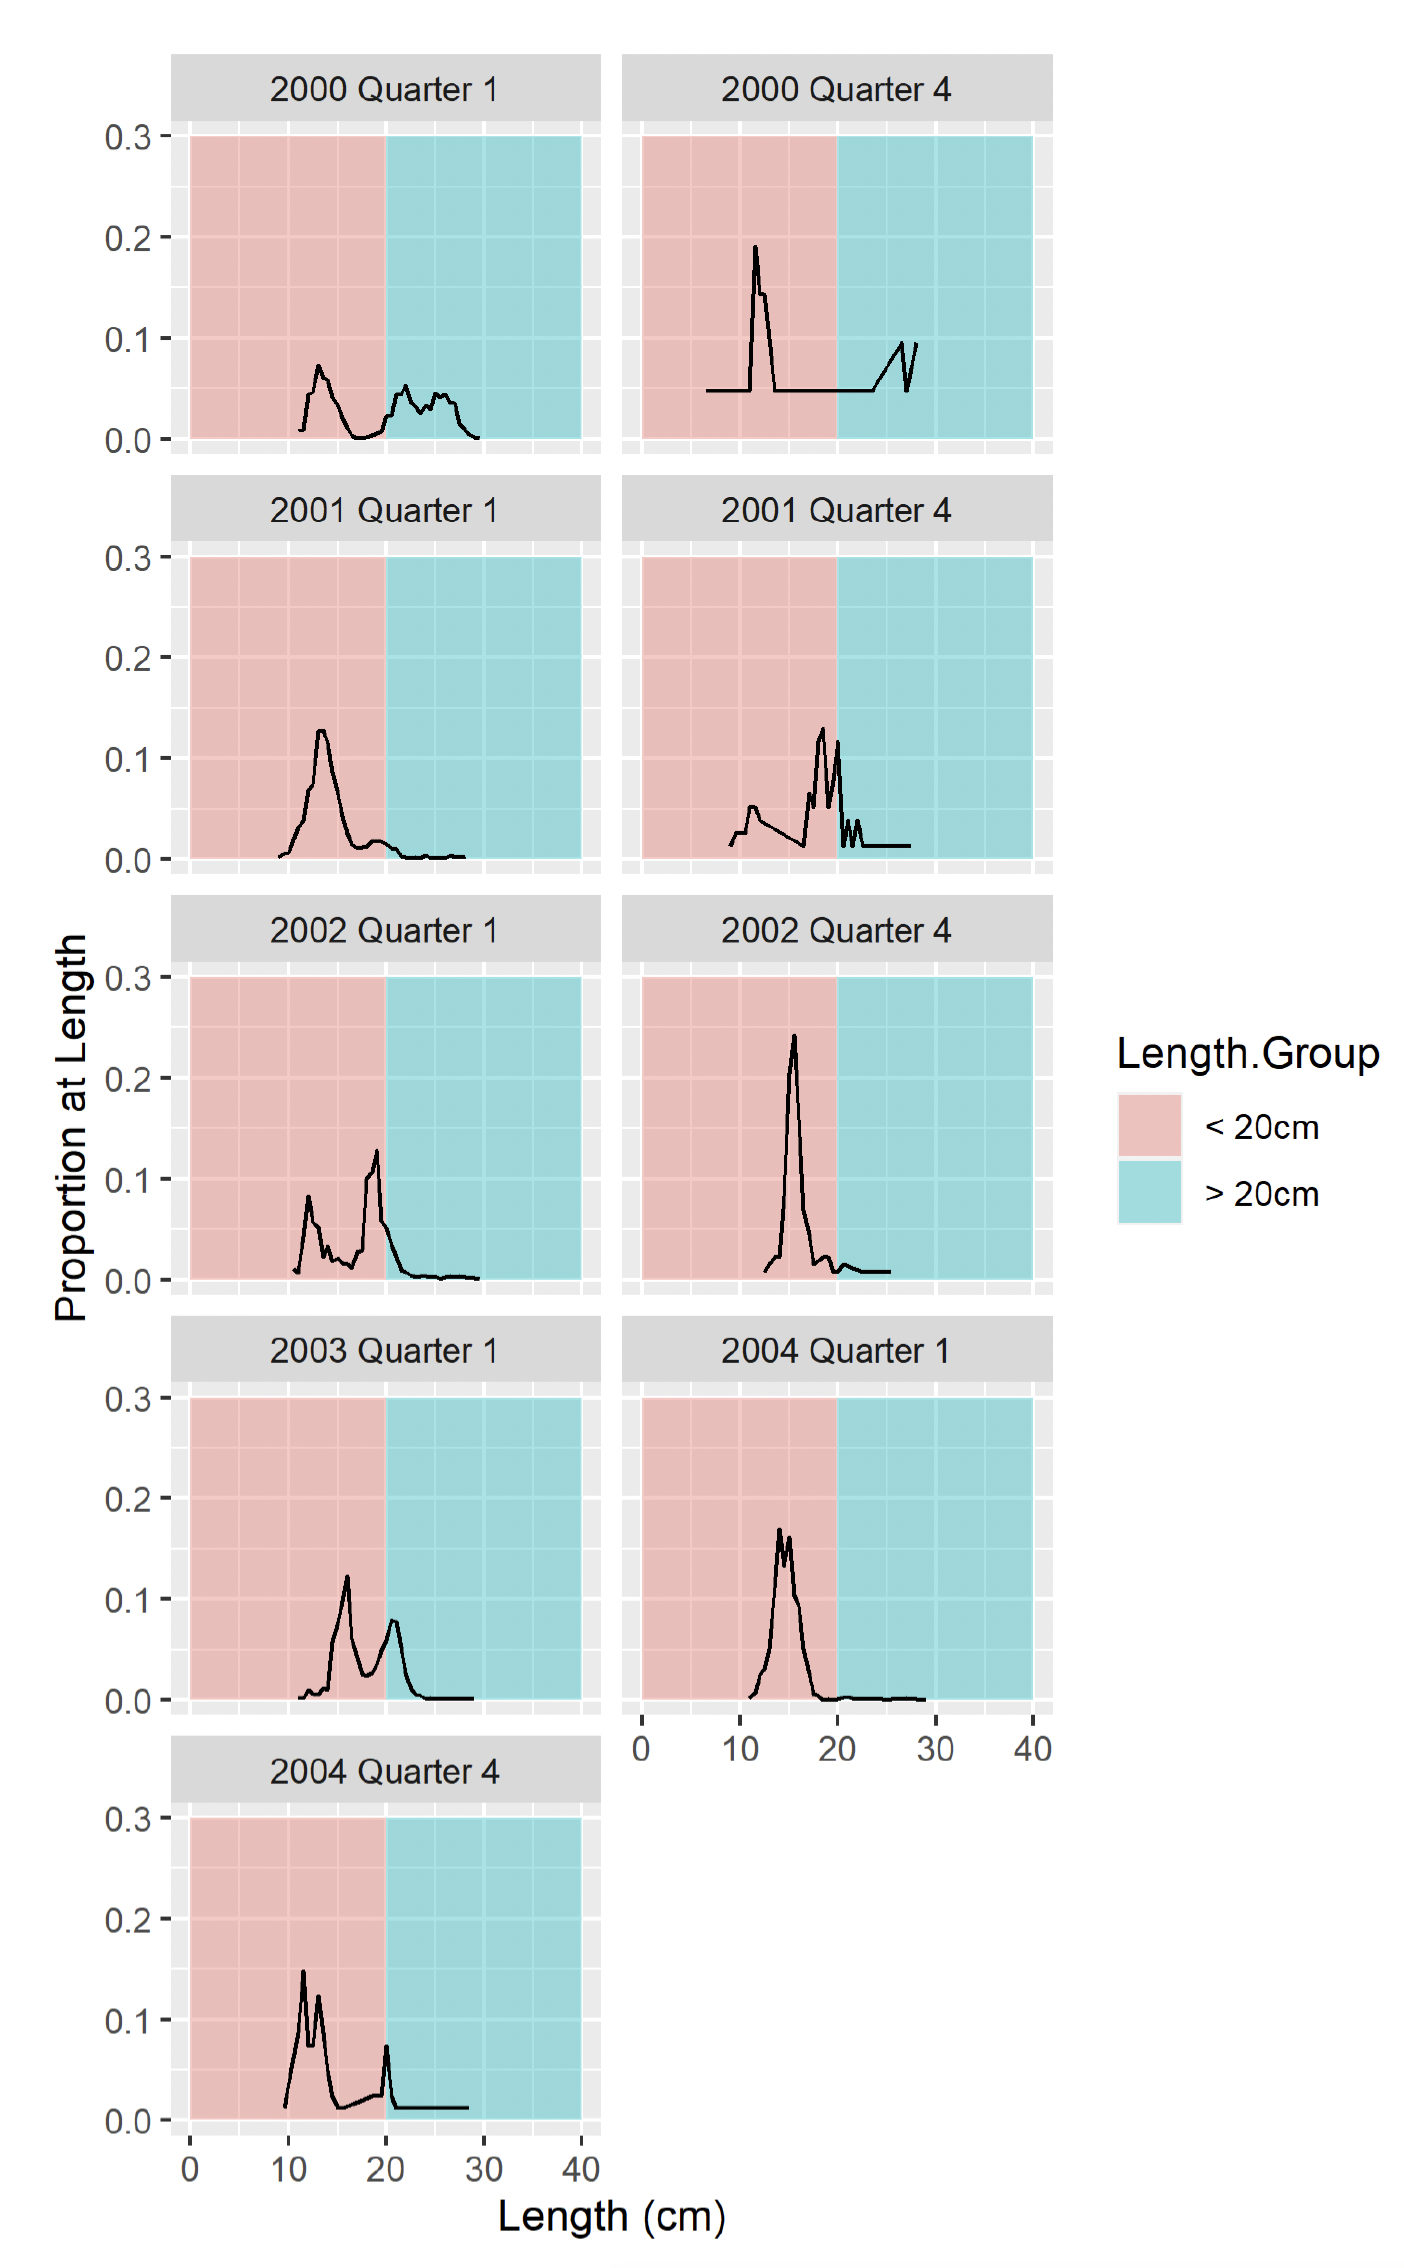
Figure 20. Proportion of herring at length from IBTS Catches in Q1 and Q4, 2005 - 2009.
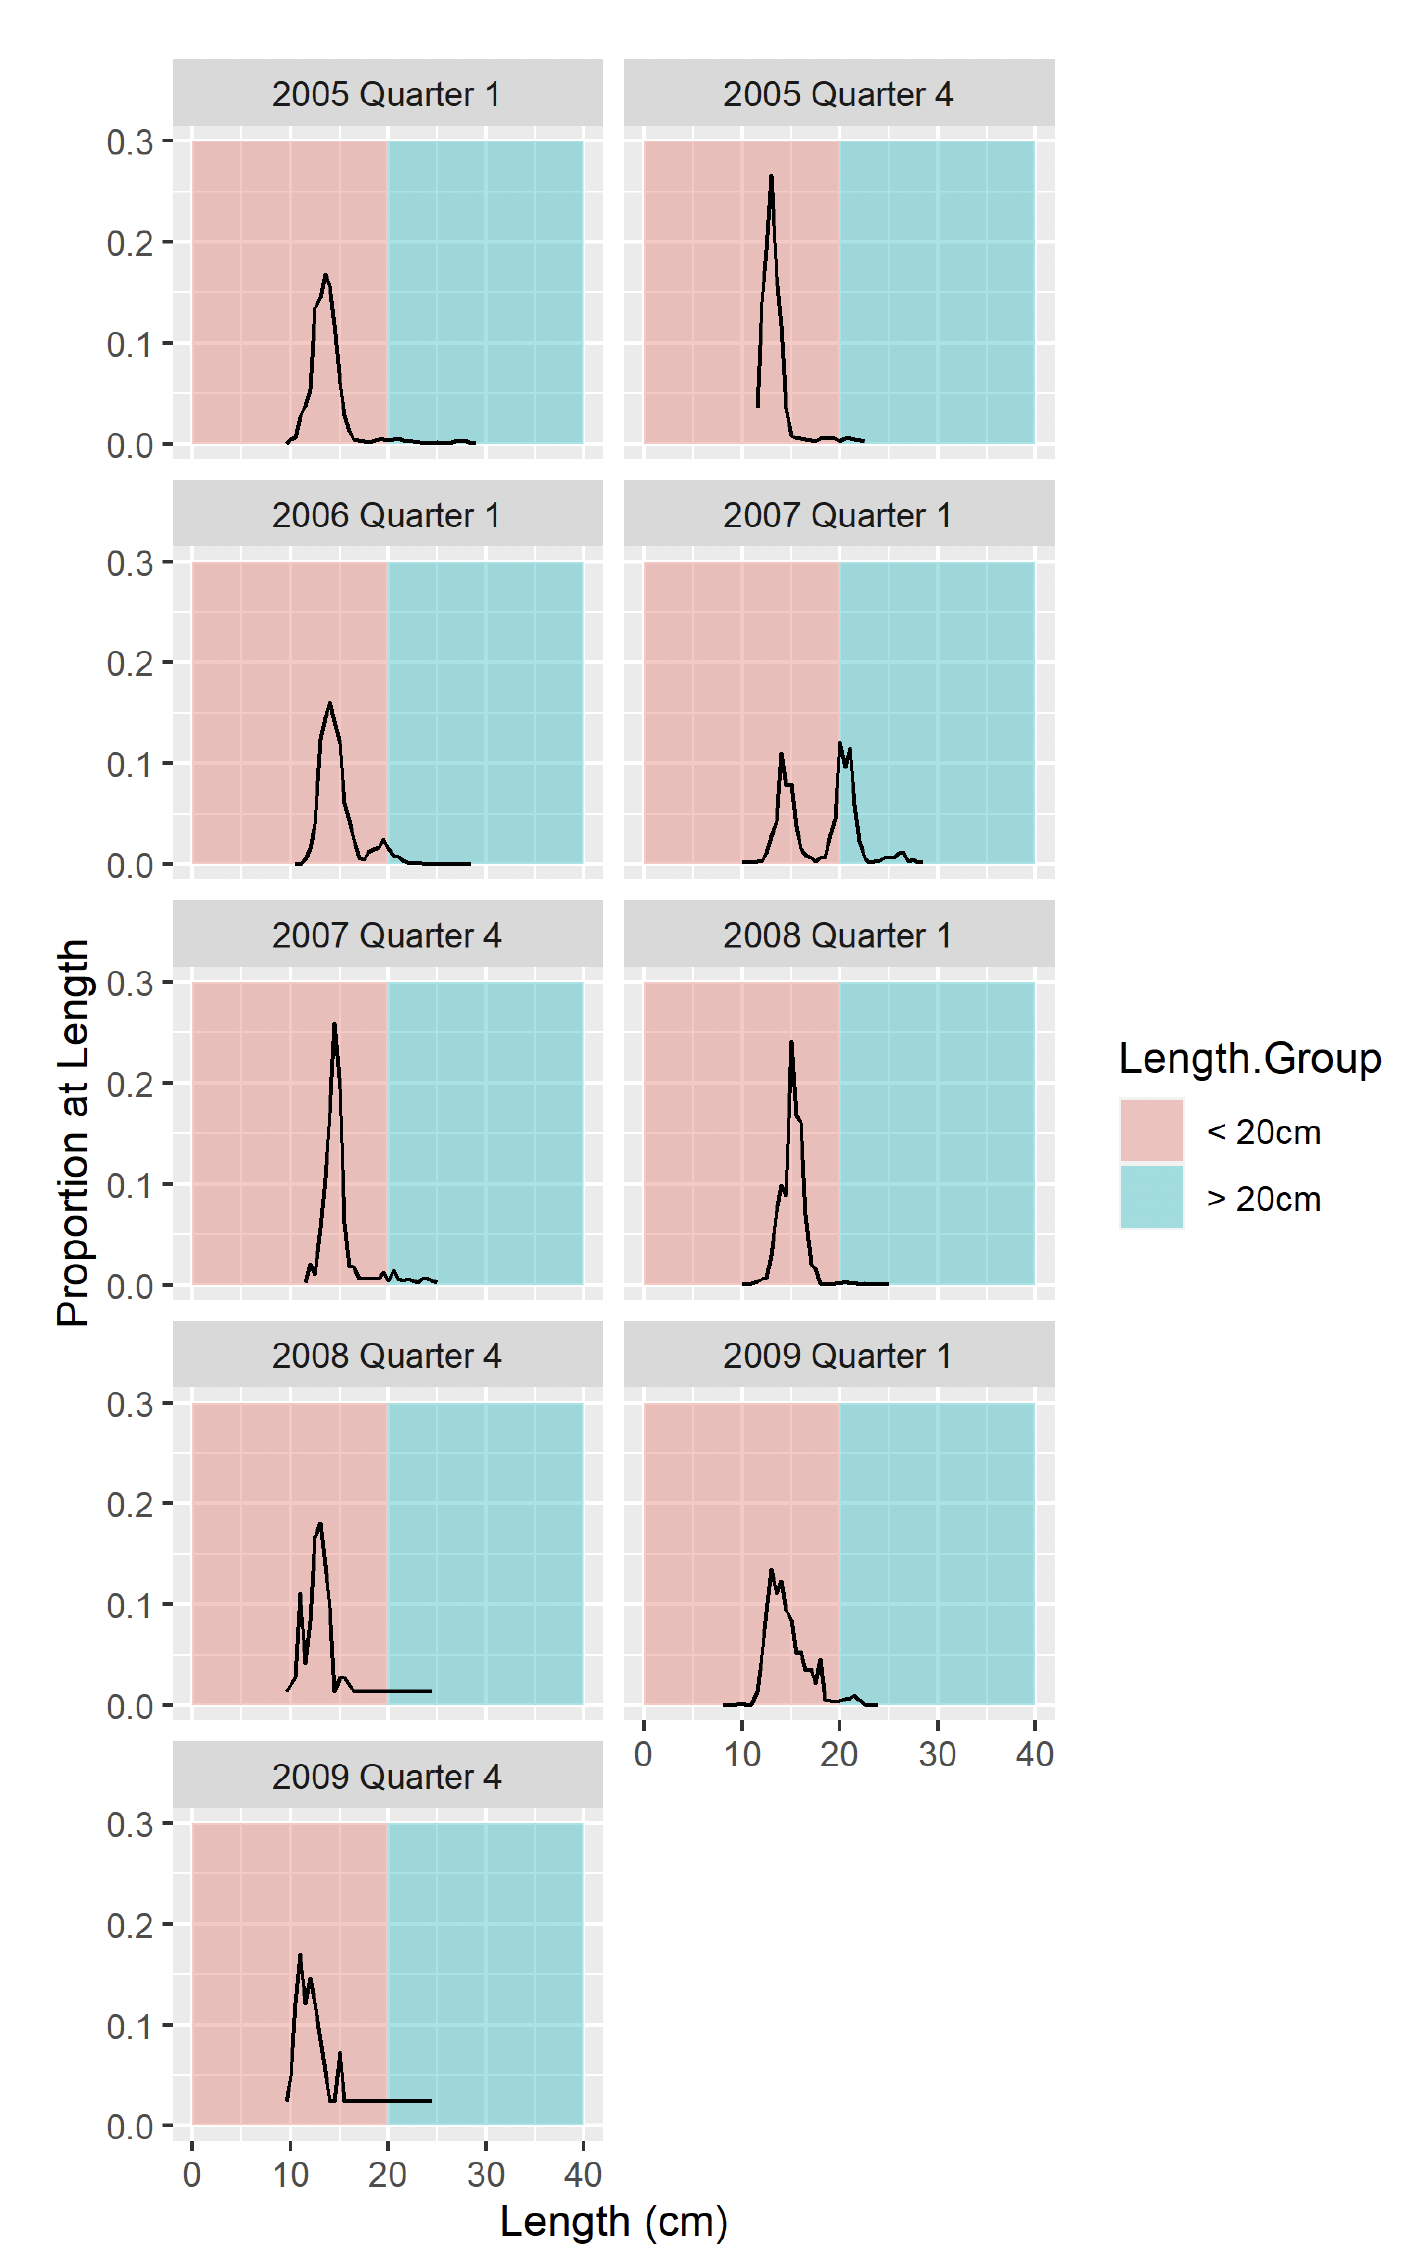
Figure 21. Proportion of herring at length from IBTS Catches in Q1 and Q4, 2010 - 2015.
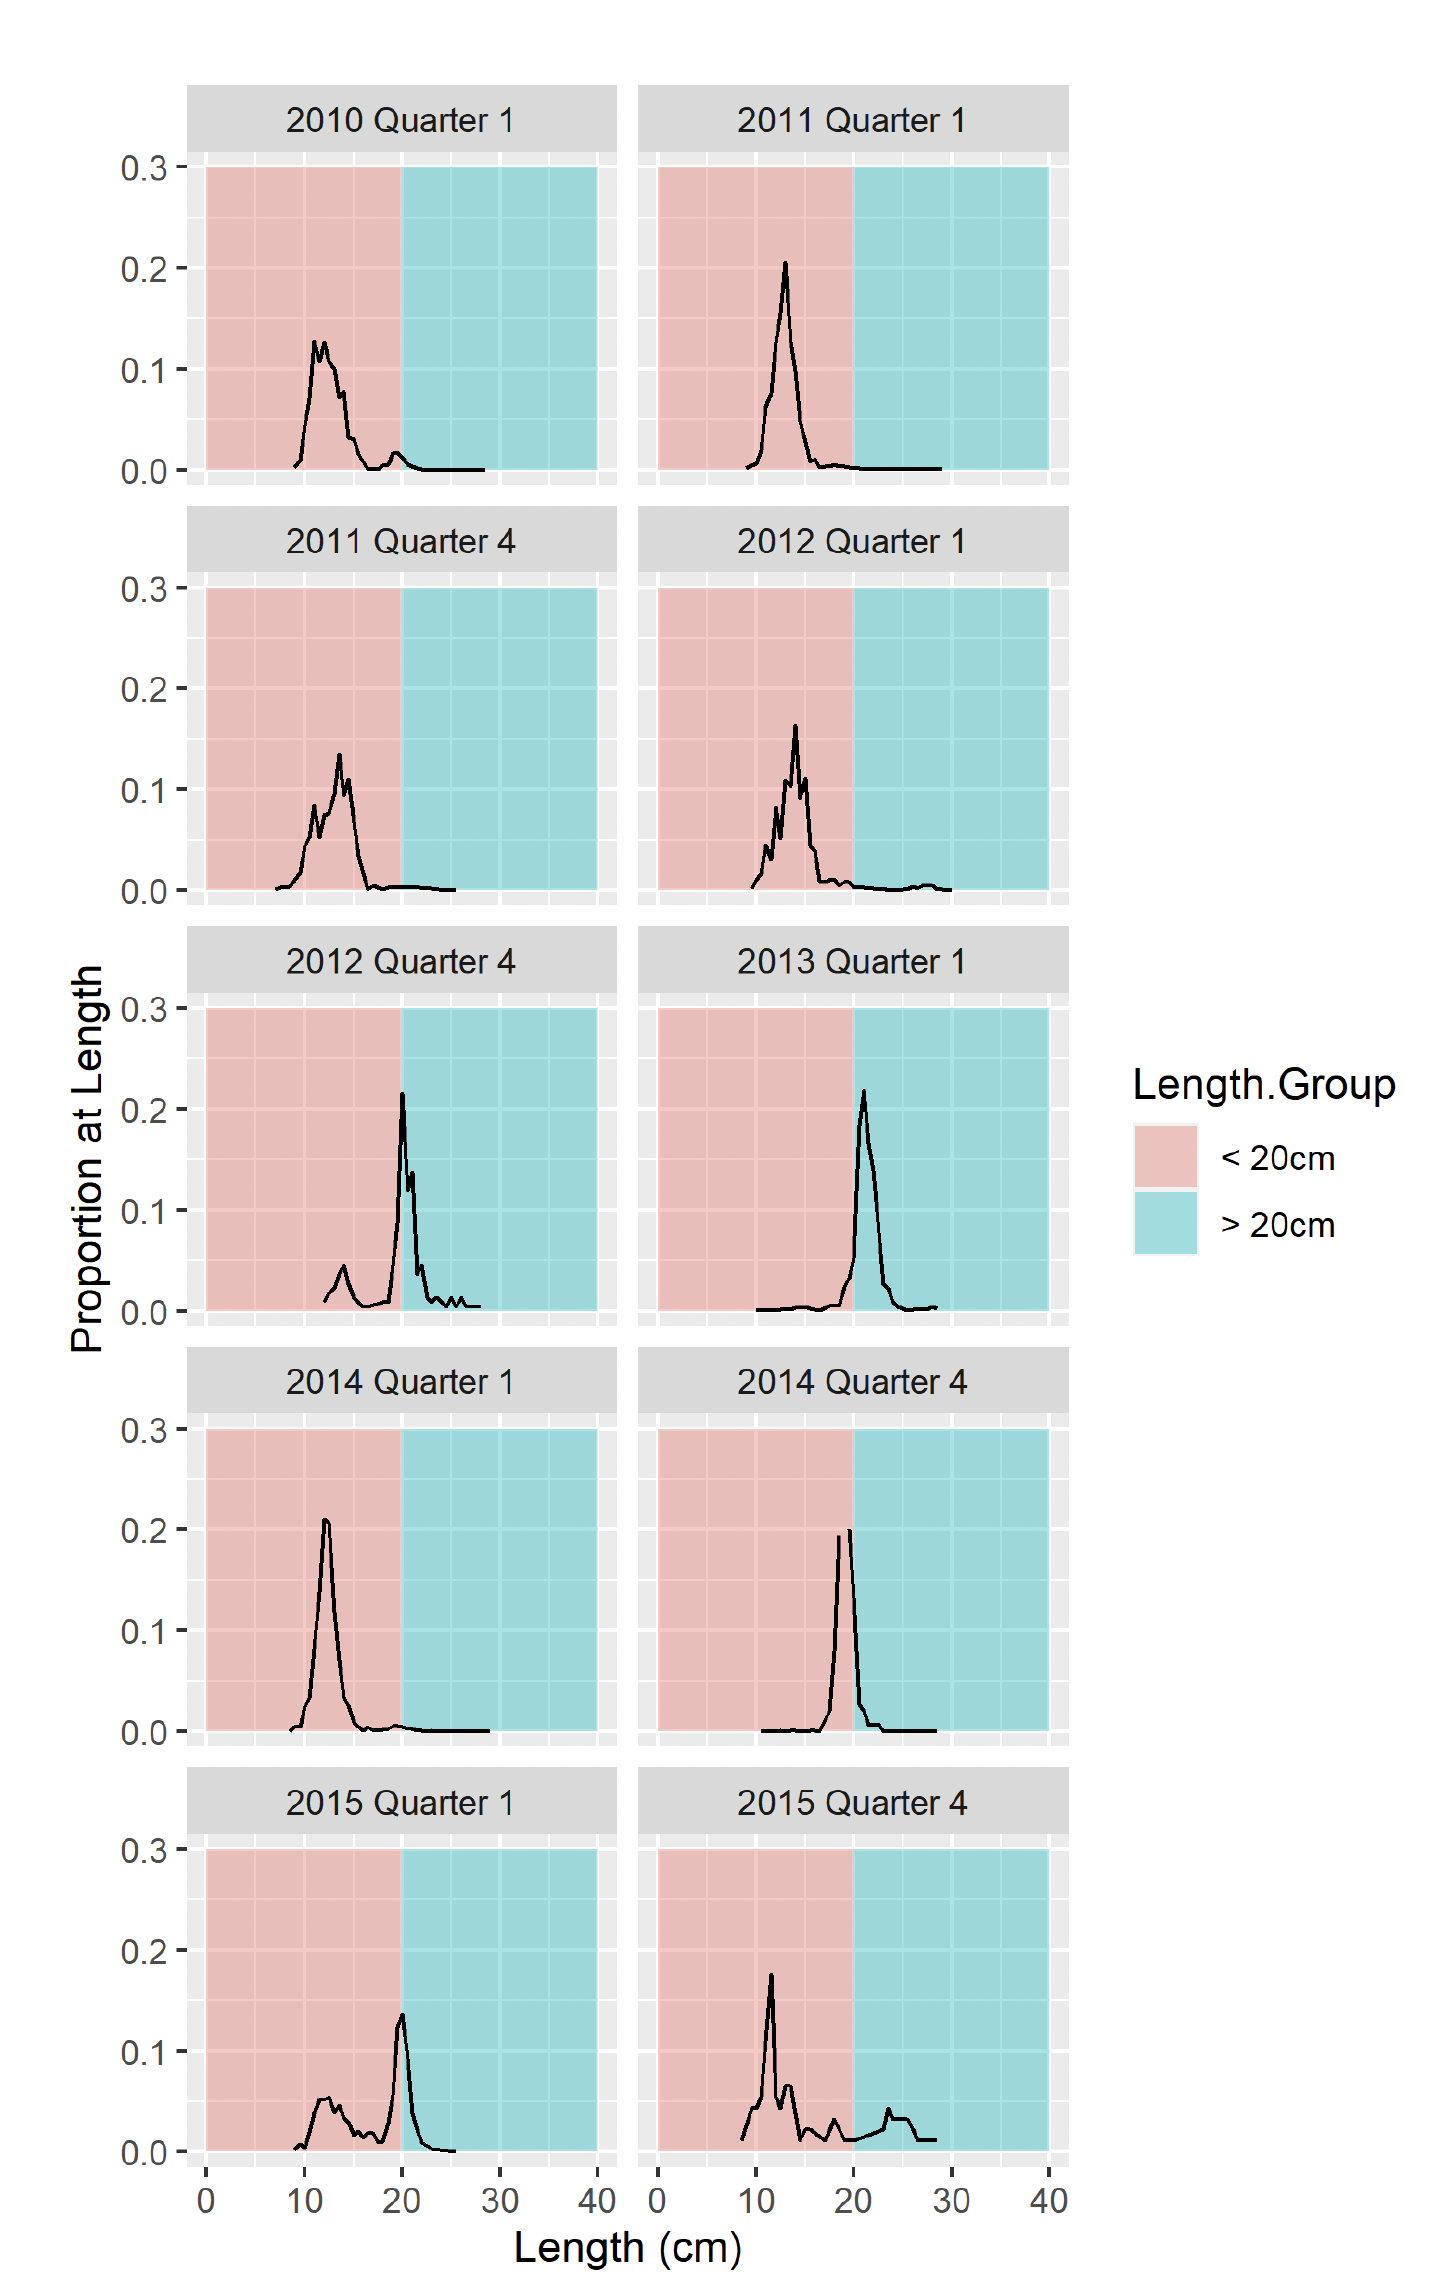
Figure 22. Proportion of herring at length from IBTS Catches in Q1 and Q4, 2016 - 2021.
Industry perception
The commercial samples taken in 2011 to 2013 indicate a significant portion of the landed fish were age 4 or older herring. The failure of the 2012 to 2018 surveys to capture these adult fish that form the basis for the fishery was seen as problematic. The issue was discussed with industry members pursuing the herring fishery in meetings in 2014, 2015 and 2019.
Many of the commercial landings sampled were caught close inshore in areas that are too shallow for the MSS survey vessel to practically survey or deploy fishing gear in due to its size. There were concerns also that the survey is carried out during the day and that adult herring in the Clyde are perceived by the fishermen to rise off the bottom in the night time and become more readily detected acoustically and easier to catch. Finally the difference in the timing of the fishery and survey was discussed as a potential cause of differences in perception due to possible migration of adult herring into the Clyde after survey completion (particularly the summer surveys in 2008 and 2009). However, the timing of the fishery does not appear to be guided by availability of large herring, but rather availability of time to pursue the fishery (which is quite opportunistic). It was mentioned that locating commercially viable sized herring is time consuming and requires detailed local knowledge.
3. Discussion and conclusion
The lack of adult herring in the acoustic surveys conducted in the Clyde in recent times (2008, 2009, 2012 - 2018) and the discrepancy with the information collected from the fishery in 2011 - 2013 has been a cause for concern. Historical acoustic surveys (1987 to 1990; Table 3) in the Firth of Clyde were carried out in similar fashion to the present day surveys but did not have problems locating and sampling schools of larger adult herring.
The acoustic survey in 2016 and the trawl surveys since Q4 of 2015 have encountered some larger mature herring, however, these made up a very small proportion of the overall biomass and almost none were encountered in the 2017 or 2018 acoustic survey or in the Q1 trawl surveys.
It is possible that this to some extent is due to differences in the fishing practices employed between commercial and research vessels. The commercial catches are mainly taken in very shallow water unavailable to the survey vessel, and only located after prolonged searching. This would indicate a typical pattern of decreased stock size in pelagic fish, where school size is maintained, but the number of schools is decreased and the encounter rate in the survey reduced. The lack of catch data since 2014 hinders further comparisons with recent survey results.
However, the distinct shift in age composition was also observed in the results from the MSS bottom trawl survey series indicating that this shift in perception of the age composition is not caused by a failure of the survey to capture older fish. The re-appearance of mature fish in the 2016 survey (and confirmed in the bottom trawl survey in 2016) indicates that the survey in its present form is able to detect the presence of these older fish.
The herring biomass in the Firth of Clyde is predominantly composed of young immature individuals. It is not known whether these juvenile herring originate from herring spawning within the Clyde, but based on studies from other nursery areas there is a strong likelihood that herring in the Clyde comprise a mixture of different biological populations; the mix of stocks is uncertain but it is likely that the Clyde also contains juvenile Irish Sea herring for example.
It is not possible to estimate Maximum Sustainable Yield (MSY) from currently available data sources, particularly given the likely mixing with other West of Scotland herring stocks. The present data collection programme will continue to contribute to the assessment of the stocks.
The continued absence of adult fish in the surveys in 2019 - 2021 warrant continued conservative management of the resource. Given the poor state of several of the herring stocks to the west of Scotland, and the high likelihood that the juvenile herring in the Clyde are from one or more of these stocks, consideration should be given to continue to offer protection for these in the Clyde so as not to adversely impact neighbouring stocks.
In the light of the available evidence there is no support for an increase in the TAC for 2022. Neither is there a strong case for further reducing the TAC as long as the strict control measures[2] in place already, including the minimum landing size and temporal closures[3], stay in place. Efforts to ensure catches by vessels fishing in the Clyde are properly sampled should be heightened.
Contact
Email: clydeherring@gov.scot