Herring in the Firth of Clyde - recommending the total allowable catch for 2026: consultation
Consultation relating to the 2026 Total Allowable Catch (TAC) for herring in the Firth of Clyde. The Marine Directorate of the Scottish Government is carrying
out this consultation on behalf of the UK Fisheries Administrations to seek views on the level of the 2026 TAC.
Closed
This consultation closed 8 July 2026.
View this consultation on consult.gov.scot, including responses once published.
6. Scientific Information on the Status of Herring (Clupea harengus) in the Clyde Sea (ICES Statistical Rectangles 39E4 – 40E5) in 2026
Prepared by Campbell Pert and Helen Dobby
Marine Directorate of the Scottish Government, Marine Laboratory, 375 Victoria Road, Aberdeen, AB11 9DB
6.1 Executive Summary
The herring fishery in the Clyde has declined from its peak in the 1960s, with annual catches typically less than 500 tonnes over the last 20 years. Excluding 180 tonnes caught in 2021 and 323 tonnes in 2025, there have been no other commercial catches recorded in the Clyde since 2014.
The 2025 Q4 survey suggested an apparent decrease in biomass, although the long-term trend in the Q4 survey remains upwards. Furthermore, the presence of an adult cohort in Q4 does give rise to some optimism that Clyde herring stocks could increase in subsequent years, and the Q1 survey in 2026 showed a considerable increase to around the historical mean.
There is no evidence to indicate that stocks have significantly decreased since 2024, although Q4 2025 data did indicate a year-on-year decrease in stock biomass, consistent with other surveys west of the UK, although this was tempered by an increase during Q1 in 2026. Therefore, there is insufficient scientific evidence to suggest that an increase above the 2025 TAC of 583 tonnes would be appropriate. Similarly, the data do not suggest that the TAC should be reduced below the current level.
Due to the lack of available scientific acoustic survey data and/or catches for Clyde herring, and given the relatively poor state of several herring stocks to the west of the British Isles, consideration should be given to continuing current control measures in place for Clyde herring. In addition, awareness should continue to be raised among fishers to ensure compliance with these measures.
6.2 History of the Fishery
The Firth of Clyde is a fjordic-like system, reaching over 100 km into the southwest coast of Scotland, which has a centuries-long history of fishing. Advances in fishing gears and vessels, and a succession of fishery management regulations[1] have altered the fishery and the fish stocks of the Clyde.
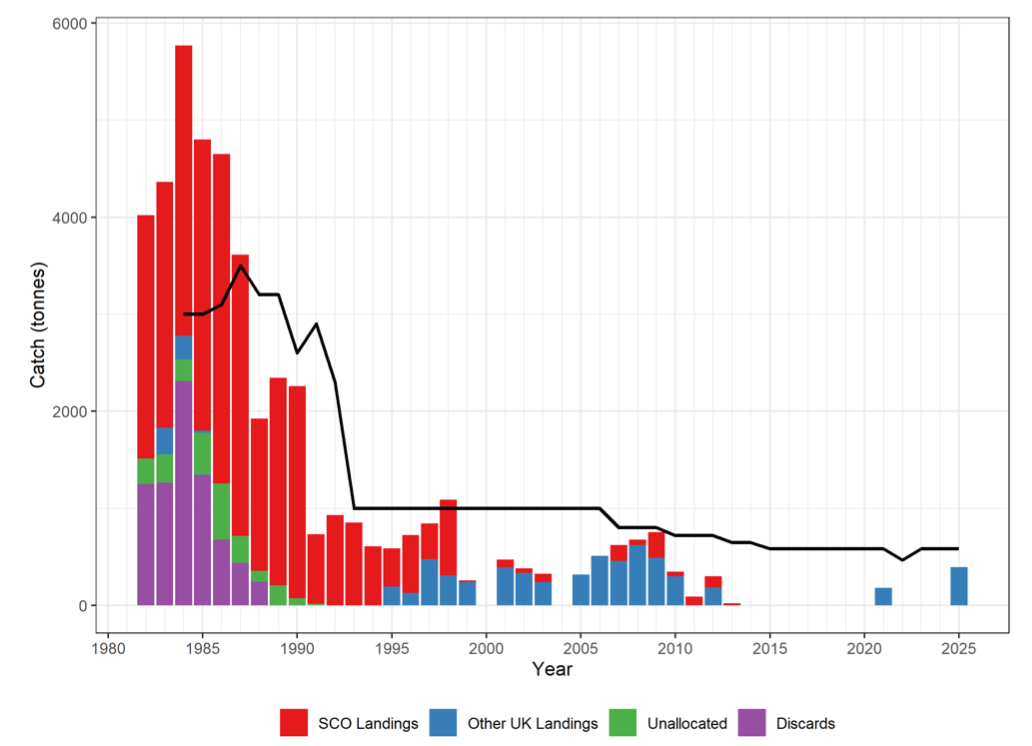
Herring in the Firth of Clyde was one of the most economically important species to local fishers during the first half of the 20th century. Annual landings of herring between 1900 and 1940 were typically 10,000 to 20,000 tonnes/year, and landings reached a peak between the late 1950’s and mid-1960’s. From the mid 1960’s to 1980’s landings fluctuated between 2,000 and 5,000 tonnes (Figure 1). A Total Allowable Catch (TAC) was first introduced in 1984; the TAC was 1,000 tonnes from 1993 until 2007 and has been gradually reduced since (Table 1) The TAC had been set at 583 tonnes per year from 2015 to 2021 before being reduced to 466 tonnes in 2022 and then returning to 583 tonnes in 2023. The reduction in 2022 was a precautionary measure following a mechanical breakdown of the research vessel RV Scotia., meaning the cancellation of the west coast IBTS survey in quarter 1 (Q1) and therefore that no fishery-independent data on herring in the Firth of Clyde were available for that year.
Historically, the fishery has been dominated by Scottish and Northern Irish vessels. Most of the catch was taken by Scottish vessels from 1995 to 2000, but by Northern Irish vessels from 2000 to 2012. From 2013 to date there were no reported commercial landings from the Clyde, apart from in 2021 and 2025 when Northern Irish vessels reported landings of 180 and 323 tonnes respectively (Table 1).
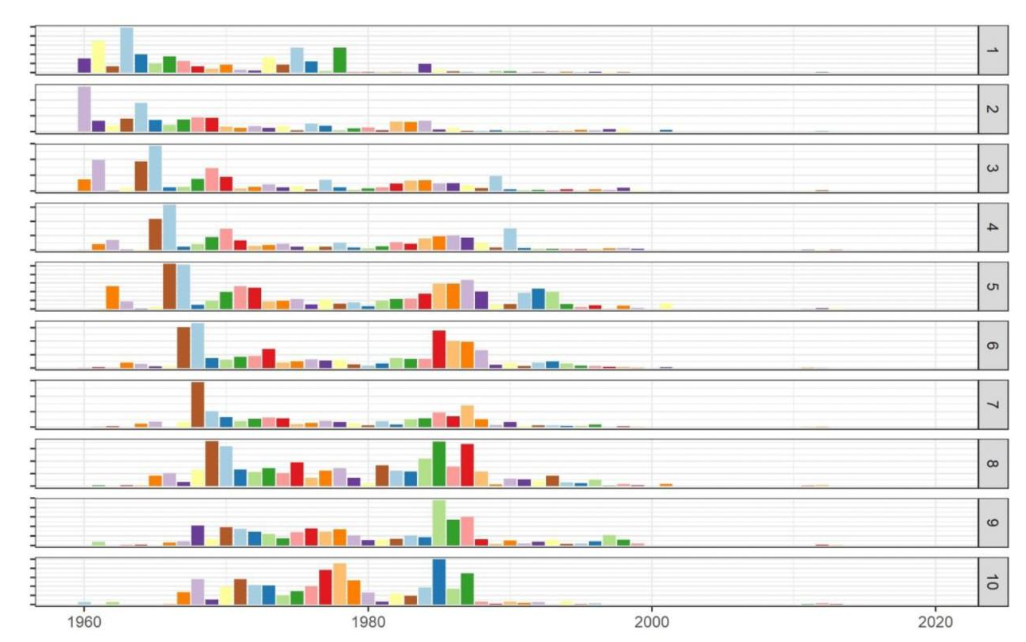
Since 1995 there has been virtually no unallocated catch or discarding reported for Clyde herring. Landings data are available from 1955, with data for 1982 to 2025 presented in Figure 1 and Table 1. Catch and sampling data are incomplete, resulting in a large proportion of the data being estimated; sampling effort has been low and the numbers-at-age data are unavailable from 2002-2010 and in 2021. In the historical data (with numbers at age) it is possible to track cohorts of herring as they move through the population. Figure 2 suggests there have been no strong year classes found in the Clyde commercial catches since the 1990s: however, in more recent years this is due to a lack of landings rather than a true reflection of stock abundance.
| Year | 1982 | 1983 | 1984 | 1985 | 1986 | 1987 | 1988 | 1989 | 1990 | 1991 | 1992 | 1993 | 1994 | 1995 |
|---|---|---|---|---|---|---|---|---|---|---|---|---|---|---|
| Scotland | 2506 | 2530 | 2991 | 3001 | 3395 | 2895 | 1568 | 2135 | 2184 | 713 | 929 | 852 | 608 | 392 |
| Other UK | - | 273 | 247 | 22 | - | - | - | - | - | - | - | 1 | - | 194 |
| Unallocated1 | 262 | 293 | 224 | 433 | 576 | 278 | 110 | 208 | 75 | 18 | - | - | - | - |
| Discards | 1253 | 1265 | 23082 | 13442 | 6792 | 439 | 245 | -3 | -3 | -3 | -3 | -3 | -3 | -3 |
| Agreed TAC | - | - | 3000 | 3000 | 3100 | 3500 | 3200 | 3200 | 2600 | 2900 | 2300 | 1000 | 1000 | 1000 |
| Total | 4021 | 4361 | 5770 | 4800 | 4650 | 3612 | 1923 | 2343 | 2259 | 731 | 929 | 853 | 608 | 586 |
| Year | 1996 | 1997 | 1998 | 1999 | 2000 | 2001 | 2002 | 2003 | 2004 | 2005 | 2006 | 2007 | 2008 | 2009 |
|---|---|---|---|---|---|---|---|---|---|---|---|---|---|---|
| Scotland | 598 | 371 | 779 | 16 | 1 | 78 | 46 | 88 | - | - | - | 163 | 54 | 266 |
| Other UK | 127 | 475 | 310 | 240 | 0 | 392 | 335 | 240 | - | 318 | 512 | 458 | 622 | 488 |
| Unallocated1 | - | - | - | - | - | - | - | - | - | - | - | - | - | - |
| Discards | -3 | -3 | -3 | -3 | -3 | -3 | -3 | -3 | -3 | -3 | -3 | -3 | -3 | 46 |
| Agreed TAC | 1000 | 1000 | 1000 | 1000 | 1000 | 1000 | 1000 | 1000 | 1000 | 1000 | 1000 | 800 | 800 | 800 |
| Total | 725 | 846 | 1089 | 256 | 1 | 470 | 381 | 328 | 0 | 318 | 512 | 621 | 676 | 800 |
| Year | 2010 | 2011 | 2012 | 2013 | 2014 | 2015 | 2016 | 2017 | 2018 | 2019 | 2020 | 2021 | 2022 | 2023 |
|---|---|---|---|---|---|---|---|---|---|---|---|---|---|---|
| Scotland | 48 | 90 | 118 | 21 | 0 | 0 | 0 | 0 | 0 | 0 | 0 | 0 | 0 | 0 |
| Other UK | 301 | 0 | 184 | 0 | 0 | 0 | 0 | 0 | 0 | 0 | 0 | 180 | 0 | 0 |
| Discards | 255 | 20 | 2 | 53 | 25 | 5 | 4 | 6 | 3 | 5 | -3 | -3 | -3 | -3 |
| Agreed TAC | 720 | 720 | 720 | 648 | 648 | 583 | 583 | 583 | 583 | 583 | 583 | 583 | 466 | 583 |
| Total | 604 | 110 | 304 | 78 | 25 | 5 | 4 | 6 | 3 | 5 | 0 | 180 | 0 | 0 |
| Year | 2024 | 2025 |
|---|---|---|
| Scotland | 0 | 0 |
| Other UK | 0 | 323 |
| Discards | -3 | -3 |
| Agreed TAC | 583 | 583 |
| Total | 0 | 323 |
1 Calculated from estimates of weight per box and/or by-catch in the sprat fishery
2 Based on sampling.
3 Estimated to be at a low level, currently unknown
6.3 Landings Data Collected Since 2011
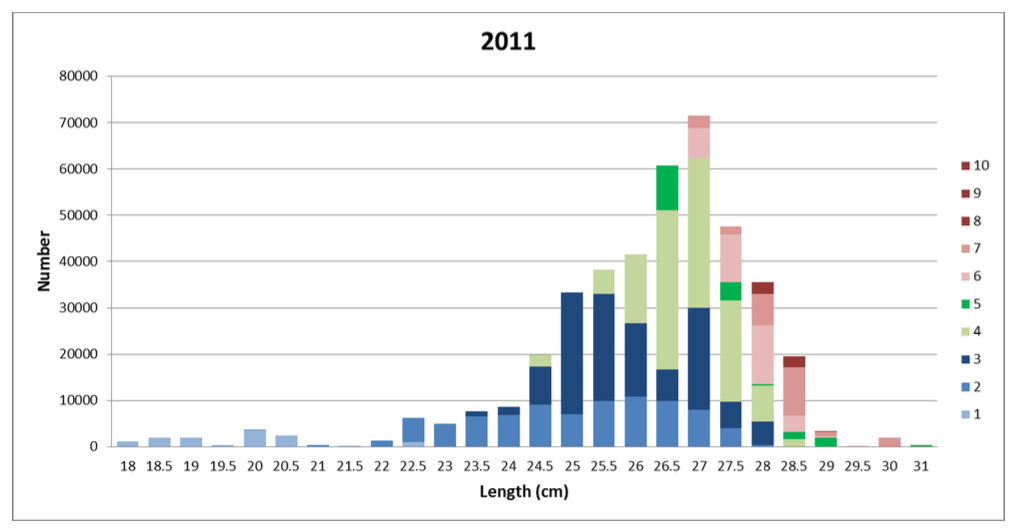
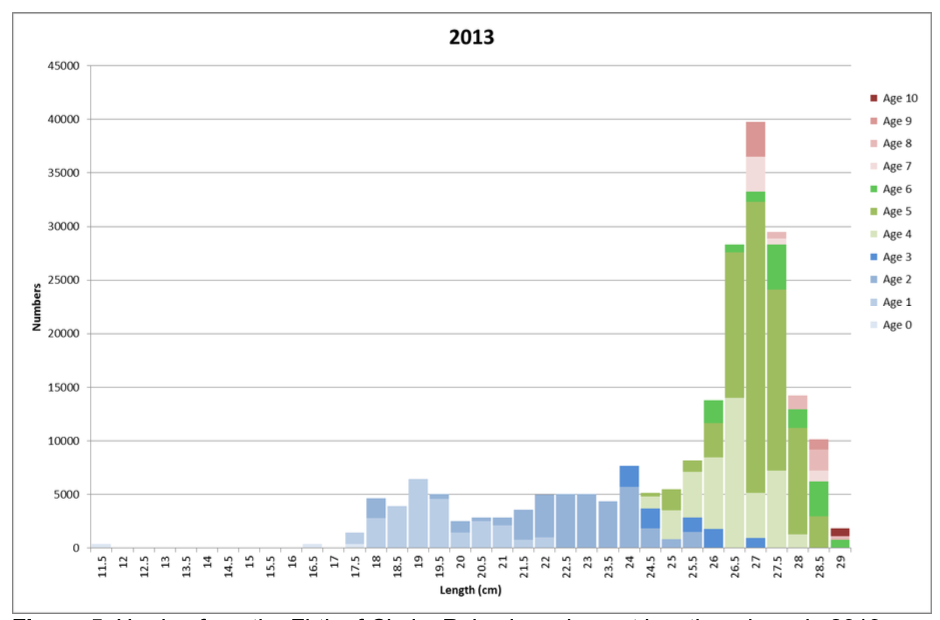
In 2011 the targeted sampling of Clyde herring landings was successfully resumed in collaboration with the Marine Directorate (MD) Compliance fishery office in Campbeltown. During the 2011 herring season a total of six samples were collected from seven hauls (Table 2) in the inner Firth of Clyde. Length information was collected from 693 herring and otoliths were taken and aged from 229 herring. Fish ranged in length from 18 to 31 cm, with a modal length of 27 cm (Figure 3). Landings consisted of fish spanning the full age range (1 – 10 years). Approximately 40% of the fish landed were four years or older.
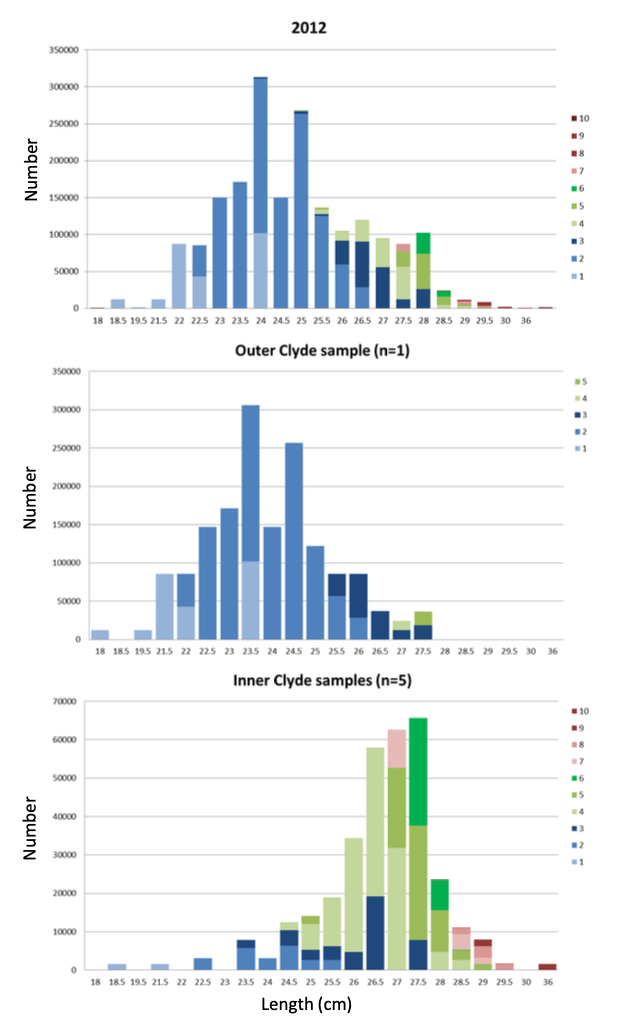
The 2012 fishery was carried out by two Scottish vessels operating as a pair team, alongside one Northern Irish vessel. The two Scottish vessels made a total of 11 trips, whereas the Northern Irish vessel made one trip that accounted for 61% of the total landings (Table 1). Landings were dominated by this one large haul caught at the outer edge of the Firth of Clyde (pers. comm. SFO Campbeltown). Overall, six samples were collected from the 12 trips. Similar to 2011, five of these samples were collected in the inner Firth of Clyde. A total of 679 herring were measured and 189 fish were aged (Table 2).
| Year | Landings | Landings sampled | Proportion Sampled | Measured herring | Aged herring |
|---|---|---|---|---|---|
| 2011 | 7 | 6 | 86% | 693 | 229 |
| 2012 | 12 | 6 | 50% | 679 | 189 |
| 2013 | 4 | 2 | 50% | 420 | 280 |
| 2014 -2020 | 0 | - | - | - | - |
| 2021 | 1 | - | - | - | - |
| 2022 - 2024 | 0 | - | - | - | - |
| 2025 | 1 | 1 | 100% | TBD* | TBD* |
*Insufficient time to consider the data for the 2026 report
Fish sampled in 2012 ranged from 18 to 36 cm, with a modal length of 24 cm. Landings were dominated by fish between 1 – 3 years (Figure 4). The large landings from the outer Clyde consisted solely of smaller younger herring (modal length 23.5 cm and age range of 1 – 5 years, 95% of fish aged 3 or below). In contrast the landings from the inner Clyde were more similar in composition to 2011 (modal length 27.5 cm, spanning the full age range, 67% of fish landed were 4 years or older).
The dominance of the large sample from the outer Clyde resulted in the numbers at age in the landings being very different in 2012 compared to 2011. The proportion of fish at older ages in 2012 was much lower than in 2011, but this was entirely driven by the composition of the one large landing from the outer Clyde.
In 2013 the fishery was very small, with only 21 tonnes of registered landings (Table 1). Half of the four trips carried out by Scottish vessels were sampled (Table 2). A total of 420 herring were measured and 280 fish were aged. Fish ranged from 11.5 to 29 cm, with a modal length of 27 cm that was similar to previous years. Landings were dominated by age 5 fish (35%; Figure 5).
Since 2013 there has only been two official reported landings of Clyde herring. In 2021 a single landing of 180 tonnes was landed into Belfast, and this occurred again in 2025 with 323 tonnes landed by Northern Irish pelagic vessels. However, the 2021 landing was not sampled as the fish were caught and landed four weeks before Marine Directorate staff were made aware. Attempts to obtain biological data via colleagues at the Agri-Food and Biosciences Institute (AFBI) in 2021 were unsuccessful as their staff were not present either during the landing. The 2025 catch was sampled by AFBI staff, however there was insufficient time to consider this data for the 2026 report. Therefore, as in previous years, no landings sample data either of these years are presented.
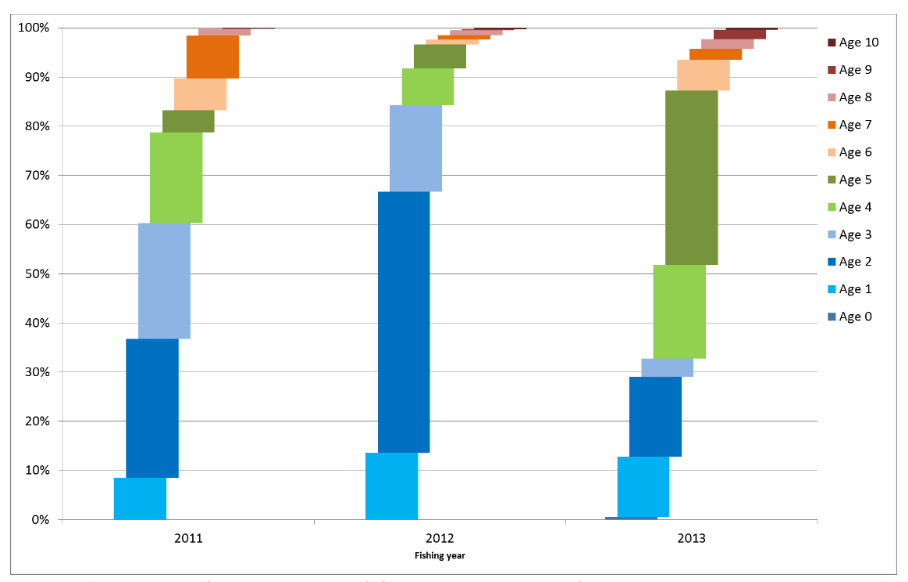
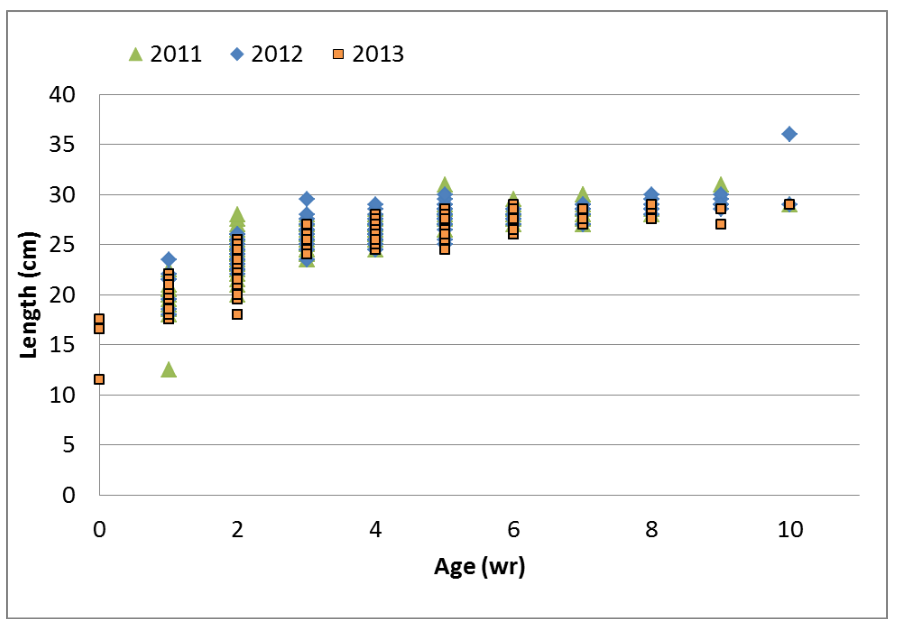
From the three years of landings samples available, the proportion of herring older than age 5 tended to be low. Landings were dominated by different ages over the three years (Figure 6), although the sample data in 2012 were dominated by the one large landing in the outer Clyde. Length against age plots (Figure 7) suggests a fairly rapid growth in the first few years followed by slower growth over a protracted period. This plot does not fully track the growth of individual year classes and should be treated as a preliminary analysis. The data from the three available years are in good agreement with one another.
Additional licence conditions for vessels operating in the Clyde fishery require the supply of GPS data from the vessels operating in the area and a haul-by-haul log of catches. Together with the specific sample information described above, this will play an important role in furthering our knowledge of the state of the stock.
6.4 Discard Data
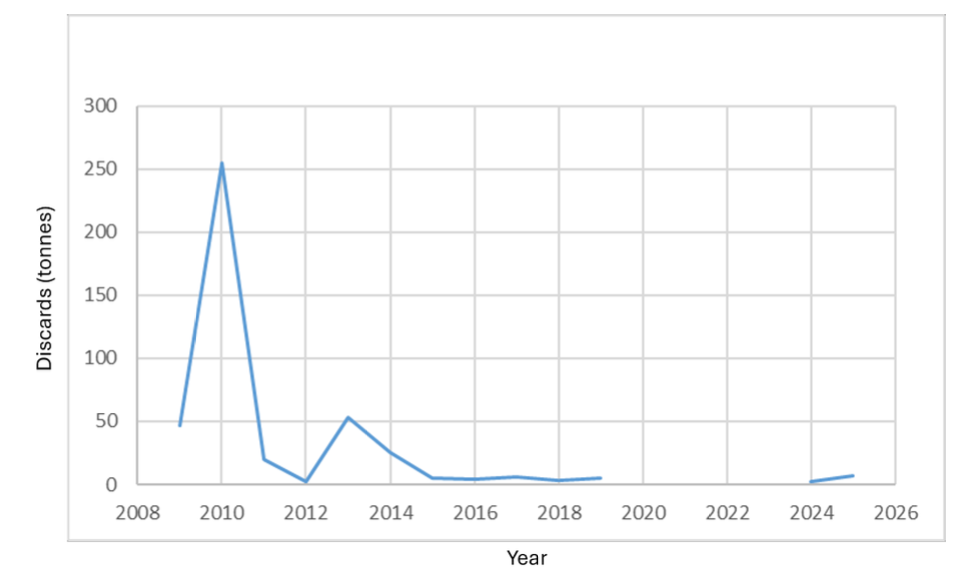
Examination of the dataset held by MD demonstrates that there has not been consistent sampling of herring discards in the Clyde throughout the timeseries. Until 1988 discards were estimated but from 1989 to 2008, discard levels are unknown (Table 1). From 2009-2025, discard estimates from the Nephrops fishery are available from observer trips. It should be noted that there are relatively few trips sampled each year, so estimates are highly variable. There were no observer trips from 2020 to 2023 due to the Covid-19 pandemic, and only very limited trips in 2025 due to difficulty in accessing vessels so estimates in the most recent years are not available. Estimates of discards from 2012 to 2025 have been low compared to earlier years and historical levels (Figure 8).
Discards from 2009 to 2019 were dominated by small herring (Figure 9), which were often smaller in size than herring sampled from the commercial sampling programme (Figures 3 to 5). It is possible that the Nephrops fishery could have an impact on juvenile herring that have not yet matured and had the opportunity to spawn. However, in some years a larger proportion of the herring discarded by the Nephrops fishery are of commercial landing size (Figure 9).
6.5 Survey Data
6.5.1 Acoustic Surveys Prior to 2012
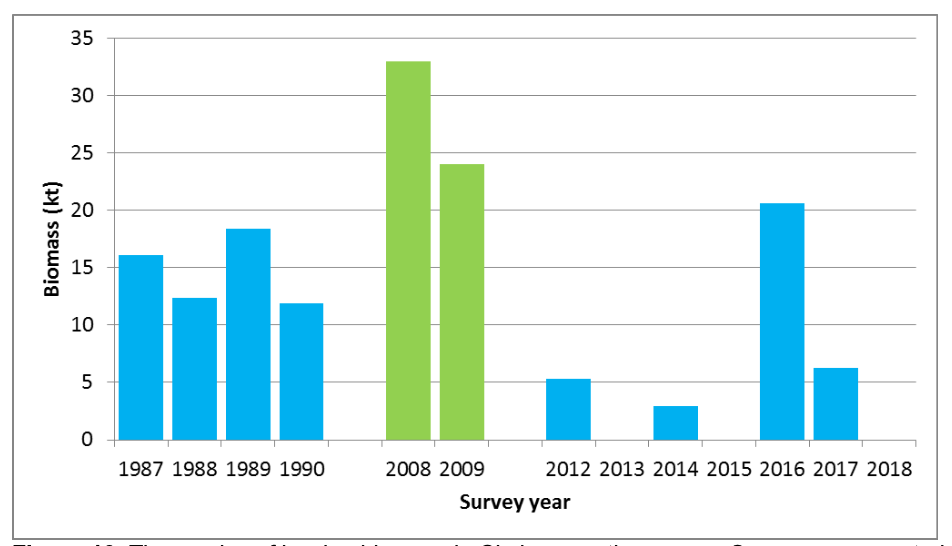
Acoustic surveys were carried out in July from 1987 to 1990 and again in 2008 and 2009 (Table 3, Figure 10, Figure 11). These surveys aimed to provide an estimate of age-disaggregated abundance/biomass indices using acoustic equipment alongside pelagic trawls.
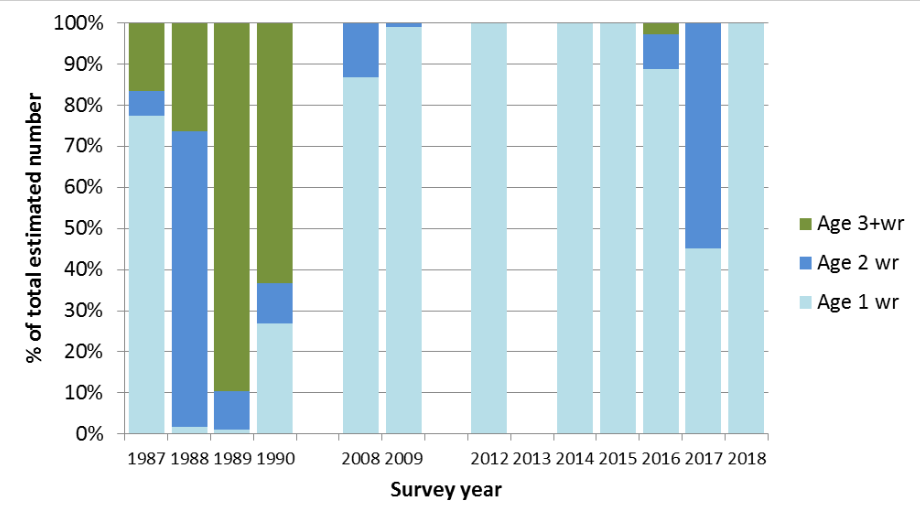
The 2008 and 2009 acoustic surveys showed a higher biomass than in earlier years (Figure 10). The biomass was predominately within the boundaries of the Clyde area, and consisted solely of aged one and two (juvenile) herring (Figure 11) rather than herring of a size targeted by the fishery (over 20 cm).
| Age (year) | 1987 | 1988 | 1989 | 1990 | 2008 | 2009 |
|---|---|---|---|---|---|---|
| 1 | 148.2 | 1.6 | 1.2 | 19.9 | 86 | 99 |
| 2 | 11.5 | 67.4 | 9.5 | 7.1 | 13 | 1 |
| 3 | 9.2 | 6.2 | 80.3 | 5.5 | 0 | 0 |
| 4 | 11.5 | 4.8 | 6.7 | 33.3 | 0 | 0 |
| 5 | 5.7 | 5.5 | 2.4 | 4.0 | 0 | 0 |
| 6 | 3 | 3.6 | 1.8 | 2.5 | 0 | 0 |
| 7 | 1.2 | 2.8 | 1.1 | 0.7 | 0 | 0 |
| 8 | 0.7 | 1.5 | 0.32 | 0.6 | 0 | 0 |
| >9 | 0.4 | 0.4 | 0.1 | 0.2 | 0 | 0 |
| Biomass | 16.1 | 12.4 | 18.4 | 11.9 | 33 | 24 |
6.5.2 Acoustic Surveys 2012 – 2018
A series of pelagic acoustic surveys in the Clyde were carried out each October between 2012 and 2018, apart from 2013 when the survey was cancelled due to vessel breakdown (Figure 10). In 2015 and 2018 intermittent faults with the 38 kHz transducer meant that it was not possible to estimate total biomass for these years. Information on size and age composition are still available for those years (Figure 11).
The sizes and capabilities of survey vessels used in the older and more recent surveys are comparable, as are the methods used. However, there are differences in season (summer vs. winter survey) and the total area covered. Given that the fishery has mainly taken place during the early winter it was deemed more appropriate to conduct acoustic surveys that coincide with the fishery when acoustic surveys resumed in 2012. While the lack of adult herring in the more recent surveys is not thought to be a consequence of changes in survey approach, the results are not directly comparable.
Distributions of herring in the surveys were similar between years, with most herring encountered in the inner Clyde to the west and south of the Isle of Bute and in the deeper parts to the east and southeast of Arran. Except for 2016, biomass estimates were significantly lower than estimates from the previous survey series (Figure 10). Contrasting earlier surveys, herring biomass during 2014 to 2018 consisted almost entirely of immature herring (Figure 11).
No acoustic surveys have taken place since 2018, however, the Marine Directorate are planning to restart a Clyde acoustic survey for herring and sprats in 2027.
6.5.3 Bottom Trawl Survey Data
The MD carries out two annual bottom trawl surveys in West of Scotland waters, with stations in the Firth of Clyde. The current time series extends from 1986 to 2025 for Q1, and from 1997 to 2025 for Q4. In 2022 the Q1 survey was cancelled due to a vessel mechanical breakdown. While bottom trawl surveys are not ideal for capturing the dynamics of a pelagic species such as herring, they provide a long-continued time series and are sometimes included in stock assessments for herring stocks.
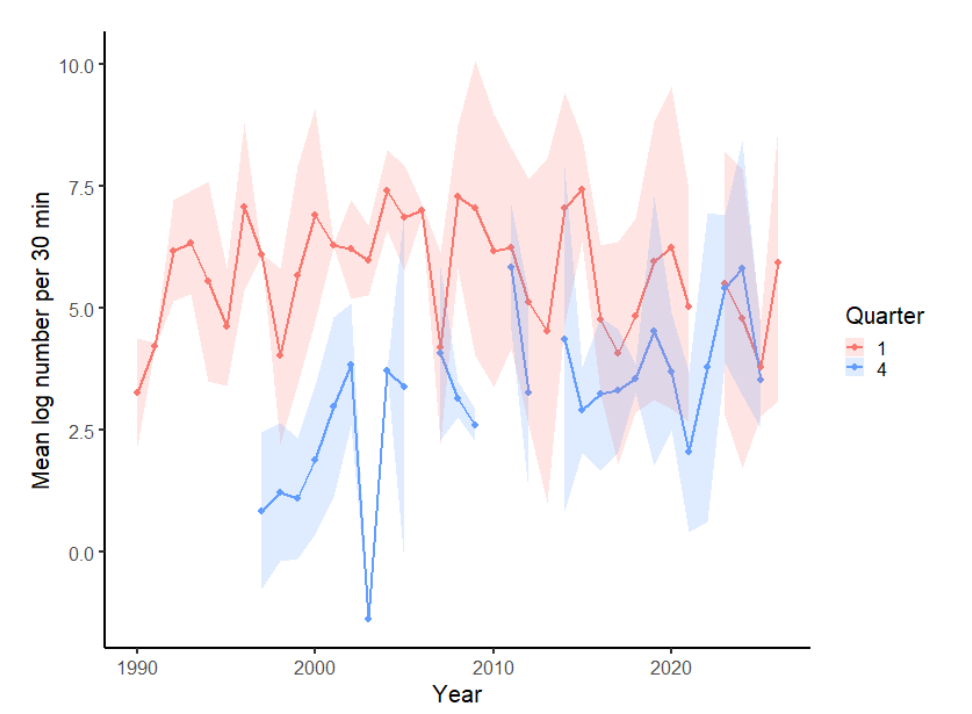
An analysis of mean log number per standard tow reveals that the mean catch rate of herring in the Clyde has fluctuated over the years, although uncertainty around these figures remains high due to the relatively low number of tows (typically 4 – 6) carried out each year (Figure 12). Historically, catches have consistently been higher in Q1 compared to Q4. This trend appeared to change with catches increasing markedly in Q4 between 2021 and 2024 with mean catch rates in 2024 higher in Q4 than Q1. However, catches during the 2025 surveys fell during both Q1 and Q4 before the Q1 IBTS survey in 2026 showed catches returning to previous levels. These findings are consistent with the Malin Shelf acoustic surveys in neighbouring ICES Division 6aN where there was a considerable decrease in the detected biomass in the summer of 2025 which may have been due to a marine heatwave.
An analysis of the spatial distribution of catches in the IBTS surveys suggests that herring are not evenly spread throughout the Clyde but have a patchy distribution. Therefore, the stock perception can sometimes be influenced from year to year depending on whether a large haul is taken, such as those seen in Ayr Bay in some years (Figure 13, Figure 14).
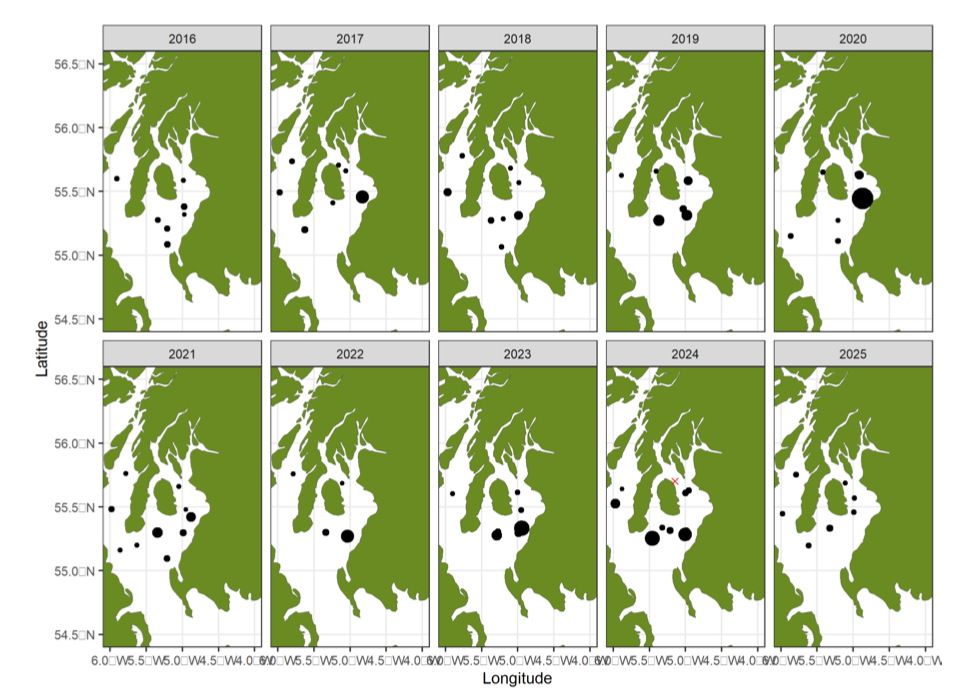
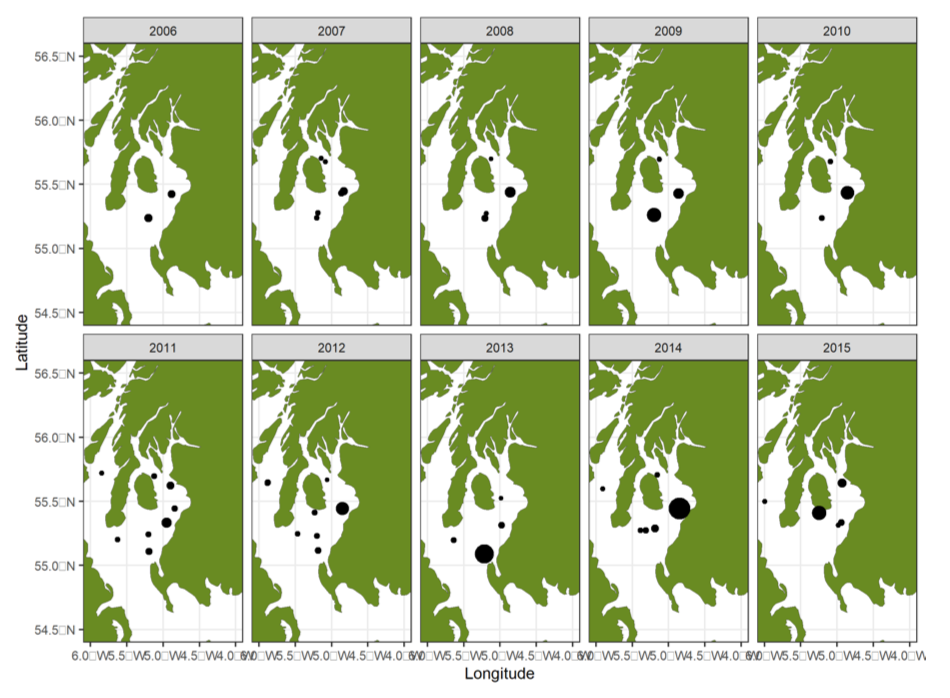
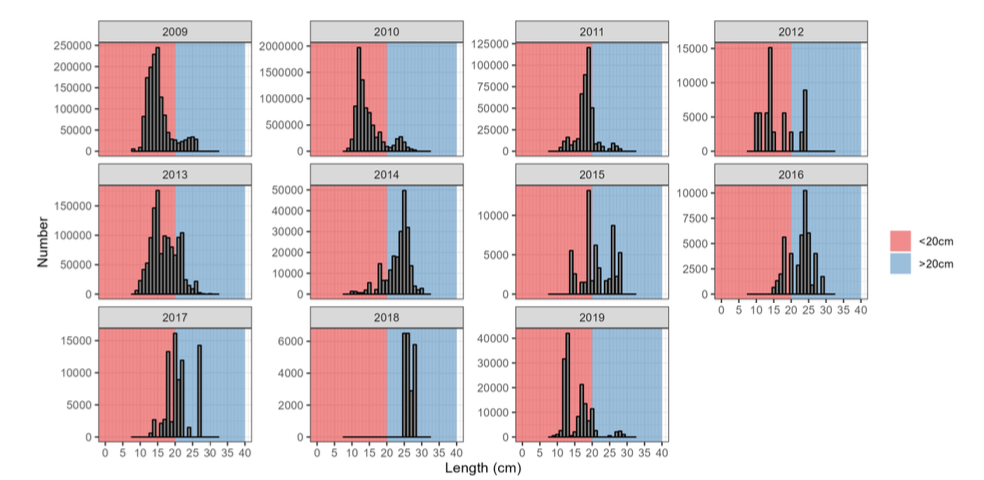
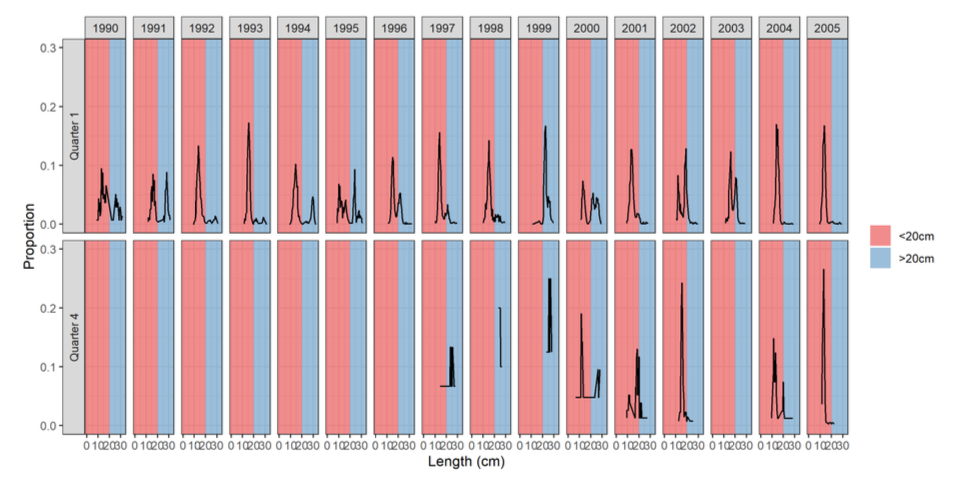
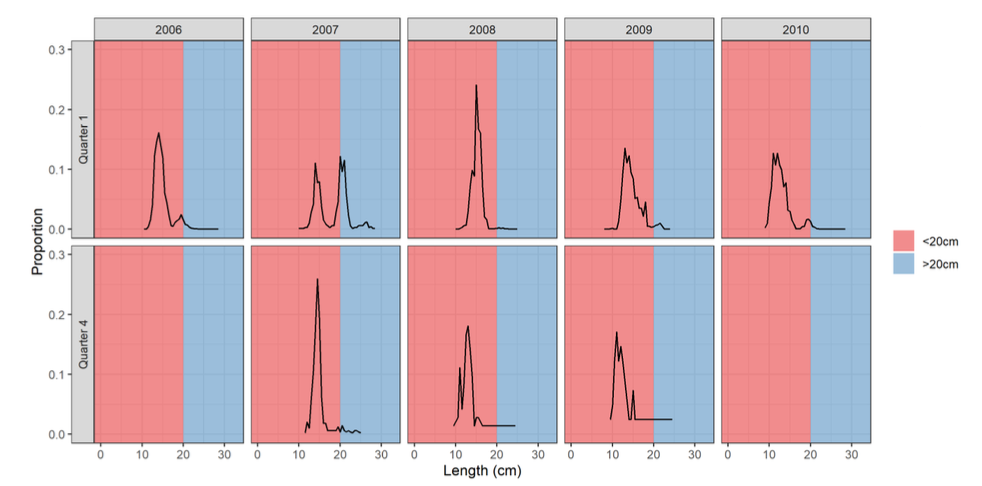
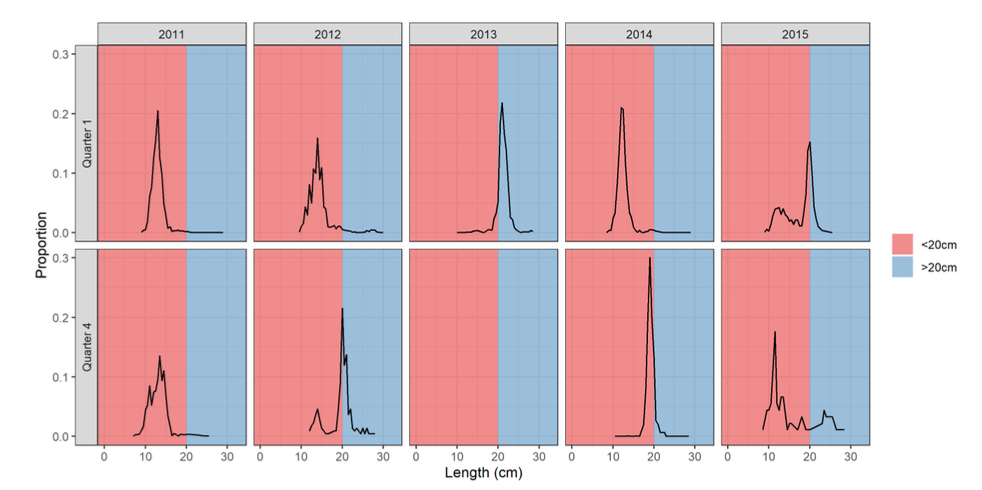
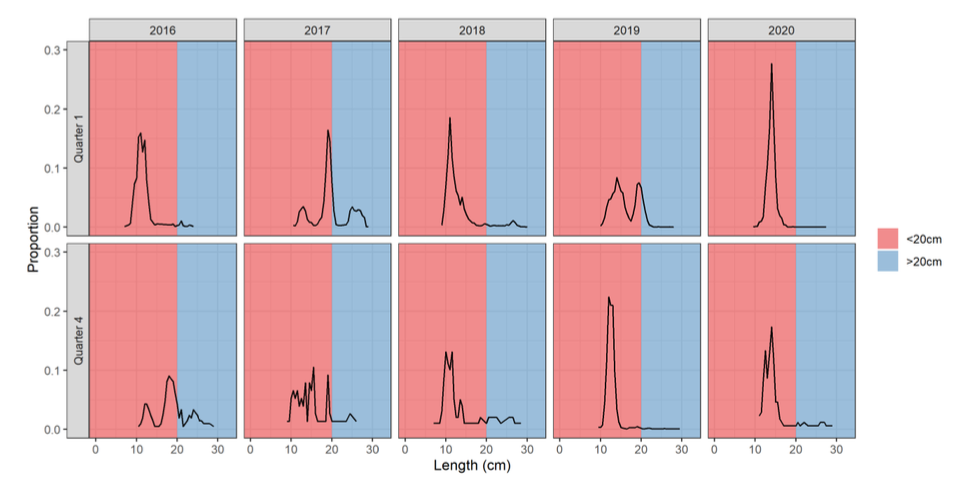
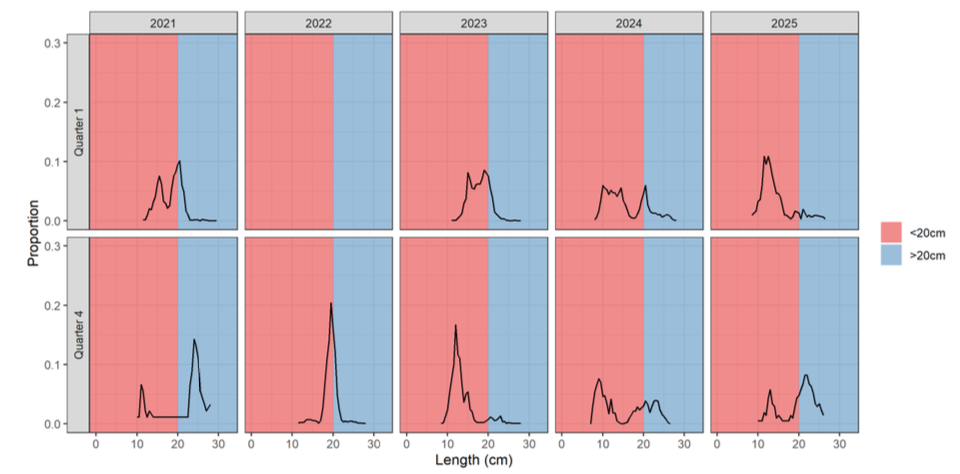
An analysis of the length frequencies of herring from IBTS catches in 2025 indicates that the Clyde herring stock contains a range of size classes, although (similar to previous years) many of these are small fish in the 0–2 age range (Figure 15-19). However, the Q4 data indicates a cohort within the minimum landing size of 20 cm in place for this area, and a second group potentially adding to the commercial size biomass in 2026/27.
6.6 Assessments
The most recent analytical stock assessment for Clyde herring was performed in 1990.
6.7 Industry Perception
The commercial samples taken from 2011 to 2013 indicate that a significant portion of the landed fish were age 4 or older. The failure of the 2012 to 2018 surveys to capture the adult fish that form the basis of the fishery was seen as problematic. The issue was discussed with industry members pursuing the herring fishery in meetings in 2014, 2015 and 2019.
Many of the commercial landings sampled were caught close inshore in areas that were too shallow for the survey vessel to safely traverse or deploy fishing gear due to its relatively large size. There were additional concerns that the acoustic surveys were carried out during the day while adult herring are perceived by fishers to rise off the bottom at night time, becoming easier to detect and catch. The difference in the timing of the fishery and acoustic surveys (particularly the summer surveys of 2008 and 2009) was discussed as a potential cause of differences in perception due to a possible migration of adult herring into the Clyde after completion of the survey. Historically, the timing of the fishery did not appear to be guided by the availability of large herring, but rather the availability of time to pursue the fishery (which was largely opportunistic). It was mentioned that locating herring of commercially-viable sizes was time consuming and required detailed local knowledge.
During 2025 there was a targeted fishery by Northern Irish pelagic vessels belonging to the Scottish Pelagic Fisherman’s Association (SPFA) during which length frequency samples were collected by AFBI. This data will be considered in due course and once a multi-year time series is collected.
6.8 Discussion and Conclusion
The lack of adult herring found during the Q1 IBTS surveys in the Clyde in recent times (2020 – 2025) has been a cause for some concern in what was traditionally a spring stock.
The acoustic survey in 2016 and the trawl surveys in Q4 since 2021 encountered greater proportions of larger mature herring present in the Clyde. However, data from the Q1 survey would suggest that much of the herring biomass in the Firth of Clyde consists predominately of young immature individuals. It is not known whether these juvenile herring originate from herring spawning within the Clyde, as demonstrated by studies in the 1950s, but based on studies from other nursery areas there is a strong likelihood that herring in the Clyde consist of a mixture of different biological populations. However, while the mix of stocks is uncertain, it is likely that the Clyde also contains juvenile Irish Sea as well as Division 6aN herring. It would be beneficial to try and address this knowledge gap via genetic analysis, although sourcing samples has, to date, proved difficult.
The 2025 IBTS surveys suggested an apparent decrease in biomass during both Q1 and Q4, which is consistent with acoustic surveys carried out in the neighbouring Divisions 6.aN and 6.aS, 7.b-c. However, data from the 2026 Q1 IBTS survey indicate that the numbers of herring present have largely recovered to previous levels reported for the Clyde. Following the 2025 Malin Shelf survey, the ICES WGIPS noted there were few herring west of the 4° line with considerable aggregation east of the line which could explain the low biomass in the Clyde, 6a.N and 6.aS, 7.b-c. areas during 2025. This lends further support to a stock containment issue on the 2025 acoustic survey as large numbers of herring were detected around Shetland which could indicate a delayed southward migration due to a marine heatwave in 2025.
It is not possible to estimate Maximum Sustainable Yield (MSY) from the currently available data sources, particularly given the likely mixing with other West of UK herring stocks. The present data collection programme will continue to contribute to any future assessment of the stocks. However, given the relatively poor state of several herring stocks to the west of the British Isles and the high likelihood that juvenile herring in the Clyde are from one or more of these stocks, consideration should be given to continuing those protections currently in place for Clyde herring as a precautionary measure. Ensuring the protection of juvenile herring in the Clyde ensures there are likely to be no adverse impacts on neighbouring stocks.
Considering the available data, there is no evidence to indicate that stocks have significantly decreased since 2024. While the Q1 and Q4 2025 data suggested a decrease in stock biomass this was tempered by a corresponding increase to previous levels during Q1 of 2026. Accordingly, there is no strong case for reducing the TAC from the current 583 tonnes in 2026. Similarly there is currently insufficient data to support an increase above this level. However, MD scientists will continue to monitor the stock, and review advice if necessary, as the continued increase of a mature adult cohort in Q4 is a very positive sign and one which potentially could allow an increase in future years.
Similar to previous years, the strict control measures[2] already in place should remain. Additionally, efforts should be taken to ensure any catches by vessels in the Clyde are properly sampled and awareness raised among fishers intending to fish in the area for herring to ensure compliance with fishery stipulations.
Contact
Email: clydeherring@gov.scot