Fisheries and climate change: opinions from the wild capture fishing sector
Analysis and summary of an online survey of key stakeholders in the wild capture fishing sector, conducted by Marine Scotland during the COP26 climate change summit in 2021.
9 References
Friedlingstein, P., Jones, M. W., O'Sullivan, M., Andrew, R. M., Bakker, D. C. E., Hauck, J., Le Quéré, C., Peters, G. P., Peters, W., Pongratz, J., Sitch, S., Canadell, J. G., Ciais, P., Jackson, R. B., Alin, S. R., Anthoni, P., Bates, N. R., Becker, M., Bellouin, N., Bopp, L., Chau, T. T. T., Chevallier, F., Chini, L. P., Cronin, M., Currie, K. I., Decharme, B., Djeutchouang, L. M., Dou, X., Evans, W., Feely, R. A., Feng, L., Gasser, T., Gilfillan, D., Gkritzalis, T., Grassi, G., Gregor, L., Gruber, N., Gürses, Ö., Harris, I., Houghton, R. A., Hurtt, G. C., Iida, Y., Ilyina, T., Luijkx, I. T., Jain, A., Jones, S. D., Kato, E., Kennedy, D., Klein Goldewijk, K., Knauer, J., Korsbakken, J. I., Körtzinger, A., Landschützer, P., Lauvset, S. K., Lefèvre, N., Lienert, S., Liu, J., Marland, G., McGuire, P. C., Melton, J. R., Munro, D. R., Nabel, J. E. M. S., Nakaoka, S.-I., Niwa, Y., Ono, T., Pierrot, D., Poulter, B., Rehder, G., Resplandy, L., Robertson, E., Rödenbeck, C., Rosan, T. M., Schwinger, J., Schwingshackl, C., Séférian, R., Sutton, A. J., Sweeney, C., Tanhua, T., Tans, P. P., Tian, H., Tilbrook, B., Tubiello, F., van der Werf, G. R., Vuichard, N., Wada, C., Wanninkhof, R., Watson, A. J., Willis, D., Wiltshire, A. J., Yuan, W., Yue, C., Yue, X., Zaehle, S., and Zeng, J. (2022) Global Carbon Budget 2021, Earth Syst. Sci. Data, 14, 1917–2005, https://doi.org/10.5194/essd-14-1917-2022.
IPCC (2021) Summary for Policymakers. In: Climate Change 2021: The Physical Science Basis. Contribution of Working Group I to the Sixth Assessment Report of the Intergovernmental Panel on Climate Change [Masson-Delmotte, V., P. Zhai, A. Pirani, S.L. Connors, C. Péan, S. Berger, N. Caud, Y. Chen, L. Goldfarb, M.I. Gomis, M. Huang, K. Leitzell, E. Lonnoy, J.B.R. Matthews, T.K. Maycock, T. Waterfield, O. Yelekçi, R. Yu, and B. Zhou (eds.)]. Cambridge University Press, Cambridge, United Kingdom and New York, NY, USA, pp. 3−32, doi:10.1017/9781009157896.001
Sandison, Frances, Hillier, Jon, Hastings, Astley, Macdonald, Paul, Mouat, Beth, and Marshall, C. Tara (2021) The environmental impacts of pelagic fish caught by Scottish vessels, Fisheries Research, 236, 105850, https://doi.org/10.1016/j.fishres.2020.105850.
Scottish Government (2022) Scotland's Marine Economic Statistics, https://www.gov.scot/publications/scotlands-marine-economic-statistics-2019/
von Schuckmann, K., Cheng, L., Palmer, M. D., Hansen, J., Tassone, C., Aich, V., Adusumilli, S., Beltrami, H., Boyer, T., Cuesta-Valero, F. J., Desbruyères, D., Domingues, C., García-García, A., Gentine, P., Gilson, J., Gorfer, M., Haimberger, L., Ishii, M., Johnson, G. C., Killick, R., King, B. A., Kirchengast, G., Kolodziejczyk, N., Lyman, J., Marzeion, B., Mayer, M., Monier, M., Monselesan, D. P., Purkey, S., Roemmich, D., Schweiger, A., Seneviratne, S. I., Shepherd, A., Slater, D. A., Steiner, A. K., Straneo, F., Timmermans, M.-L., and Wijffels, S. E. (2020) Heat stored in the Earth system: where does the energy go?, Earth Syst. Sci. Data, 12, 2013–2041, https://doi.org/10.5194/essd-12-2013-2020.
Table 1
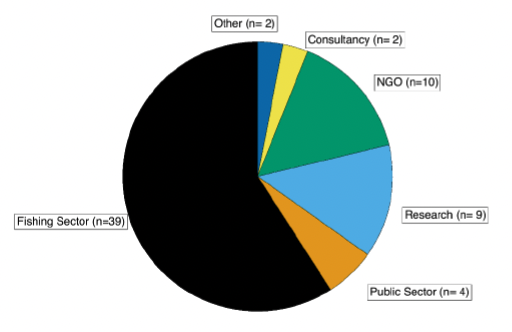
Total number of respondents by categories as asked in the survey (i.e., original sector) and total number and percentage of their aggregation into sectors for this analysis (i.e., sector). See also Figure 1.
| Original Sector |
N |
Sector |
N |
% |
|---|---|---|---|---|
| Fishing association |
8 |
Fishing Industry |
39 |
59.1 |
| Coalition |
1 |
|||
| Processor |
2 |
|||
| Producer's organisation |
2 |
|||
| Vessel owner/Skipper |
26 |
|||
| Government |
3 |
Public sector |
4 |
6.1 |
| Non-Departmental Public Body |
1 |
|||
| Academia |
8 |
Research |
9 |
13.6 |
| Independent Research Organisation |
1 |
|||
| Non-Governmental Organisation |
10 |
Non-Governmental Organisation |
10 |
15.2 |
| Consultancy |
2 |
Consultancy |
2 |
3.0 |
| Other |
2 |
Other |
2 |
3.0 |
| Total |
66 |
Total |
66 |
100.0 |
Table 2
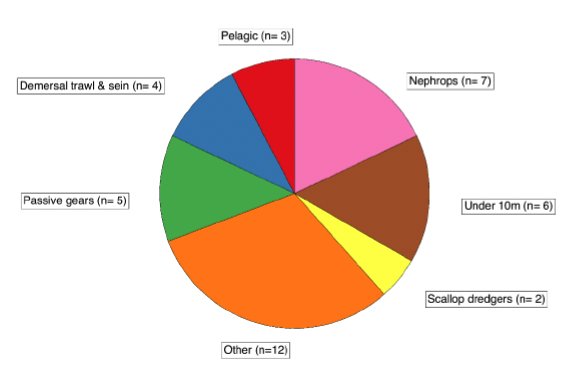
Total number and percentage of respondents from the fishing industry by fleet segment. See also Figure 1. More details on the choice of 'Other' are given in text.
| Fleet Segments |
N |
% |
|---|---|---|
| Pelagic |
3 |
4.6 |
| Demersal trawl & sein |
4 |
6.1 |
| Beam trawlers |
0 |
0.0 |
| Passive gears |
5 |
12.8 |
| Scallop dredgers |
2 |
5.1 |
| Nephrops |
7 |
17.9 |
| Under 10 m |
6 |
15.4 |
| Other |
12 |
30.8 |
| Total |
39 |
100.0 |
Table 3
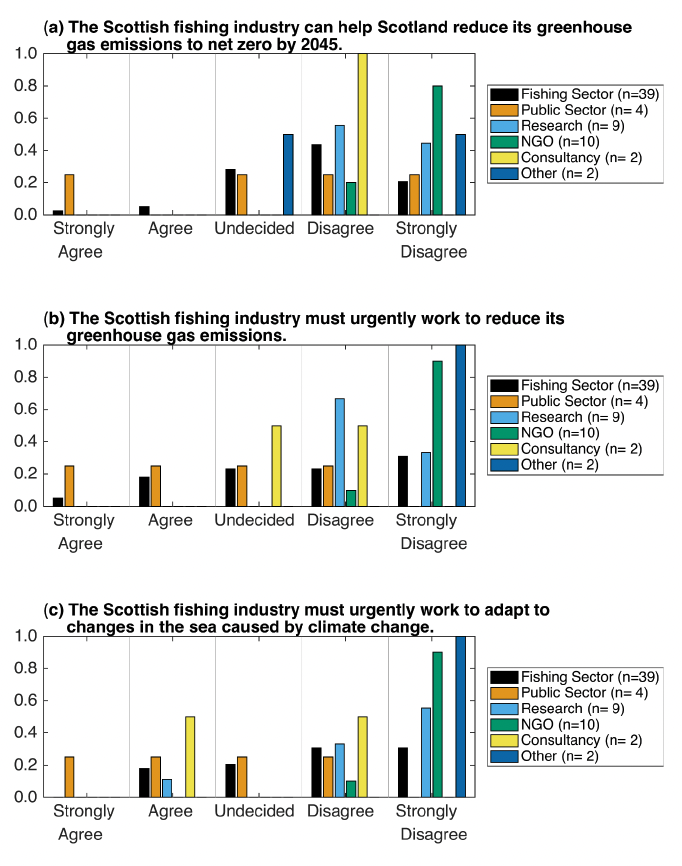
Summary of respondent answers to Questions 1 to 3 for all respondents See also Figure 2.
| Question Number |
Question |
Strongly disagree |
Disagree |
Undecided |
Agree |
Strongly agree |
|---|---|---|---|---|---|---|
| 1 |
The Scottish fishing industry can help Scotland reduce its greenhouse gas emissions to net zero by 2045. |
3.0%‡ |
3.0%‡ |
19.7%‡ |
40.9%‡ |
33.3%‡ |
| 2 |
The Scottish fishing industry must urgently work to reduce its greenhouse gas emissions. |
4.5% |
12.1% |
46.7% |
27.3% |
39.4% |
| 3 |
The Scottish fishing industry must urgently work to adapt to changes in the sea (warming seas, reduced oxygen, ocean acidification and sea-level rise) caused by climate change. |
1.5% |
15.2% |
13.6% |
27.3% |
42.4% |
‡ due to rounding, the total is 99.9%
Table 4
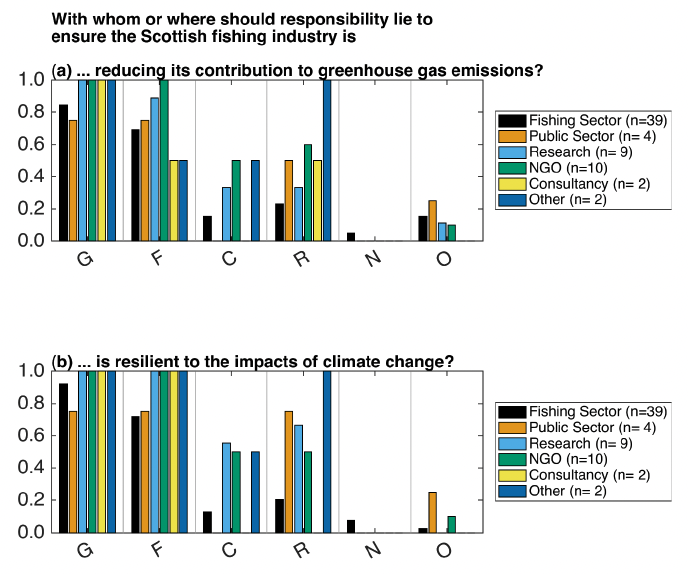
Summary of respondent answers to Questions 4 and 5 for all respondents See also Figure 3.
| Question Number |
Question |
Government |
Fishing industry/ producer |
Consumer |
Retail Organisation |
No opinion |
Other |
|---|---|---|---|---|---|---|---|
| 4 |
With whom or where should responsibility lie to ensure the Scottish fishing industry is reducing its contribution to greenhouse gas emissions? |
89.4% |
75.8% |
22.7% |
34.8% |
3.0% |
13.6% |
| 5 |
With whom or where should responsibility lie to ensure the Scottish fishing industry is resilient to the impacts of climate change? |
93.9% |
81.8% |
24.2% |
36.4% |
4.5% |
4.5% |
Table 5
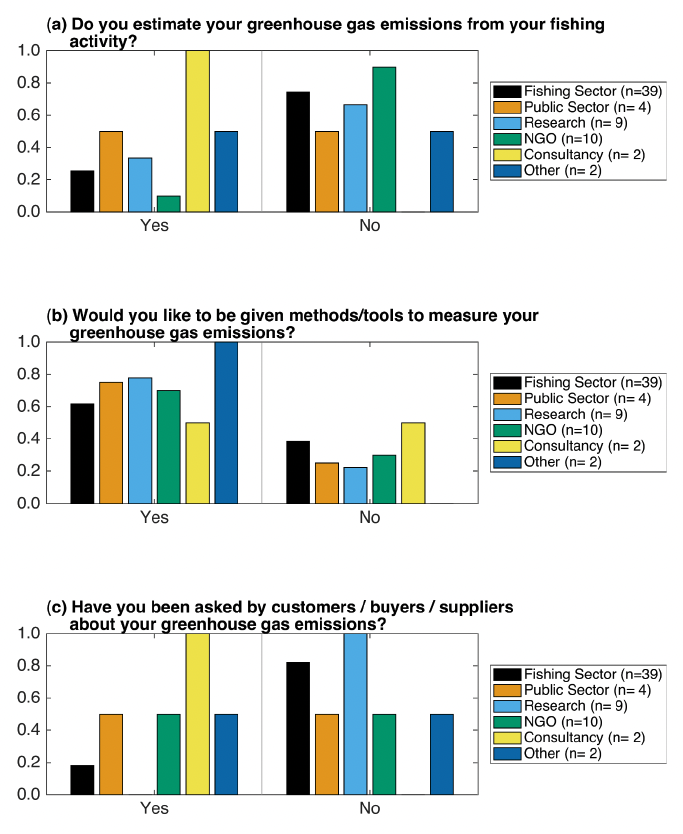
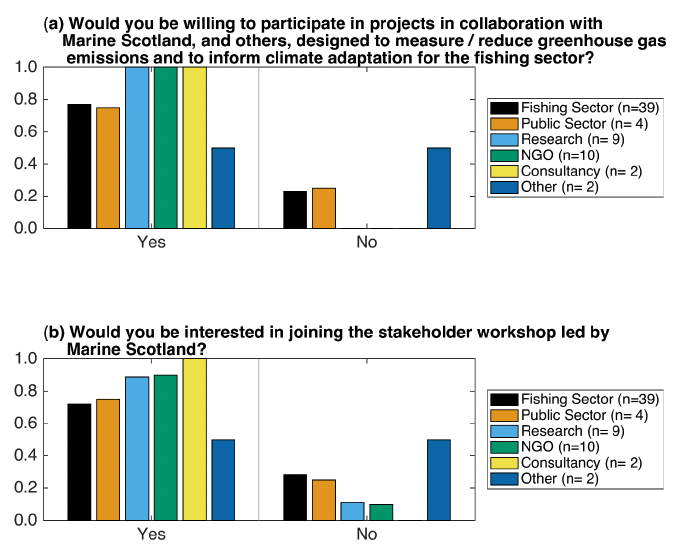
Summary of respondent answers to Questions 6 to 10 for all respondents (ALL; sample size = 66), and for industry representatives (i.e., vessel owner/skipper, producer's organisation, processor, fishing association, coalition; FISH; sample size = 39). See also Figures 4 and 5.
| Question Number |
Question |
ALL Yes |
ALL No |
FISH Yes |
FISH No |
|---|---|---|---|---|---|
| 6 |
Do you estimate your greenhouse gas emissions from your fishing activity? This includes emissions from vessel operations, such as fuel usage and refrigeration. This could be your own fishing vessel, or could be in support of others (for example, if you are an academic researcher). |
28.8% |
71.2% |
25.6% |
74.4% |
| 7 |
Would you like to be given methods/tools to measure your greenhouse gas emissions? |
66.7% |
33.3% |
61.5% |
38.5% |
| 8 |
Have you been asked by customers / buyers / suppliers about your greenhouse gas emissions? |
25.8% |
74.2% |
17.9% |
82.1% |
| 9 |
Would you be willing to participate in projects in collaboration with Marine Scotland, and others, designed to measure / reduce greenhouse gas emissions and to inform climate adaptation for the fishing sector? |
83.3% |
16.7% |
76.9% |
23.1% |
| 10 |
Would you be interested in joining the stakeholder workshop led by Marine Scotland in early 2022 where the aim will be to establish a working group and a programme of work to inform climate change mitigation and adaptation in Scottish fishing? |
77.3% |
22.7% |
71.8% |
28.2% |
Table 6
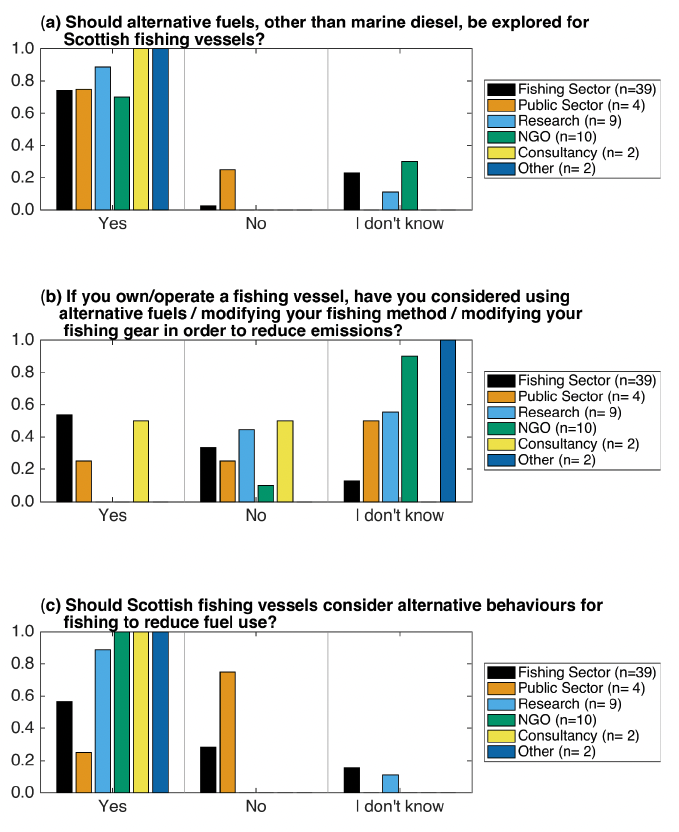
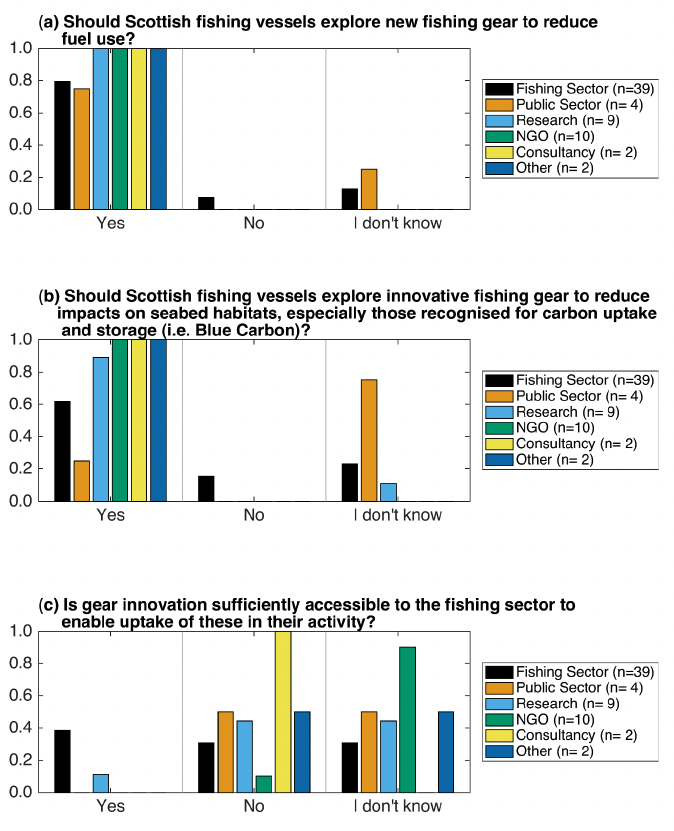
Summary of respondent answers to Questions 11 to 19 for all respondents, and for industry representatives (i.e., vessel owner/skipper, producer's organisation, processor, fishing association, coalition). See also Figures 7, 8 and 9.
| Question Number |
Question |
ALL |
ALL |
ALL |
FISH |
FISH |
FISH |
|---|---|---|---|---|---|---|---|
| 11 |
Should alternative fuels, other than marine diesel, be explored for Scottish fishing vessels? |
77.3% |
3.0% |
19.7% |
74.4%† |
2.6%† |
23.1%† |
| 12 |
If you own/operate a fishing vessel, have you considered using alternative fuels / modifying your fishing method / modifying your fishing gear in order to reduce emissions? |
34.8%‡ |
30.3%‡ |
34.8%‡ |
53.8%‡ |
33.3%‡ |
12.8%‡ |
| 13 |
Should Scottish fishing vessels consider alternative behaviours for fishing to reduce fuel use? Examples could include more seasonal effort, effort reductions or different spatial distribution of activity. |
68.2% |
21.2% |
10.6% |
56.4% |
28.2% |
15.4% |
| 14 |
Should Scottish fishing vessels explore new fishing gear to reduce fuel use? Examples could be changes to doors, nets, and weights. |
86.4% |
4.5% |
9.1% |
79.5% |
7.7% |
12.8% |
| 15 |
Should Scottish fishing vessels explore innovative fishing gear to reduce impacts on seabed habitats, especially those recognised for carbon uptake and storage (i.e. Blue Carbon)? |
71.2% |
9.1% |
19.7% |
61.5% |
15.4% |
23.1% |
| 16 |
Is gear innovation sufficiently accessible to the fishing sector to enable uptake of these in their activity? |
24.2%‡ |
33.3%‡ |
42.4%‡ |
38.5%† |
30.8%† |
30.8%† |
| 17 |
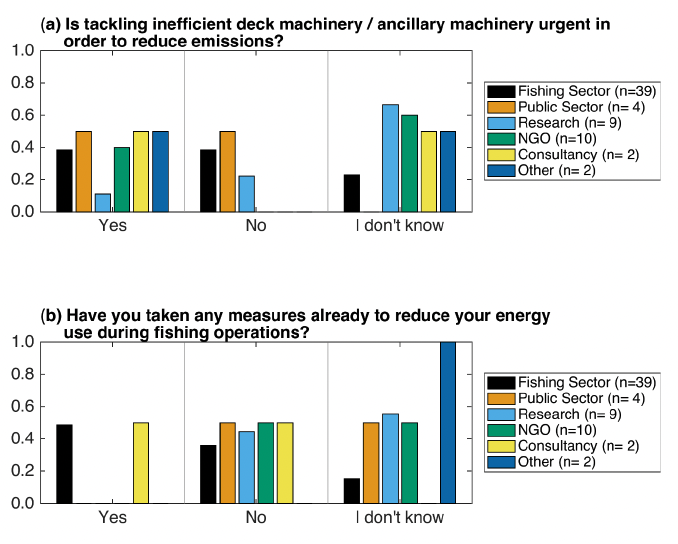
Is tackling inefficient deck machinery / ancillary machinery urgent in order to reduce emissions? |
36.4% |
28.8% |
34.8% |
38.5%† |
38.5%† |
23.1%† |
| 18 |
Have you taken any measures already to reduce your energy use during fishing operations (for example, using refrigerants which have a lower environmental impact, or any other measures)? |
30.3% |
39.4% |
30.3% |
48.7% |
35.9% |
15.4% |
| 19 |
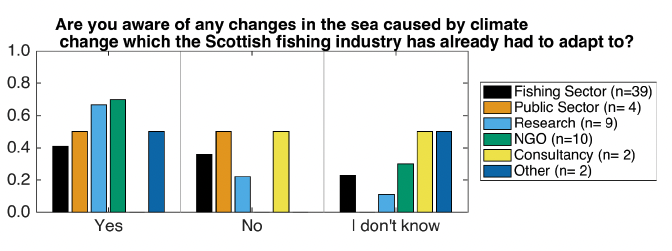
Are you aware of any changes in the sea caused by climate change which the Scottish fishing industry has already had to adapt to (i.e. make changes to reduce the negative impact, or to benefit from emerging opportunities)? |
48.5% |
28.8% |
22.7% |
41.0% |
34.9% |
23.1% |
‡ due to rounding, the total is 99.9%
† due to rounding, the total is 100.1%
Table 7
Summary of alternative fuels and propulsion systems mentioned by respondents in answer to the question "What alternative fuels should be considered?"
| Alternative Fuel/Engine |
Response Number |
Response Percentage |
|---|---|---|
| Hydrogen |
32 |
48.5% |
| Electric |
13 |
19.7% |
| Hybrid |
11 |
16.7% |
| Biofuels (including biodiesel, bio-alcohol) |
11 |
16.7% |
| Renewable |
3 |
4.5% |
| LNG (including hybrid) |
3 |
4.5% |
| Diesel Electric |
2 |
3.0% |
| Hybrid Diesel |
1 |
1.5% |
| Sail |
1 |
1.5% |
| Solar |
1 |
1.5% |
| Provided a response |
39 |
59.1% |
| No response |
27 |
40.9% |
Table 8
Summary themes of perceived barriers mentioned by respondents in answer to the question "What are the main barriers to using alternative fuels?"
| Perceived Barrier |
Response Number |
Response Percentage |
|---|---|---|
| cost |
13 |
19.7% |
| bunkering |
10 |
15.2% |
| unproven technology |
10 |
15.2% |
| infrastructure |
8 |
12.1% |
| safety |
7 |
10.6% |
| cost of retrofit |
6 |
9.1% |
| change in attitude/behaviour |
5 |
7.6% |
| lack of viable alternatives |
5 |
7.6% |
| funding |
4 |
6.1% |
| lack of space |
3 |
4.5% |
| lack of expertise |
2 |
3.0% |
| Remoteness |
2 |
3.0% |
| incentive |
1 |
1.5% |
| compatibility with current |
1 |
1.5% |
| concern of viability |
1 |
1.5% |
| concerns on data collection |
1 |
1.5% |
| cost of fuel |
1 |
1.5% |
| cost of replacement |
1 |
1.5% |
| duty cycle impact |
1 |
1.5% |
| efficiency |
1 |
1.5% |
| finance |
1 |
1.5% |
| holistic view across supply chain |
1 |
1.5% |
| impact on profitability |
1 |
1.5% |
| just transition principles |
1 |
1.5% |
| lack of information |
1 |
1.5% |
| lack of investment |
1 |
1.5% |
| need to retrofit |
1 |
1.5% |
| practicality |
1 |
1.5% |
| vessel capacity |
1 |
1.5% |
| will be driven by engine manufacturers |
1 |
1.5% |
| Provided a response |
45 |
68.1% |
| No response |
21 |
31.8% |
(a) Survey respondents by category for all participants (n=66)
(b) Survey respondents fleet representation for fishing industry (n=39)
© Crown copyright 2022
Marine Scotland Science
Marine Laboratory
375 Victoria Road
Aberdeen
AB11 9DB
Copies of this report are available from the Marine Scotland website at
Contact
Email: marinescotland@gov.scot