
Fair Work Action Plan: indicator report 2026
Report setting out the most recent data available for the Fair Work Action Plan's (FWAP) medium-term indicators. These are used to monitor progress towards the outcomes set out in the FWAP.
4. Fair Work is embedded in the public sector
Key findings
- The Scottish Government continues to provide significant employment opportunities for women, with the proportion of women at senior levels increasing over time and accounting for a larger proportion of Senior Civil Servants in 2025.
- The mean pay gap for disabled people employed by the Scottish Government has narrowed between 2022 and 2025, while the mean pay gap for minority ethnic groups has widened during the same period. The mean gender pay gap narrowed slightly between 2022 and 2025. Median pay gaps have been more variable for all groups.
Available indicators
- Scottish Government employment composition
- Scottish Government pay gaps
- Scottish Government vertical segregation
- College and university employment composition
- Public sector employment composition
4.1 Scottish Government employment composition
This indicator is measured using the Public Sector Equality Duty (PSED) monitoring data published in the Scottish Government workforce: diversity and inclusion statistics.[2], [3] The data below covers staff working in core Scottish Government directorate generals, some agencies and some non-ministerial departments.[4]
Impact on Fair Work: Contribution
Overall, there has been an increase in the proportion of the workforce who were female, disabled or from a racial minority between 2022 and 2025.
Sex
The proportion of female employees employed by the Scottish Government was 57.3% in 2025 and has remained consistent since 2022 as shown in Figure 1. This is higher than the proportion of Scotland’s population aged 16-64 who are female, which has remained close to 51% during the same period.
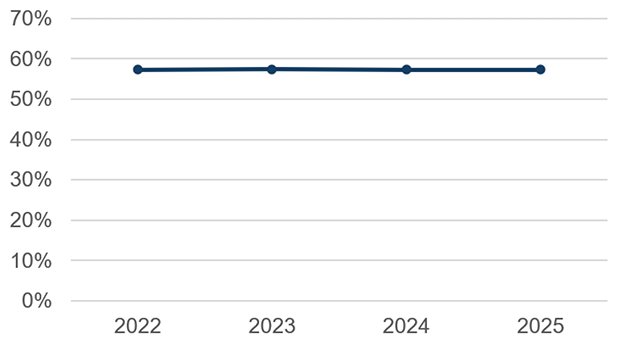
The proportion of female employees in the Scottish Government has stayed consistent
Source: Scottish Government workforce: diversity and inclusion statistics, 2022-2025, The Scottish Government
While the proportion of female employees in the Scottish Government has remained the same in 2022 and 2025, this has not been uniform across all staff Bands[5]. The proportion of female Band A staff has decreased from 57.7% in 2022 to 56.0% in .2025, and the proportion of female Band C staff has also decreased to 55.9% in 2025 from 57.5% in 2022. However, the proportion of female Band B staff has increased slightly from 58.3% in 2022 to 58.5% in 2025.[6]
Disability
Figure 2 shows that in 2025, disabled staff made up 19.8% of employees within the Scottish Government, an increase from 14.7% in 2022.
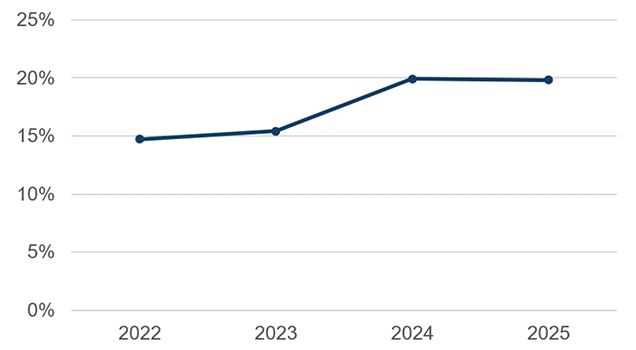
The proportion of disabled employees in the Scottish Government has increased
Source: Scottish Government workforce: diversity and inclusion statistics, 2022-2025, The Scottish Government
The proportion of disabled employees in the Scottish Government has increased across all bands since 2022. The proportion of disabled Band A staff in 2025 was 24.5% (up from 19.9% in 2022), with the proportion of disabled Band B staff (up from 15.2% in 2022 to 20.6% in 2025). Data for band C is not available for 2025 for confidentiality reason, however the proportion of disabled Band C staff increased from 10.9% in 2022 to 15.4% in 2024.
Ethnicity
Ethnic minorities accounted for 5.7% of Scottish Government employees in 2025, an increase from 4.1% in 2022, shown in Figure 3.
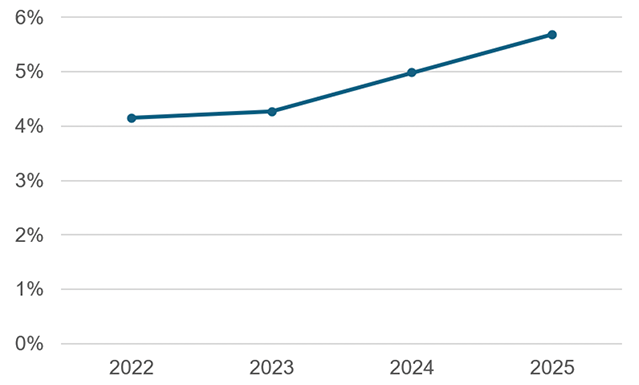
The proportion of ethnic minority employees in the Scottish Government has increased
Source: Scottish Government workforce: diversity and inclusion statistics, 2022-2025, The Scottish Government
The proportion of ethnic minority employees in the Scottish Government has increased across Band A and B since 2022. In 2025 ethnic minority employees accounted for 9.4% of Band A staff (up from 5.4% in 2022), and 5.7% of Band B staff (up from 4.4% in 2022). Data for the proportion of ethnic minority Band C staff in recent years is not available for confidentiality reasons.
4.2 Scottish Government pay gaps
This indicator is measured using the Public Sector Equality Duty (PSED) monitoring data published in the Scottish Government workforce: diversity and inclusion statistics.[7], [8]
Impact on Fair Work: Contribution
Pay gap analysis calculates the difference between average full-time equivalent earnings for specified groups. These calculations compare earnings for groups where protected characteristics have been declared. Both mean and median pay gaps are presented below.
As outlined in the Pay gap information - Equality duties: pay gap report 2025 the mean is the Scottish Government preferred method and is derived by summing the values for a given sample and then dividing the sum by the number of observations in the sample. The mean can be disproportionately influenced by a relatively small number of high-paying jobs but ensures that all staff are represented in the statistical analysis.
The median is the value below which 50% of observations fall and is less affected by a relatively small number of very high earners and any skewed distribution of earnings. A higher level of median pay gap compared to the mean pay gap reflects that new staff to the grade start at the minimum of the pay range and progress through their pay range, annually by one pay step, until they reach the maximum for their grade. Therefore, the median salary is subject to large fluctuations on a year-by-year basis depending on which step the ‘middle’ person falls into.
Sex
The mean gender pay gap within the Scottish Government was 3.1% in 2022 and narrowed to 2.8% in 2025. The median gender pay gap narrowed from 6.3% in 2022 to 5.8% in 2025, as shown in Figure 4.
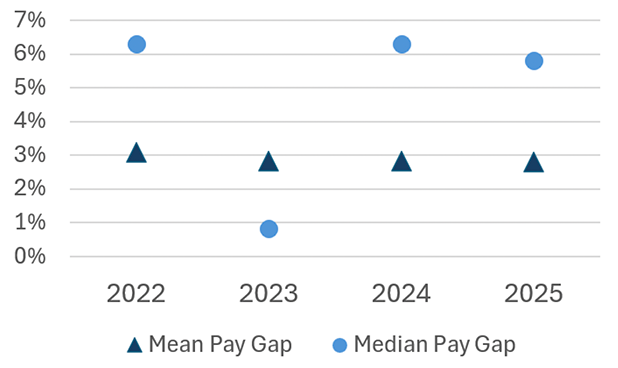
The mean gender pay gap has stayed consistent while there was a dip in the median gender pay gap in 2023
Source: Scottish Government workforce: diversity and inclusion statistics, 2022-2025, The Scottish Government
Disability
The mean disability pay gap was 9.5% in 2022 and narrowed to 7.7% in 2025, shown in Figure 5. However, the median disability pay gap widened from 8.5% in 2022 to 10.2% in 2025.
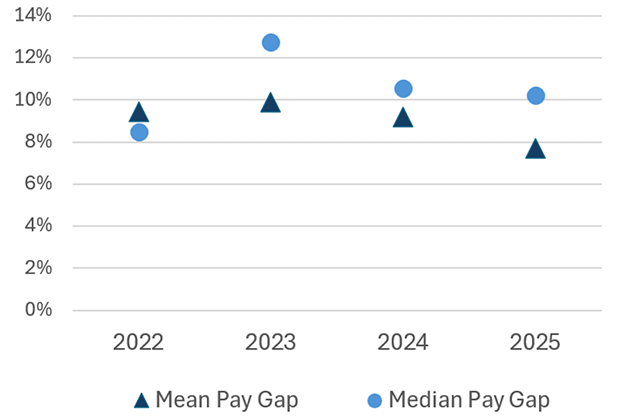
The mean disability pay gap has narrowed while the median disability pay gap has widened
Source: Scottish Government workforce: diversity and inclusion statistics, 2022-2025, The Scottish Government
Ethnicity
The mean ethnicity pay gap in the Scottish Government was 9.8% in 2022, and widened to 11.1% in 2025, as shown in Figure 6. The median ethnicity pay gap widened from 5.3% in 2022 to 9.3% in 2025.
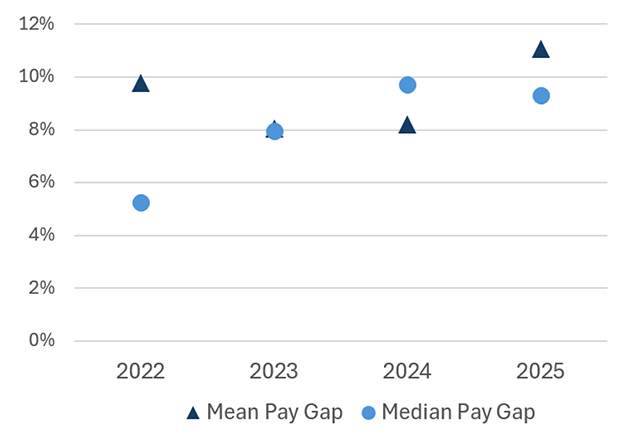
The mean and median ethnicity pay gaps have both widened between 2022 and 2025
Source: Scottish Government workforce: diversity and inclusion statistics, 2022-2025, The Scottish Government
4.3 Scottish Government vertical segregation
This indicator is measured using the Public Sector Equality Duty (PSED) monitoring data published in the Scottish Government workforce: diversity and inclusion statistics.[9] Data on sex is gathered during the recruitment process and covers SG core staff, some agencies and some non-ministerial departments.
Impact on Fair Work: Contribution
The number of women in the Senior Civil Service (SCS) has increased over the course of 2021 to 2025 as seen in Figure 7. The proportion of women in the SCS was lower than the proportion of men between 2021 to 2023, however this reversed in 2024 and 2025.
In 2021, 107 members of the SCS were women, representing 49.3% of the SCS. The number of females in the SCS increased to 156 (51.3%) in 2025, greater than the number of males (148).
Data for disability and ethnicity is suppressed and not available for inclusion for Scottish Government vertical segregation.
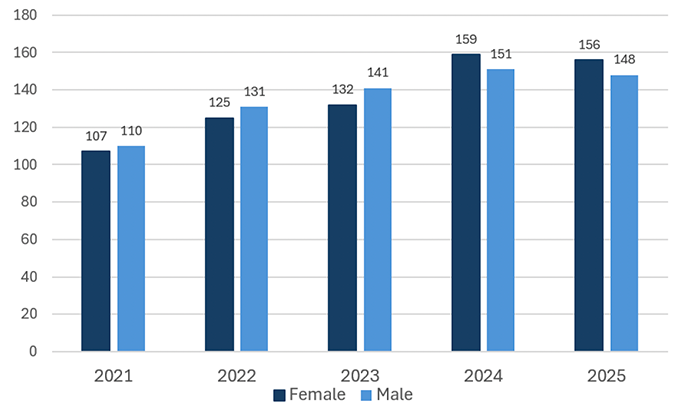
The number of women in the SCS has increased and the proportion is greater than that of males in 2025
Source: Scottish Government workforce: diversity and inclusion statistics, 2021-2025, The Scottish Government
4.4 College and university employment composition
Higher and Further Education provision is split across colleges and universities in Scotland. This indicator is therefore measured using the Scottish Funding Council’s College Staffing Data 2024/25 for information on colleges and Higher Education Staff Statistics: UK, 2024/25 | HESA universities.
The information presented in this section relates to academic year.
Impact on Fair Work: Contribution
Sex
Between 2014/15 and 2024/25, the proportion of college staff that are female has stayed broadly constant.
While the proportion of female to male employees remains larger, there has been a 1.1 percentage point decrease in female staff from 2019/20, when the proportion was highest, to 60.5% in 2024/25, Figure 8.
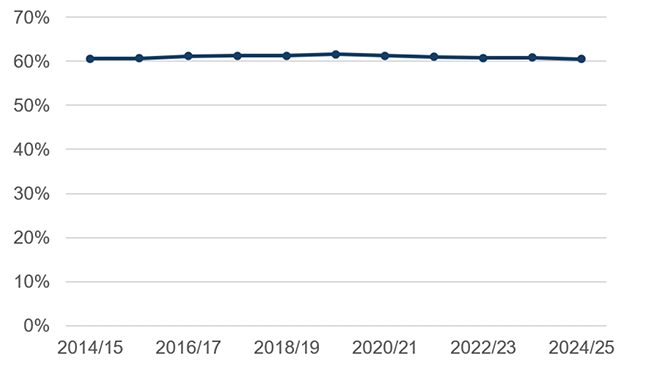
The proportion of female college employees has stayed broadly constant from 2014/15 to 2025/26
Source: College staffing data 2024/25, Scottish Funding Council
The proportion of the university workforce that are female has stayed broadly constant between 2014/15 to 2024/25 as shown in Figure 9.
The percentage of the workforce who are female has increased by 1.1 percentage points from 54.5% (2014/15) to 55.6% (2024/25). The lowest proportion of female workers during this time period was in 2015/16 where 54.4% of the workforce were female.
The proportion of female employees in the university workforce has stayed broadly constant from 2014/15 to 2024/25
Source: Higher Education Statistics Agency (HESA) staff data, 2024/25, HESA
Ethnicity
Figure 10 shows the percentage of the college workforce from a minority ethnic background increased from 2.1% in 2017/18 to 3.0% in 2024/25. Following a small decrease between 2018/19 and 2019/20, the percentage of minority ethnic staff has increased yearly between 2019/20 and 2024/25.
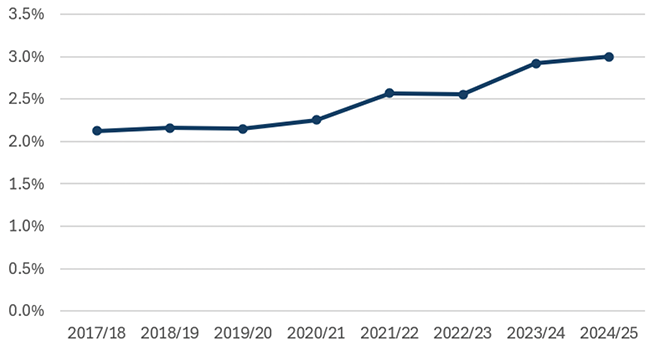
The proportion of minority ethnic employees in colleges has increased from 2017/18 to 2024/25
Source: College staffing data 2024/25, Scottish Funding Council
The percentage of minority ethnic employees in the university workforce has increased from 6.8% in 2014/15 to 14.1% in 2024/25, an increase of 7.3 percentage points, shown in Figure 11.
The proportion of each minority ethnic group within the university workforce has also increased during this period. The largest increase was for Asian employees from 4.1% in 2014/15 to 8.5% in 2024/25, an increase of 4.4 percentage points. The Black minority group increased by 1.0 percentage point, the Mixed group by 1.2 percentage points, and the ‘Other’ group by 0.7 percentage points since 2014/15.
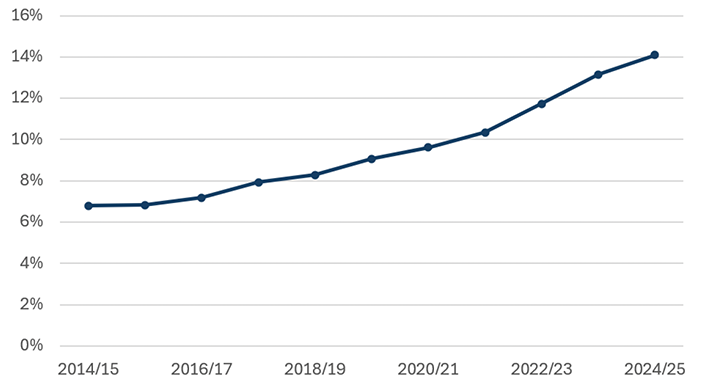
The proportion of minority ethnic employees in the university workforce has been increasing yearly from 2014/15 to 2024/25
Source: Higher Education Statistics Agency (HESA) staff data, 2024/25, HESA
Disability
In the 2017/18 academic year the proportion of the college workforce with a declared disability was 5.9%, rising to 8% in 2024/25. The percentage of staff with a declared disability has increased yearly between 2017/18 and 2024/25, as shown in Figure 12, with the exception of 2022/23 where there was a small drop from the previous academic year.
While the proportion has increased, the number of staff with a declared disability has fallen between 2021/22 to 2024/25 (from 1,080 to 1,010 members of staff).
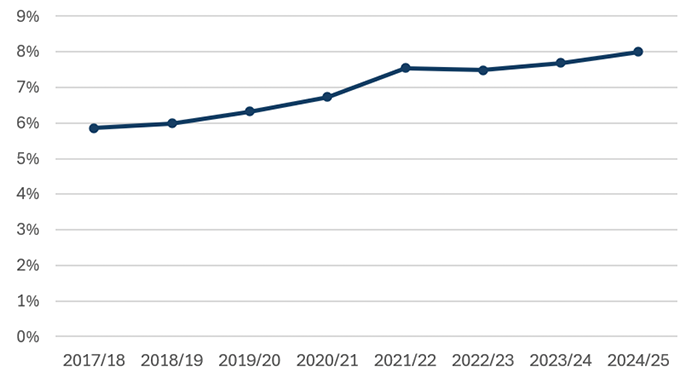
The proportion of disabled employees in the college workforce has increased between 2017/18 and 2024/25
Source: College staffing data 2017/18 to 2024/25, Scottish Funding Council
Figure 13 shows that the proportion of the university workforce who are disabled has increased from 3.3% in 2014/15 to 7.7% in 2024/25.
The largest proportion of the workforce who were disabled in the university workforce was in 2021/2022 at 8.5%. The following year there was a 2.6 percentage point drop to 5.9%, likely due to the COVID-19 pandemic.
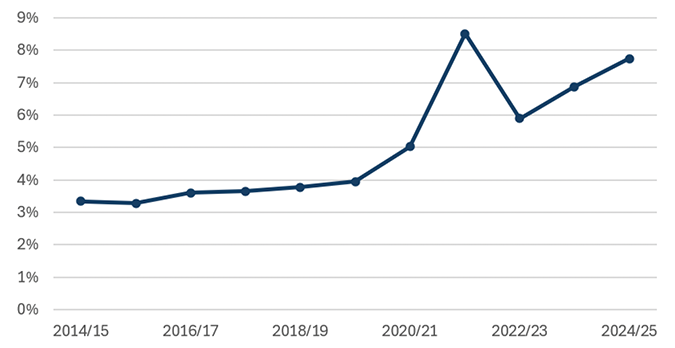
The proportion of disabled workers in the university workforce has increased since 2014/15, apart from a decrease in 2022/23 due to COVID-19
Source: Higher Education Statistics Agency (HESA) staff data, 2024/25, HESA
4.5 Public Sector Employment Composition
The official source of employment in the public sector is the Quarterly Public Sector Employment series (QPSE). As at June 2026, there were 603,800 people employed in the public sector in Scotland, accounting for 23.0% of total employment.
The public sector comprises central government, local government, and public corporations as defined for the UK National Accounts. The Sector Classifications Guide provides information on the classification of organisations and institutions in the National Accounts.[10]
Information on the personal characteristics of those employed in the public sector is not gathered as part of this collection. However, the ONS Annual Population Survey can be used to provide estimates of the composition of the public sector. Note that the ONS Annual Population Survey tends to overestimate the level of employment in the public sector due to self-reporting. However, it can be used to provide estimates for the characteristics of people employed in the public sector.
Breakdowns of public sector employment by disability and ethnicity are not available from the ONS Annual Population Survey due to data quality issues. While not directly comparable, data for disability and ethnicity is available for 2022 from Scotland’s Census for the Public administration, education and health. This has been presented here in the absence of data from the ONS Annual Population Survey. Where Census data has been used it considers those aged 16 and over, who are employed (employees or self-employed) in the Public administration, Education and Health sector.
As no new data is available on public sector employment by disability and ethnicity that section remains the same as published in the Fair Work Action Plan: indicator report 2025.
Impact on Fair Work: Contribution
Sex
ONS Annual Population Survey data for January to December 2025 estimated that 65.2% of those aged 16 and over in employment in the public sector were women. This proportion has increased from 63.3% in 2004 but has decreased from 67.0% in 2018, the highest proportion in the January to December time series, as shown in Figure 14.
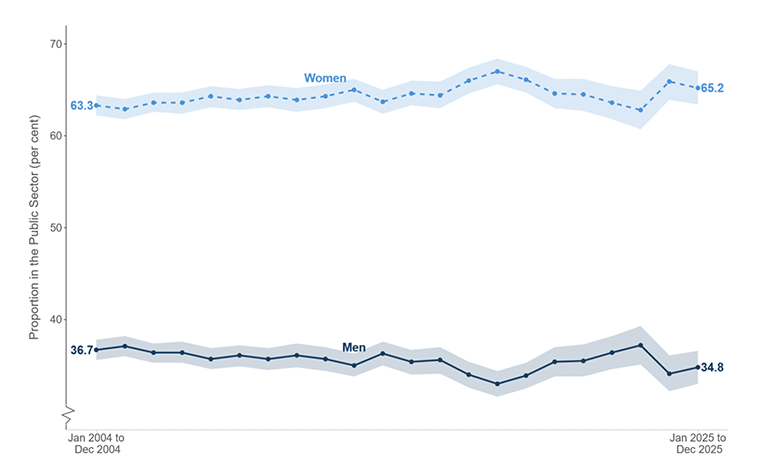
There has been an increase in the proportion of women employed in the public sector since 2004 however it has decreased between 2018 and 2025
Source: Annual Population Survey, January to December datasets, ONS
Shaded areas represent 95% confidence intervals around the estimates.
ONS Annual Population Survey data for January to December 2025 estimated that 37.1% of women in employment aged 16 and over were employed in the public sector, as shown in Figure 15. The estimated proportion of men in employment aged 16 and over who were employed in the public sector was 19.2%.
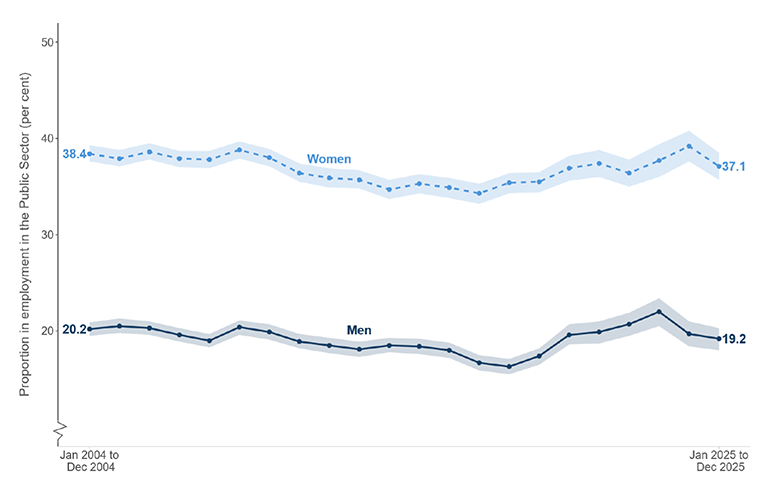
There had been a gradual decrease in the proportion of women in employment who are employed in the public sector. However, it has typically been increasing since 2017, the lowest point in the series
Source: Annual Population Survey, January to December datasets, ONS
Shaded areas represent 95% confidence intervals around the estimates.
Disability
Scotland’s Census 2022 shows that 86.1% of those aged 16 and over, who are employed in the Public administration, Education and Health sector, were non-disabled (around 728,500 people). The Census shows that 13.9% of those employed in the Public administration, Education and Health sector were disabled. Of those who were disabled 19.7% indicated that their day to day activities are limited a lot and 80.3% saying they were limited a little.[11]
Ethnicity
The majority of the Public administration, Education and Health sector are from white groups (94.2%). Of those from white groups, 82.0% were White Scottish, 11.4% were Other White British, and 6.6% were Other White.
The ethnic group with the next largest proportion is Asian (Asian, Asian Scottish or Asian British) representing 2.9% of the Public administration, Education and Health sector, followed by African, African Scottish or African British (1.3%), mixed or multiple ethnicities (0.8%), Other ethnic group (0.7%) and Caribbean or Black (0.1%) as shown in Figure 16.
In the Scottish working population (those in employment aged 16 and over), 93.8% are from white groups, compared to 94.2% in the Public administration, Education and Health sector. Minority ethnic groups account for 6.2% of the Scottish working population. Whilst minority ethnic groups accounted for 5.8% of the Public administration, education and health sector in 2022.
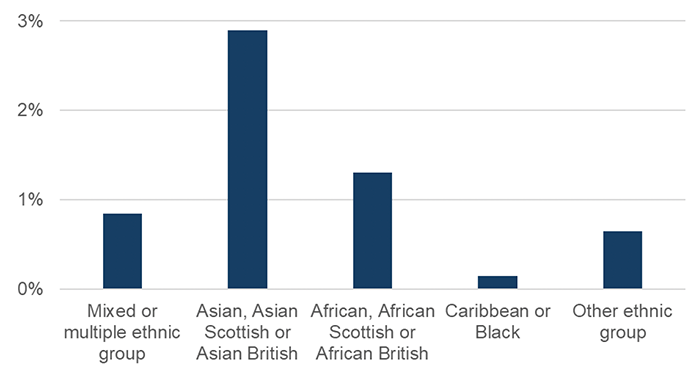
Minority ethnic groups accounted for 5.8% of people employed in the Public administration, education and health sector in 2022
Source: Scotland Census 2022, National Records of Scotland
Individual organisations within the public sector
There is no centrally available source for the characteristics of those in employment within each individual public sector body. However, information from Public Sector Employment in Scotland Statistics and NHS Scotland Workforce Statistics provide an insight into the gender split of the two largest sectors within the devolved public sector.[12] Both of these organisations are predominantly female with data for June 2026 showing that 73.5% of individuals employed in local government[13] were female and data for June 2026 showing that 78.6% of NHS employees were female[14]. Although variations will be seen in these proportions when different occupations are examined. For example, the NHS Workforce Statistics highlights that 49.5% of staff in ambulance support services are female compared with 89.7% of staff in nursing and midwifery.