Publication - Research and analysis
Shared equity schemes: evaluation reports
Reports on the evaluation of shared equity schemes.
Annex: Supplementary figures and tables
Chapter 3: Housing market context
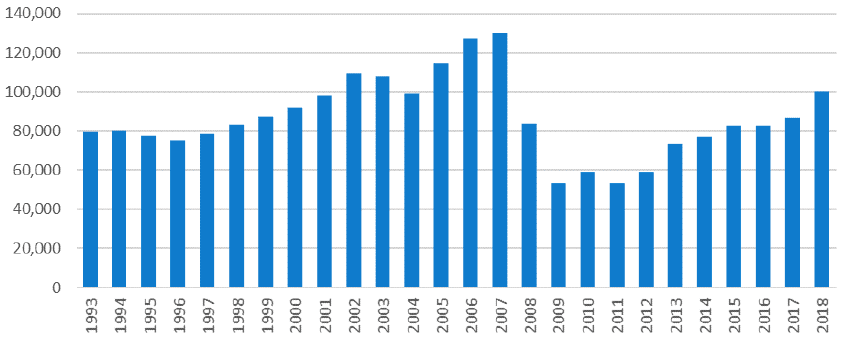
Source: ROS 2019 accessed NOV 2019 via SG Open Access
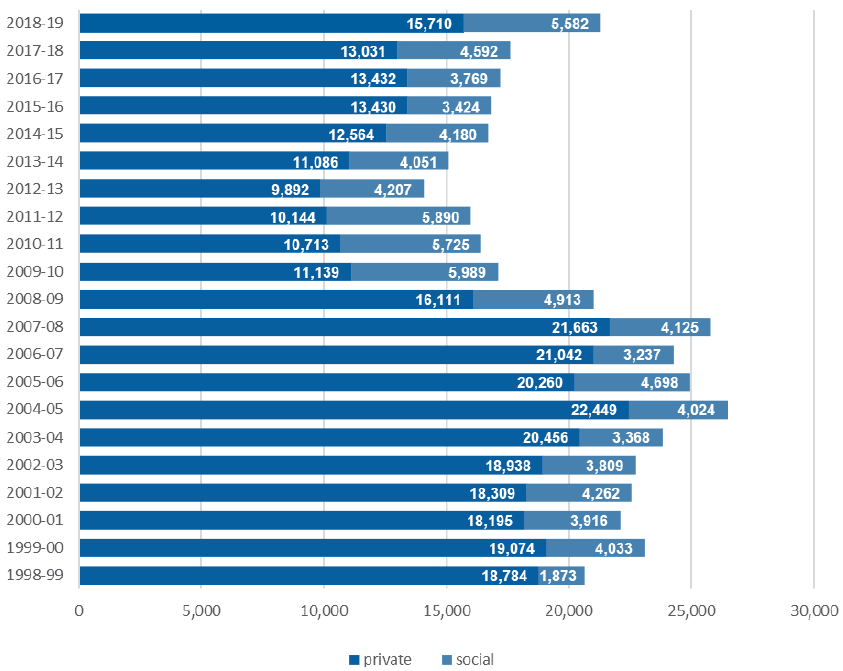
Source: Scottish Government (2019) Housing Completions updated September 2019
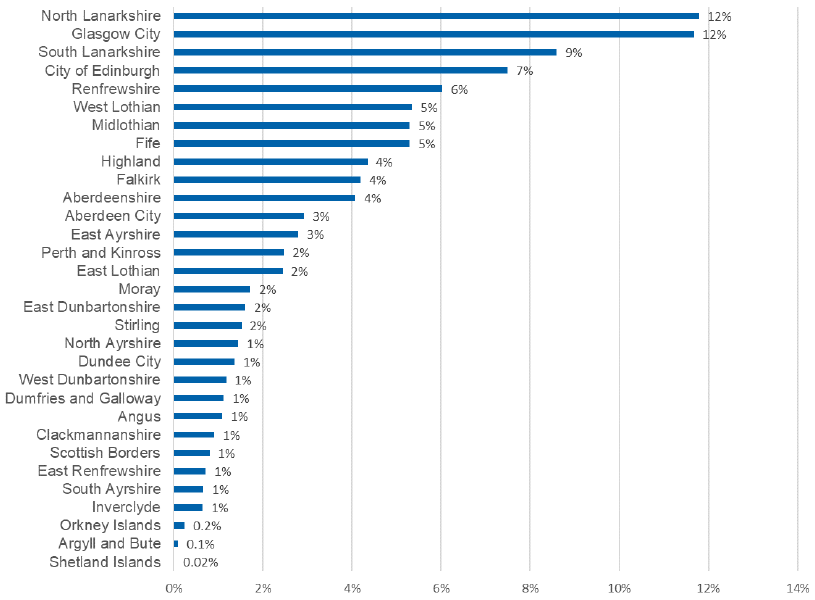
Source: Scottish Government HtB administrative records.
| Rank | Company (grouped) | Sales | % of all HtB |
|---|---|---|---|
| 1 | Persimmon Homes Limited | 3,320 | 20.8% |
| 2 | Taylor Wimpey UK Limited | 2,211 | 13.8% |
| 3 | BDW Trading Limited (Barratt) | 1,830 | 11.4% |
| 4 | Bellway Homes Limited | 1,090 | 6.8% |
| 5 | Miller Homes Limited | 754 | 4.7% |
| 6 | Springfield Properties | 474 | 3.0% |
| 7 | Tulloch Homes Limited | 370 | 2.3% |
| 8 | Keepmoat Homes Limited | 341 | 2.1% |
| 9 | Cruden | 299 | 1.9% |
| 10 | Ogilvie Homes Limited | 294 | 1.8% |
| 11 | Stewart Milne Group Limited | 294 | 1.8% |
| 12 | Avant Homes (Scotland) Ltd | 288 | 1.8% |
| 13 | Dundas Estates and Development Company Limited | 250 | 1.6% |
| 14 | Scotia Homes Limited | 220 | 1.4% |
| 15 | Muir Homes Limited | 199 | 1.2% |
| 16 | MacTaggart & Mickel Homes Limited | 182 | 1.1% |
| 17 | Robertson Homes Limited | 179 | 1.1% |
| 18 | Barratt Homes Limited | 167 | 1.0% |
| 19 | Walker Group Limited | 162 | 1.0% |
| 20 | Bett Homes Limited | 152 | 1.0% |
Source: Scottish Government HtB administrative records.
Chapter 5: Buyers' experience of shared equity schemes
| Strongly agree | Tend to agree | Neither/ nor | Tend to disagree | Strongly disagree | Don't know | Base | |
|---|---|---|---|---|---|---|---|
| I would have been able to buy a property I wanted anyway without the scheme | 4% | 14% | 9% | 28% | 45% | 1% | 2197 |
| I would still have bought a newly-built property without the scheme | 7% | 16% | 14% | 26% | 34% | 4% | 2195 |
| The scheme meant I could buy a property sooner than I otherwise would have | 59% | 25% | 9% | 4% | 3% | 1% | 2200 |
| The scheme meant I could buy a larger property than I could without assistance | 48% | 24% | 16% | 7% | 4% | 2% | 2196 |
| The scheme meant I could buy a property in a better area than I could without assistance | 34% | 24% | 27% | 9% | 5% | 2% | 2195 |
| The scheme meant I could buy in my preferred location | 34% | 27% | 26% | 8% | 4% | 1% | 2192 |
| I would not have been able to buy any property without the scheme | 16% | 15% | 13% | 26% | 27% | 3% | 2201 |
| Without shared equity, would you still have been able to buy… | Definitely | Probably | Probably not | Definitely not | Don't know | Base |
|---|---|---|---|---|---|---|
| …the same property? | 3% | 15% | 39% | 41% | 2% | 2149 |
| …a similar property that was not new build? | 7% | 37% | 34% | 18% | 4% | 2152 |
| …a similar property in a less convenient or desirable area? | 12% | 49% | 23% | 9% | 7% | 2162 |
| …a smaller property that was still suitable for your needs? | 19% | 51% | 19% | 7% | 4% | 2162 |
| …a cheaper property that was still suitable for your needs? | 23% | 51% | 18% | 5% | 4% | 2160 |
| Strongly agree | Tend to agree | Neither/ nor | Tend to disagree | Strongly disagree | Don't know | Base | |
|---|---|---|---|---|---|---|---|
| I would have been able to buy a property I wanted anyway without the scheme | 4% | 10% | 11% | 19% | 52% | 5% | 121 |
| I would still have bought a newly-built property without the scheme | 6% | 8% | 14% | 17% | 48% | 6% | 121 |
| I wouldn't have considered buying from a social landlord without the scheme | 19% | 27% | 24% | 10% | 10% | 10% | 120 |
| The scheme meant I could buy a property sooner than I otherwise would have | 55% | 23% | 11% | 6% | 2% | 3% | 119 |
| The scheme meant I could buy a larger property than I could without assistance | 36% | 25% | 18% | 12% | 6% | 4% | 121 |
| The scheme meant I could buy a property in a better area than I could without assistance | 28% | 20% | 31% | 8% | 11% | 3% | 121 |
| The scheme meant I could buy in my preferred location | 29% | 19% | 33% | 11% | 5% | 3% | 121 |
| I would not have been able to buy any property without the scheme | 35% | 19% | 15% | 18% | 9% | 5% | 121 |
| Without shared equity, would you still have been able to buy… | Definitely | Probably | Probably not | Definitely not | Don't know | Base |
|---|---|---|---|---|---|---|
| …the same property? | 2% | 15% | 28% | 53% | 2% | 121 |
| …a similar property that was not new build? | 3% | 28% | 32% | 31% | 6% | 117 |
| …a similar property in a less convenient or desirable area? | 10% | 36% | 25% | 20% | 10% | 119 |
| …a smaller property that was still suitable for your needs? | 11% | 38% | 29% | 15% | 7% | 119 |
| …a cheaper property that was still suitable for your needs? | 12% | 41% | 26% | 15% | 6% | 120 |
| Strongly agree | Tend to agree | Neither/ nor | Tend to disagree | Strongly disagree | Don't know | Base | |
|---|---|---|---|---|---|---|---|
| I would have been able to buy a property I wanted anyway without the scheme | 6% | 7% | 7% | 21% | 56% | 3% | 1040 |
| The scheme meant I could buy a property sooner than I otherwise would have | 73% | 18% | 5% | 2% | 2% | 1% | 1041 |
| The scheme meant I could buy a larger property than I could without assistance | 45% | 20% | 19% | 7% | 6% | 4% | 1041 |
| The scheme meant I could buy a property in a better area than I could without assistance | 33% | 19% | 27% | 11% | 6% | 4% | 1038 |
| The scheme meant I could buy in my preferred location | 30% | 24% | 25% | 11% | 8% | 3% | 1039 |
| I would not have been able to buy any property without the scheme | 44% | 24% | 11% | 11% | 7% | 3% | 1042 |
| Without shared equity, would you still have been able to buy… | Definitely | Probably | Probably not | Definitely not | Don't know | Base |
|---|---|---|---|---|---|---|
| …the same property? | 4% | 15% | 36% | 42% | 3% | 1006 |
| …a similar property in a less convenient or desirable area? | 6% | 30% | 34% | 22% | 8% | 1024 |
| …a smaller property that was still suitable for your needs? | 7% | 34% | 32% | 21% | 6% | 1023 |
| …a cheaper property that was still suitable for your needs? | 7% | 35% | 30% | 21% | 7% | 1024 |
Chapter 8: Assessing additionality
| Additionality rate | % of additional buyers | % of non-additional buyers | |
|---|---|---|---|
| Shared equity scheme | |||
| Help to Buy | 20% | 100% | 100% |
| NSSE | - | - | - |
| OMSE | - | - | - |
| First-time buyers | |||
| First-time buyer | 22% | 66% | 64% |
| Existing owner | 21% | 34% | 36% |
| Age of respondent | |||
| Under 30 | 17% | 20% | 25% |
| 30-34 | 20% | 25% | 26% |
| 35-39 | 22% | 24% | 22% |
| 40-44 | 23% | 15% | 13% |
| 45+ | 23% | 16% | 14% |
| Household type | |||
| 1 adult, no children | 21% | 26% | 26% |
| 1 adult, with children | 30% | 9% | 6% |
| 2 adults, no children | 18% | 30% | 36% |
| 2 adults, with children | 22% | 32% | 29% |
| Other | 18% | 3% | 4% |
| Tenure prior to buying | |||
| With parent/relative | 17% | 21% | 29% |
| Social renting | 29% | 11% | 8% |
| Private renting | 26% | 42% | 33% |
| Owner occupier | 19% | 22% | 27% |
| Other | 20% | 4% | 4% |
| Household income | |||
| Up to £20,000 | 16% | 1% | 2% |
| £20,001 to £30,000 | 23% | 20% | 17% |
| £30,001 to £40,000 | 23% | 32% | 27% |
| £40,001 to £50,000 | 20% | 24% | 25% |
| More than £50,000 | 16% | 22% | 29% |
| Purchase price | |||
| Under £100,000 | 22% | 1% | 2% |
| £100,000-149,999 | 18% | 21% | 66% |
| £150,000-199,999 | 16% | 48% | 170% |
| £200,000 or more | 19% | 29% | 86% |
| Property type bought | |||
| House | 21% | 83% | 85% |
| Flat | 24% | 16% | 14% |
| Other | 33% | 1% | 1% |
| Property size bought | |||
| 1 or 2 bedrooms | 25% | 28% | 24% |
| 3 bedrooms | 21% | 50% | 52% |
| 4+ bedrooms | 20% | 22% | 25% |
| Additionality rate | % of additional buyers | % of non-additional buyers | |
|---|---|---|---|
| Shared equity scheme | |||
| Help to Buy | - | - | - |
| NSSE | 39% | 11% | 14% |
| OMSE | 47% | 89% | 86% |
| First-time buyers | |||
| First-time buyer | 48% | 91% | 93% |
| Existing owner | 56% | 9% | 6% |
| Age of respondent | |||
| Under 30 | 44% | 21% | 25% |
| 30-34 | 46% | 23% | 25% |
| 35-39 | 49% | 22% | 22% |
| 40-44 | 51% | 15% | 14% |
| 45+ | 58% | 19% | 3% |
| Household type | |||
| 1 adult, no children | 50% | 34% | 33% |
| 1 adult, with children | 51% | 14% | 13% |
| 2 adults, no children | 44% | 14% | 18% |
| 2 adults, with children | 48% | 31% | 32% |
| Other | 60% | 6% | 4% |
| Tenure prior to buying | |||
| With parent/relative | 44% | 19% | 23% |
| Social renting | 56% | 24% | 18% |
| Private renting | 49% | 49% | 50% |
| Owner occupier | 48% | 2% | 2% |
| Other | 45% | 6% | 7% |
| Household income | |||
| Up to £20,000 | 53% | 34% | 28% |
| £20,001 to £30,000 | 44% | 39% | 46% |
| £30,001 to £40,000 | 51% | 20% | 18% |
| £40,001 to £50,000 | 49% | 6% | 6% |
| More than £50,000 | 44% | 2% | 2% |
| Purchase price | |||
| Under £100,000 | 40% | 22% | 23% |
| £100,000-149,999 | 39% | 57% | 62% |
| £150,000-199,999 | 48% | 17% | 13% |
| £200,000 or more | 61% | 4% | 2% |
| Property type bought | |||
| House | 48% | 58% | 60% |
| Flat | 49% | 35% | 35% |
| Other | 57% | 8% | 6% |
| Property size bought | |||
| 1 or 2 bedrooms | 48% | 54% | 56% |
| 3 bedrooms | 47% | 36% | 39% |
| 4+ bedrooms | 58% | 9% | 6% |
Contact
Email: socialresearch@gov.scot