Establishing a Scottish Nitrogen Balance Sheet
This report sets out the main findings from the initial version of the Scottish Nitrogen Balance Sheet. Establishing a whole-economy Nitrogen Balance Sheet is a requirement under the Climate Change (Emissions Reduction Targets) (Scotland) Act 2019.
Annex B – Regional scale results
As part of the initial phase of the SNBS, additional technical work was commissioned by the Scottish Government on regional freshwater nitrogen budgets for Scotland[42]. This has estimated, using the freshwater model ‘LTLS-FM’, hydrological nitrogen flows during 2010 for 10 regions delineated under the Water Framework Directive, as Sub-Basin Districts/Area Advisory Group boundaries (as shown in Figure 3).
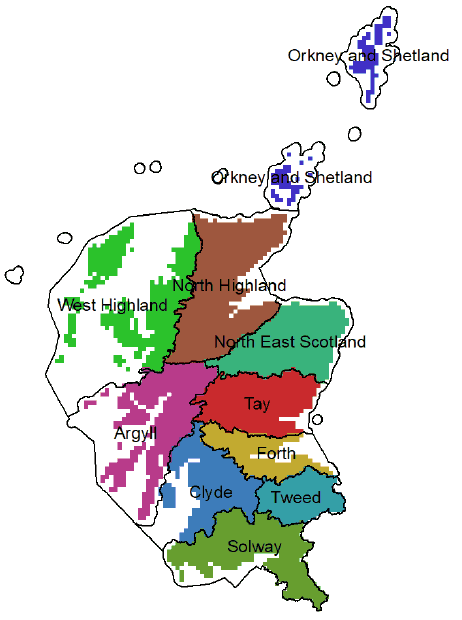
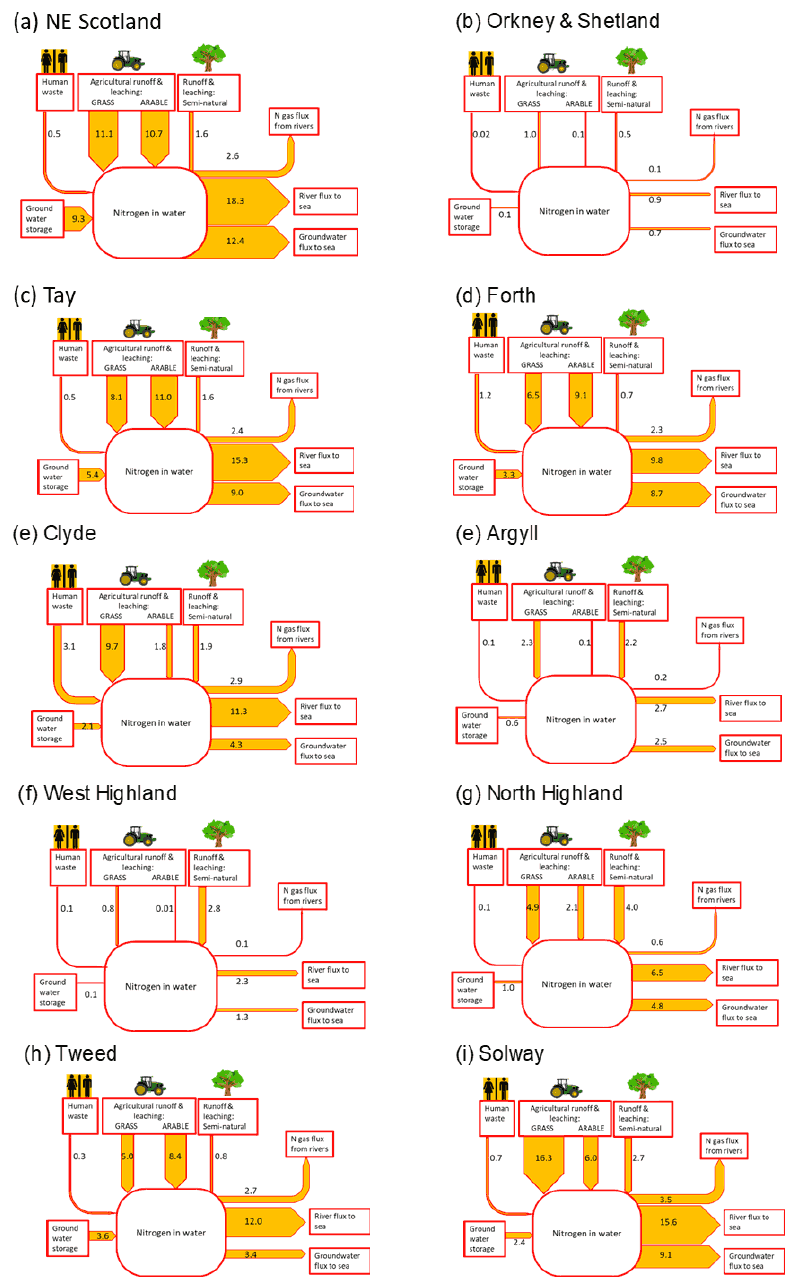
These regional N budgets quantify key hydrological flows across agricultural and semi-natural systems, including nitrogen from human waste and atmospheric deposition, and show the relative importance of different flow terms across different regions. This type of analysis can help inform land use policy development as to key hydrological nitrogen loss pathways for each region, integrated across agriculture, human settlements etc.
The results are summarised in Figure 4 and indicate that total N inputs vary substantially between regions, from 1.7 kt N / yr for Orkney and Shetland to 33.2 kt N / yr for NE Scotland. However, if N inputs are divided by the area of the region, it becomes apparent that two of the smallest regions, Tweed and Forth, have the highest N inputs / km2. The total (i.e. national) estimated losses of freshwater N to coastal waters were 151 kt N / yr (with up to 68% of these flows originating in agricultural land management) and those to the atmosphere were 17.3 kt N / yr, with more than half of the N losses originating from just 3 regions (Tay, Solway and NE Scotland) [43].
Contact
Email: climatechangeplan@gov.scot