Domestic abuse: statistics recorded by the Police in Scotland - 2020/21
Characteristics of victims and perpetrators of domestic abuse incidents recorded by the police in Scotland in 2020 to 2021.
Part of
2. Domestic abuse incidents in Scotland
All tables referred to below are available in the 'Supporting Documents' Excel workbook for this bulletin. The workbook includes an 'Introduction' sheet, with information on how to navigate the tables, alongside a 'Notes' sheet, with relevant details to assist users when reading and interpreting results.
2.1. Incidents of domestic abuse
The police recorded 65,251 incidents of domestic abuse in 2020-21, an increase of 4% compared to the previous year (Figure 1 & Table 1). This is the fifth year in a row this figure has shown an increase.
Of the 65,251 incidents of domestic abuse recorded by the police in 2020-21, 40% (25,825) included the recording of at least one crime or offence[7], in line with the figure in 2019-20 (also at 40%) (Figure 1 & Table 1). The remaining 60% (39,426) did not include the recording of a crime or offence. Section 2.3 provides information on incidents which do not include a crime or offence.
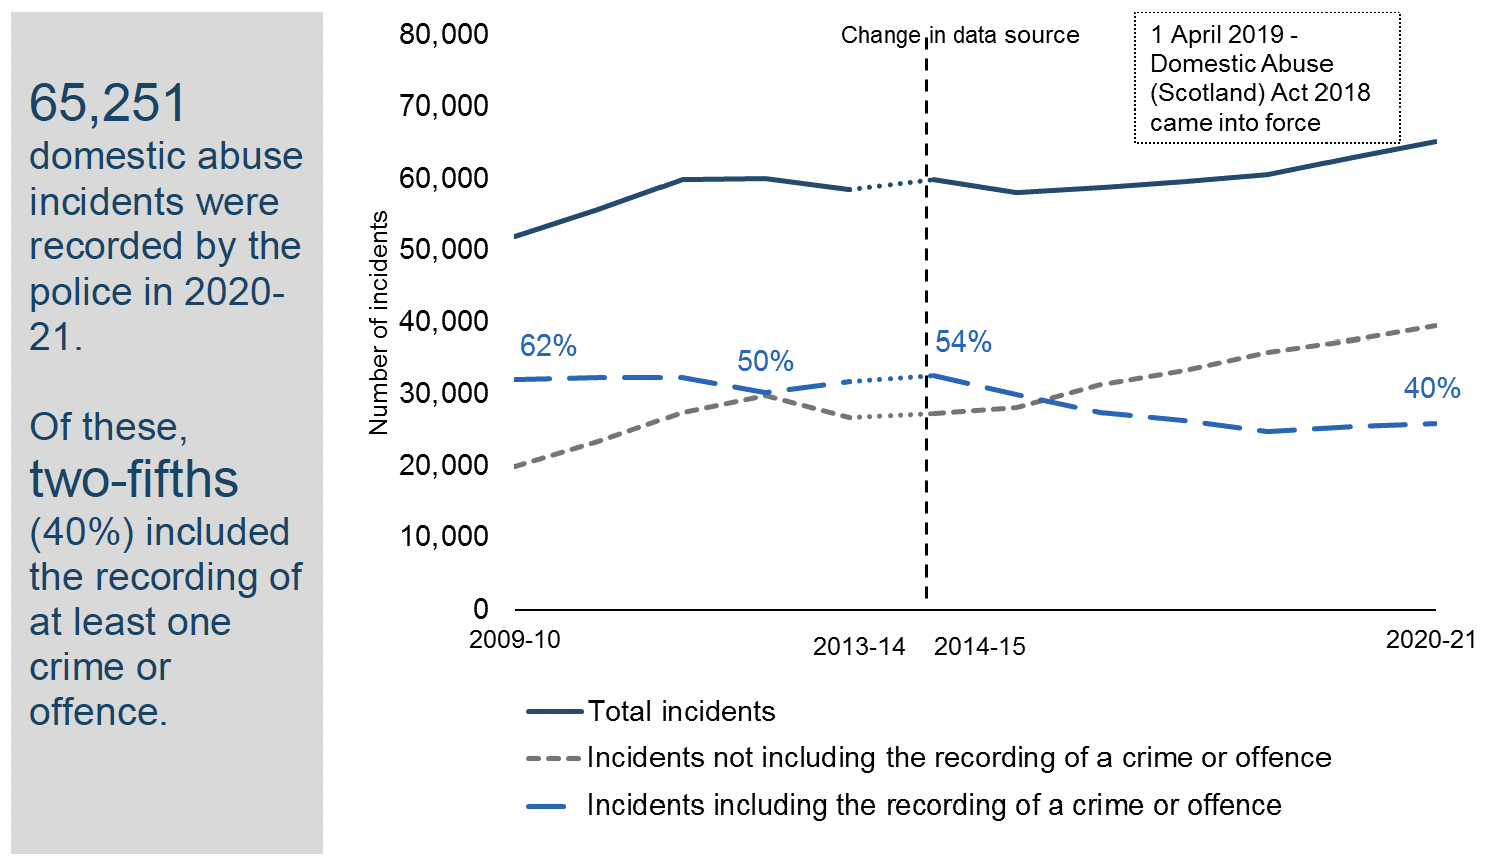
Note: See Annex 2 for information on the change in data source between 2013-14 and 2014-15.
2.2. Incidents which included a crime or offence
For those domestic abuse incidents that included the recording of at least one crime or offence in 2020-21, the most frequently recorded was Common assault, accounting for 32% of all crimes and offences. This was followed by Breach of the peace etc., which accounted for 23% of all crimes and offences. Breach of the peace etc. includes Threatening or abusive behaviour and Stalking (22% and 2% of all crimes and offences respectively) (Figure 2 & Table 2).
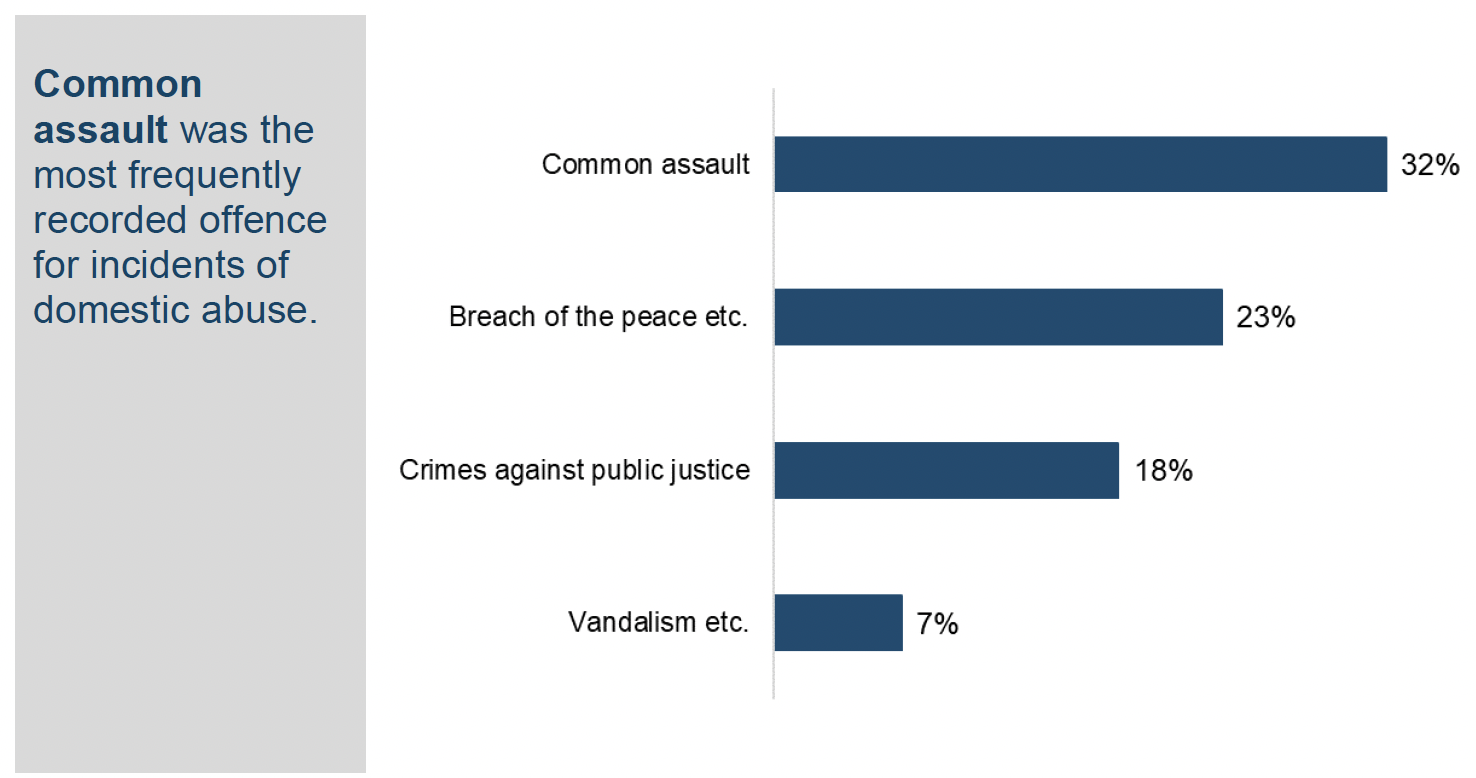
Note: An incident can have multiple crimes associated with it.
Following the enactment of the Domestic Abuse (Scotland) Act 2018 on 1 April 2019, crimes recorded under the Act accounted for 4% of crimes and offences recorded as part of a domestic abuse incident in 2020-21. This was the same proportion of crimes and offences in 2019-20. These amounted to 1,384 crimes recorded under the Act in 2020-21.
Section 1.2 on statistical impact provides further information on how crimes and offences might have changed due to the introduction of the Domestic Abuse (Scotland) Act 2018. Table 16 in the 'Supporting Documents' Excel workbook provides details on the characteristics of these incidents.
2.3. Incidents which did not include a crime or offence
In 2020-21, 60% of domestic abuse incidents within the interim Vulnerable Persons Database (iVPD) did not include the recording of at least one crime or offence. This reflects the definition of domestic abuse used by Police Scotland, which is not restricted to behaviour where criminal conduct has been identified and recorded.
The iVPD itself is not a crime recording system. Instead, it aims to collate disparate pieces of information about incidents into a single file, allowing officers to build a narrative about people who have reported or been involved in an incident with a domestic abuse element.
A previous review of a sample of non-criminal domestic abuse incidents found that around half of these were based on some form of argument between partners or ex-partners, which did not have any reference to a physical confrontation or threatening behaviour. Around one-in-five were based on concern about the communication or attempted communication of one partner or ex-partner towards the other (excluding any reference to an argument or a specific crime or offence). The other cases cover a diverse range of situations. Further information on this review is provided in Section 5.7.
2.4. Incidents of domestic abuse by local authority
The number of police recorded domestic abuse incidents varied at the local authority level. Between 2019-20 and 2020-21, around two-thirds (20) of local authorities recorded an increase in domestic abuse incidents, whereas a third (12) recorded a decrease (Table 3).
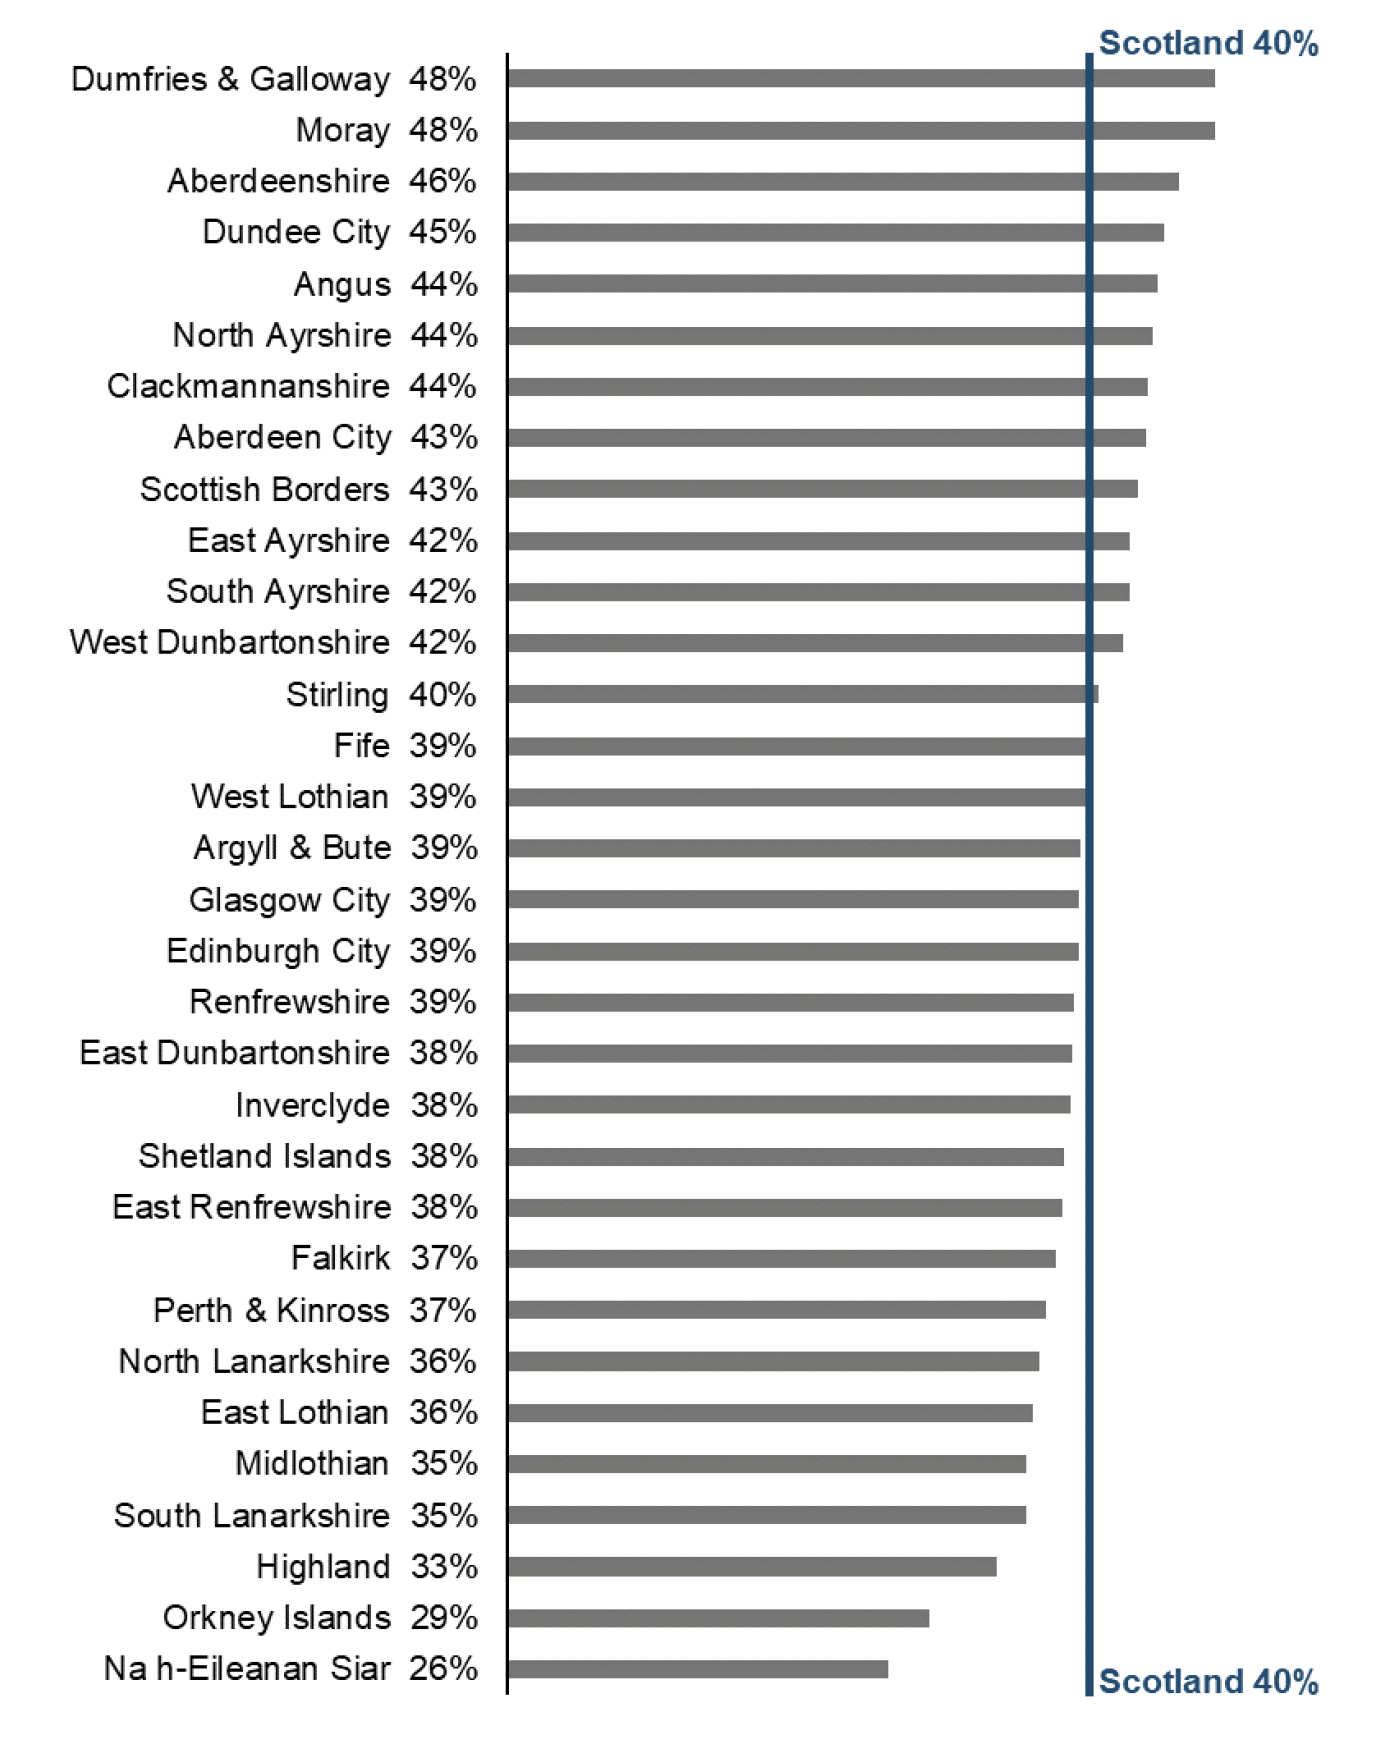
In 2020-21, the highest percentages of incidents of domestic abuse that also included the recording of at least one crime or offence were in Dumfries & Galloway and Moray (both at 48%), whilst the lowest were in Na h-Eileanan Siar (26%), Orkney Islands (29%) and Highland (33%) (Figure 3 & Table 4).
2.5. Incidents of domestic abuse per 10,000 population
Taking the population of Scotland as at mid-year 2020, there were 119 recorded incidents of domestic abuse per 10,000 population in 2020-21. At a local authority level, Dundee City (177), West Dunbartonshire (168) and Clackmannanshire (158) recorded the highest incident rates per 10,000 population. Na h-Eileanan Siar (48), Orkney Islands (51) and East Renfrewshire (56) recorded the lowest rates per 10,000 population. (Figure 4 & Table 5).
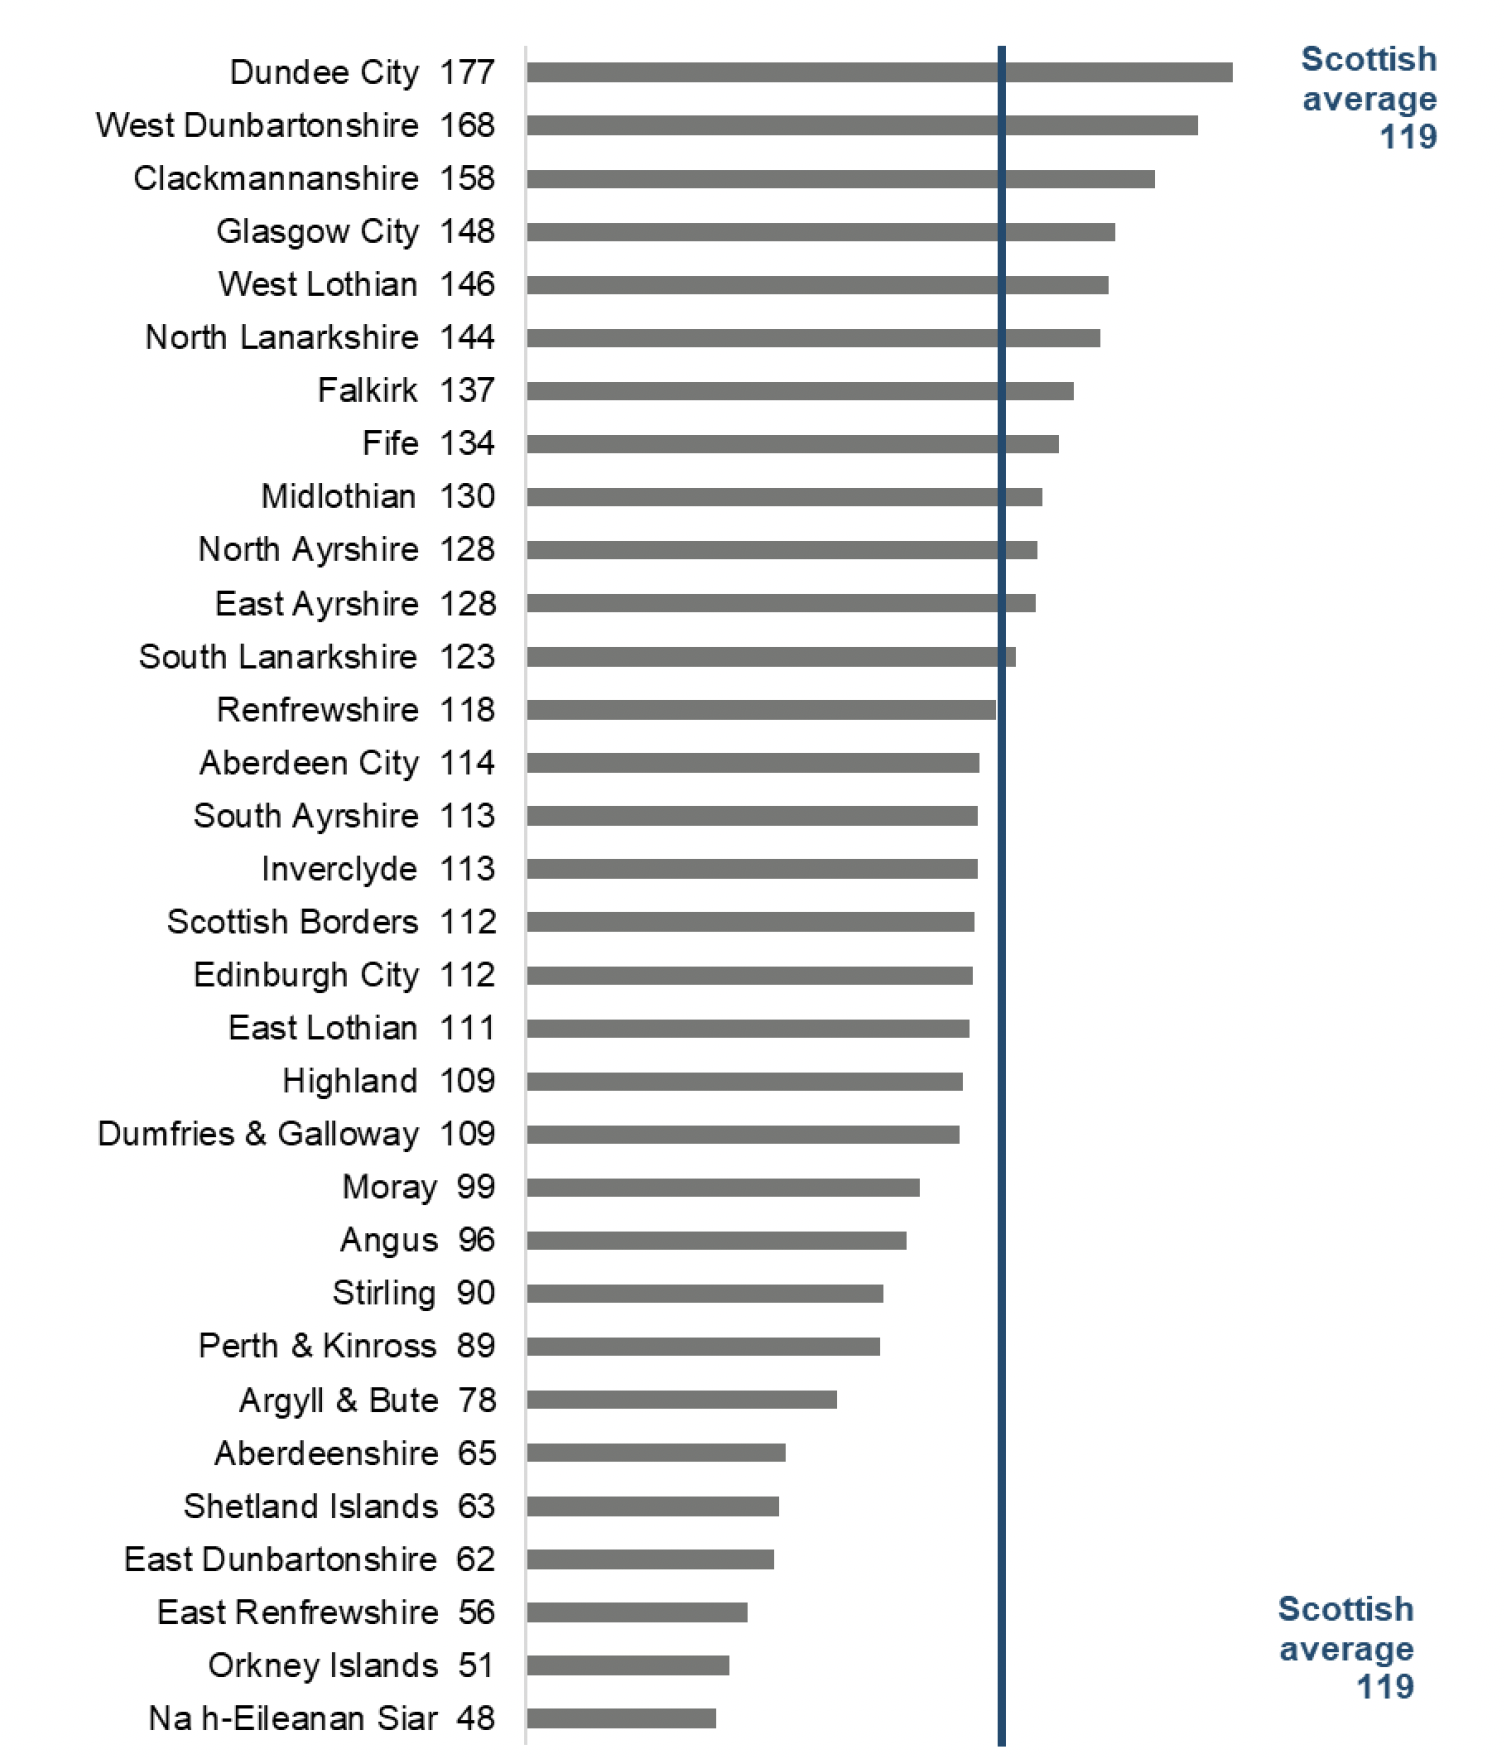
Note: Population estimates are at mid-year 2020 published by the National Records of Scotland.
Characteristics of victim and accused
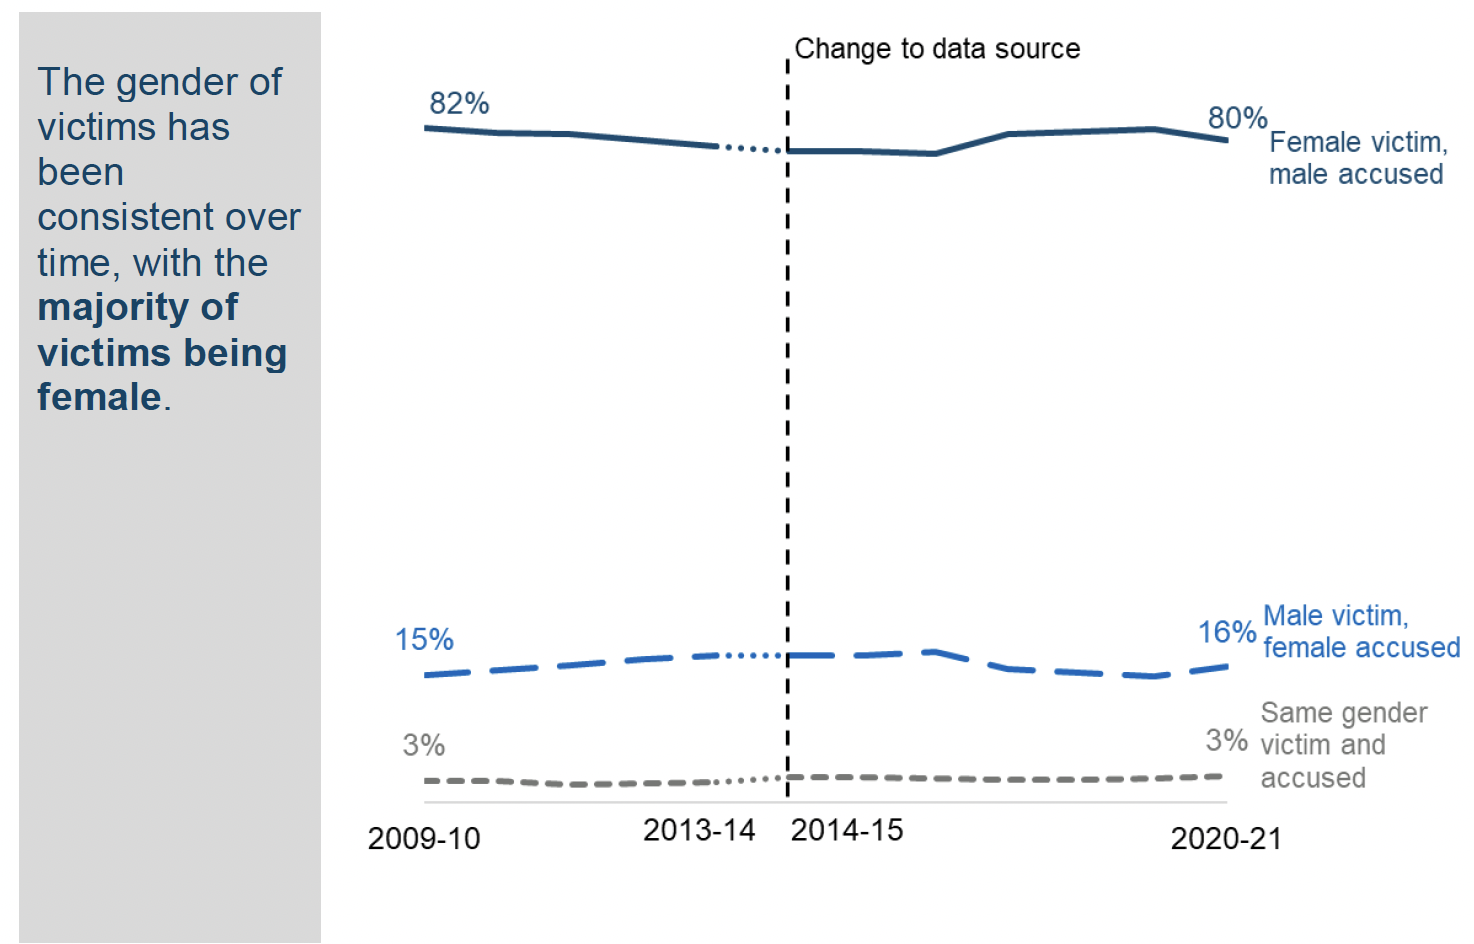
- Gender: 80% of incidents involved a female victim and a male accused. 16% of incidents involved a male victim and a female accused. In the remaining 3% of cases, victim and accused were the same gender
- Relationship: half (50%) of incidents were between current partners (49% between ex partners, and less than 1% was classed ad ‘other’ relationship)
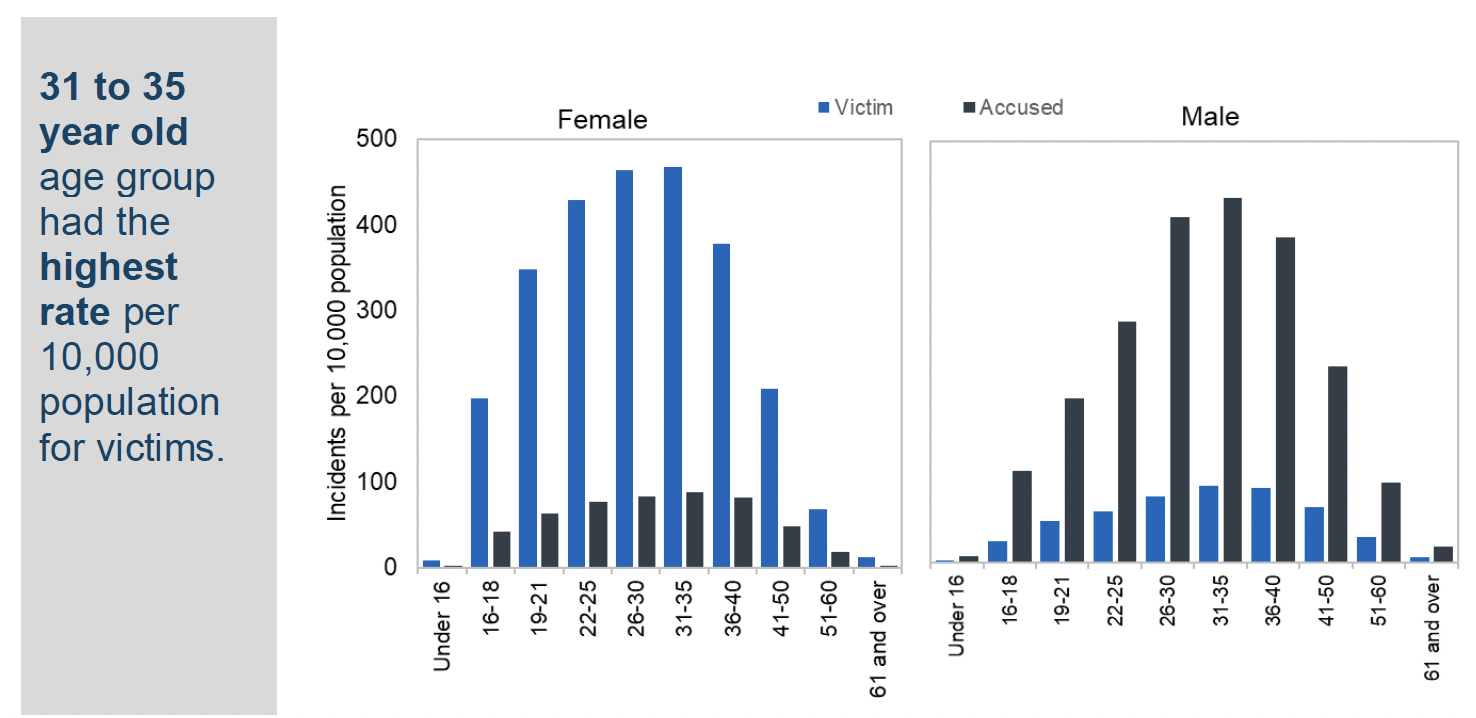
- Age: people aged 31 to 35 years old had the highest rate per 10,000 population for both victims and accused.
Note: Current partner is defined here as spouse/civil partner, partner and co-habitee. Ex-partner is defined as ex-spouse/civil partner and ex-partner.
2.6. Gender of victim & accused
Where the victim's gender was known, the clear majority of victims in 2020-21 (82%) were female. Four-in-five incidents (80%) of domestic abuse in 2020-21 had a female victim and a male accused. This decreased slightly from 82% in 2019-20.
Again, where the victim's gender was known, 18% of victims in 2020-21 were male. In 2020-21, 16% of domestic abuse incidents involved a male victim and a female accused. This increased slightly from 15% in 2019-20.
In the remaining 3% of domestic abuse incidents, the victim and accused were the same gender. This figure has remained stable over several years (Figure 5 & Table 6).
1 The figure only displays incidents where gender of victim and accused is known. See Annex 4 for more details on missing data.
Note:See Annex 2 for information on the change in data source between 2013-14 and 2014-15.
2.7. Relationship between victim & accused
In 2020-21 half (50%) of domestic abuse incidents, where the relationship[8] between the victim and accused was known[9], were between current partners. Just under half (49%) of incidents were between ex-partners. For the remaining 1% of incidents, the relationship was categorised as 'Other' (Table 7).
2.8. Age of victim & accused
In 2020-21, the 31 to 35 year old age group had the highest rate per 10,000 population for victims (282 incidents recorded per 10,000 population) (Table 8).
Female victims aged 31 to 35 had the highest rate (467) of incidents of domestic abuse recorded by the police per 10,000 population. 31 to 35 was also the age group with the highest rate of incidents of domestic abuse recorded per 10,000 population for male victims (92) (Figure 6 & Table 8).
In 2020-21, the 31 to 35 years old age group also had the highest incident rate per 10,000 population for those accused (260 incidents recorded per 10,000 population) (Table 9).
The 31 to 35 year old age group had the highest rate of domestic abuse among both male accused (434 incidents recorded per 10,000 population) and female accused (88 incidents recorded per 10,000 population) (Figure 6 & Table 9).
1 The figure only displays incidents where gender of victim and accused is known. See Annex 4 for more details on missing data.
Note: Population estimates are at mid-year 2020 published by the National Records of Scotland.
2.9. Victim & accused repeat analysis
The iVPD enables the identification of a victim or accused that has previously been entered into the system for domestic abuse. A victim or accused can appear multiple times in the database in any one year, each classified as a separate incident.
As the iVPD was introduced and rolled out across the then 14 police divisions during 2013-14, the first and any subsequent reference to any victim or accused in the repeat categories below only refers to whether they were involved in an incident of domestic abuse from 2013-14 (part year depending on divisional roll out[10]) and not in any years prior to the introduction of the iVPD.
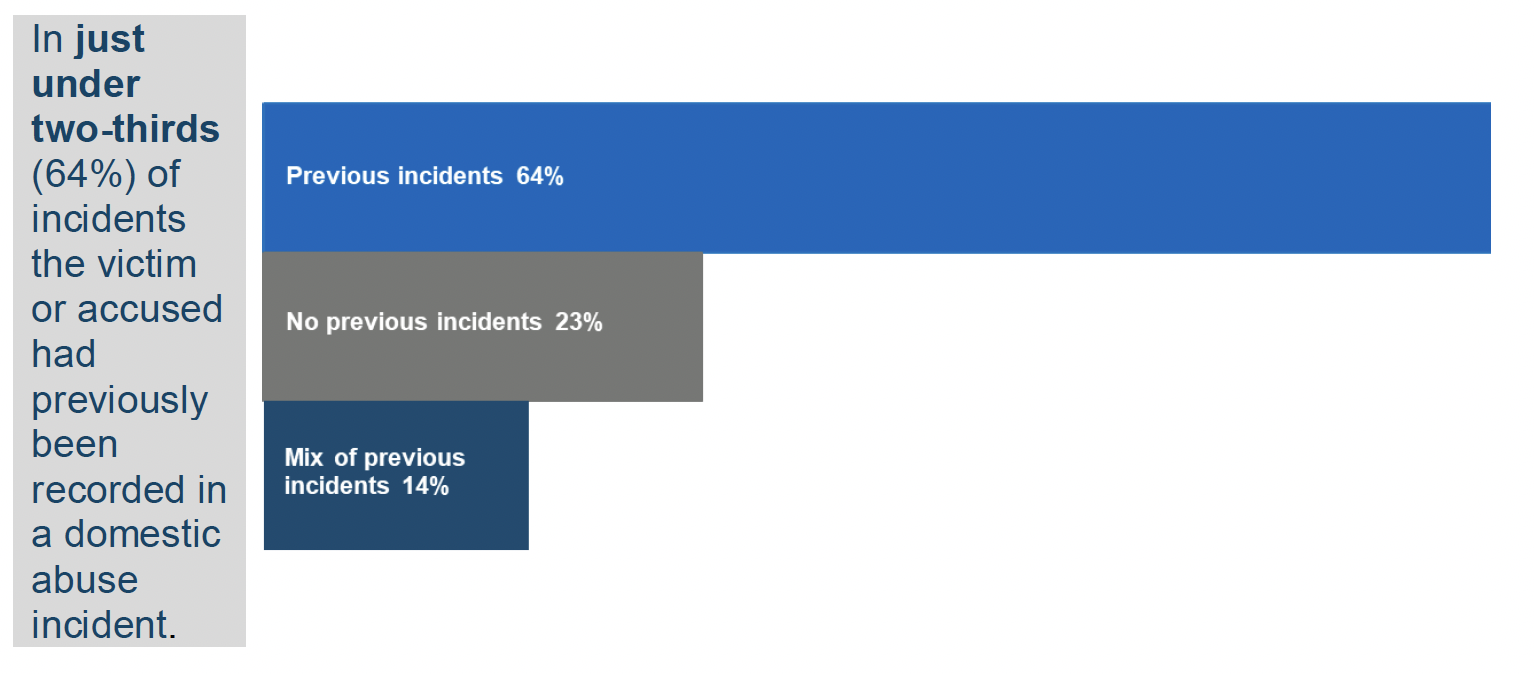
In 2020-21 there were 50,369 domestic abuse incidents with sufficient information recorded[11] to allow repeat analysis (77% of all incidents). The remaining 14,882 incidents (or 23%) did not include sufficient information to confirm one way or the other whether at least one of either the victim or accused had previously been recorded in an incident of domestic abuse.
For those incidents that did include sufficient information, 64% (or 32,149) had a victim and accused who had previously been recorded in an incident of domestic abuse – though these previously recorded incidents may have involved different partners/ex-partners. In a further 23% (11,355) of incidents, neither the victim nor the accused were found in the iVPD. In 14% (6,865) of incidents there was a mix of results for the victim and accused (i.e. only one of the victim or accused had previously been recorded) (Figure 7 & Table 10).
2.10. Location of incidents
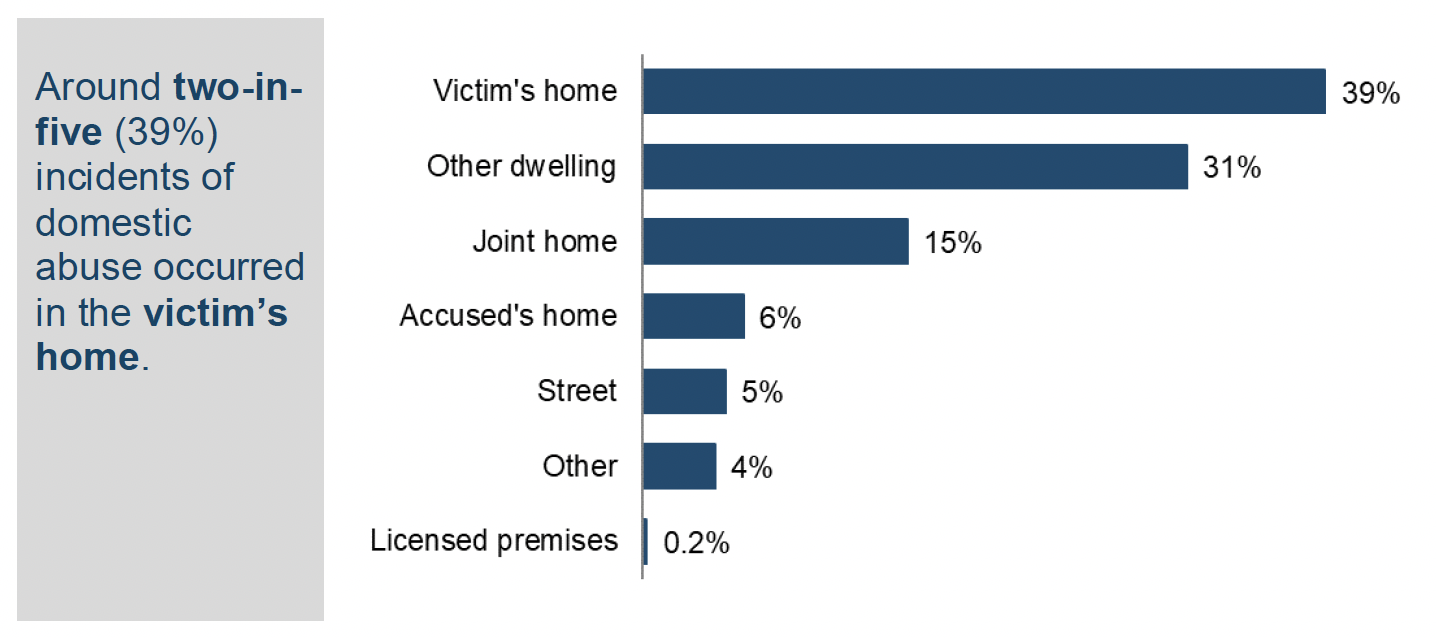
In 2020-21, around nine-in-ten (91%) domestic abuse incidents occurred in a home or dwelling. This is a slight increase compared to 2019-20 (88%). This figure can be split into 39% of incidents that occurred within the victim's own home, 15% that occurred within a joint home and 6% that occurred in the accused's home. Just over three-in-ten (31%) incidents occurred in an 'other dwelling'.
The remaining 9% of incidents occurred in the street (5%), licensed premises (0.2%) or an 'Other' location (4%) (Figure 8 & Table 11).
2.11. Day/month of occurrence
The following section is based on the date the incident of domestic abuse occurred, rather than when it was recorded by the police[12].
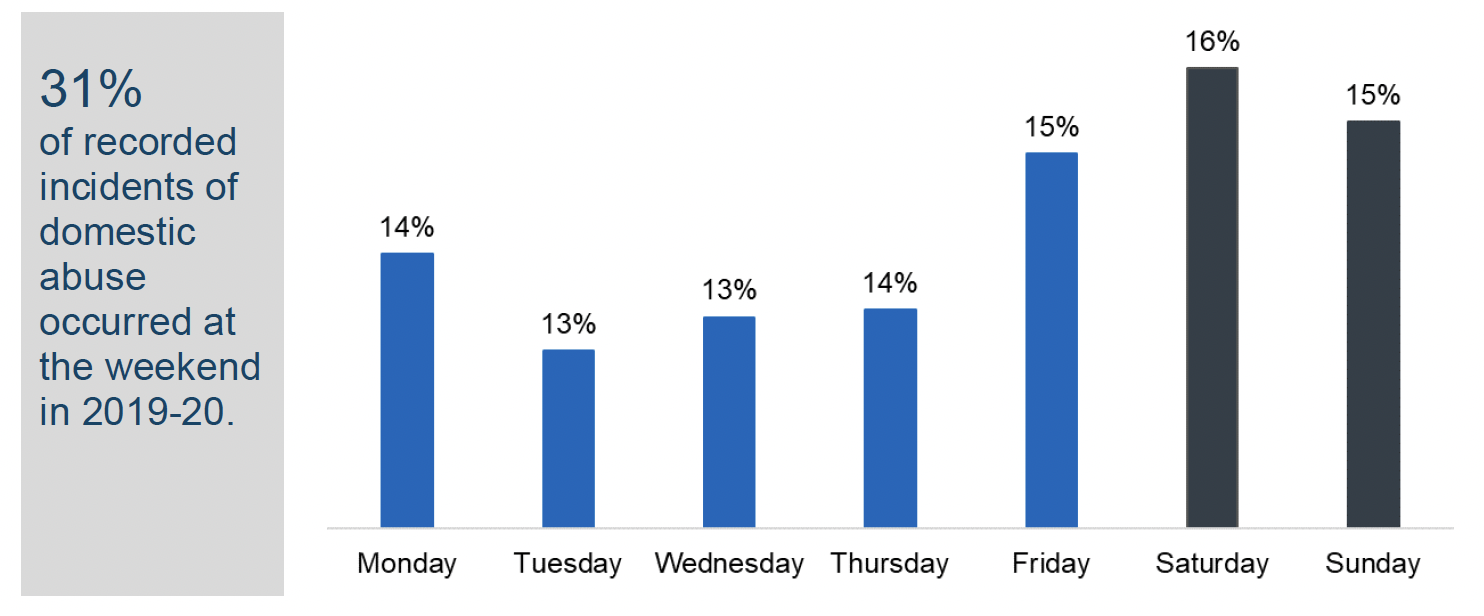
Just under a third (31%) of incidents in 2020-21 (Figure 9) occurred at the weekend, a decrease compared to the proportion in 2019-20 (34%). 15% of incidents occurred on a Friday. The remaining 54% of incidents are spread fairly evenly from Monday to Thursday.
When looking at the month that incidents of domestic abuse recorded by the police occurred in 2020-21, no clear pattern emerges from the data, with incidents fairly evenly spread out across the year.
Tables for incidents by month are available within the 'Supporting Documents' Excel workbook on the Domestic Abuse Statistics website.
Contact
Email: justice_analysts@gov.scot