Digital aerial seabird and cetacean surveys off the east coast of Scotland
This report provides eight digital aerial surveys of seabirds and marine mammals across the seas east of Scotland between February 2020-January 2021, a task driven by the need of updating existing data. The main difference was seen in seabird distribution, with little change to cetacean abundance.
2. Survey and analysis methodologies
2.1. Survey planning
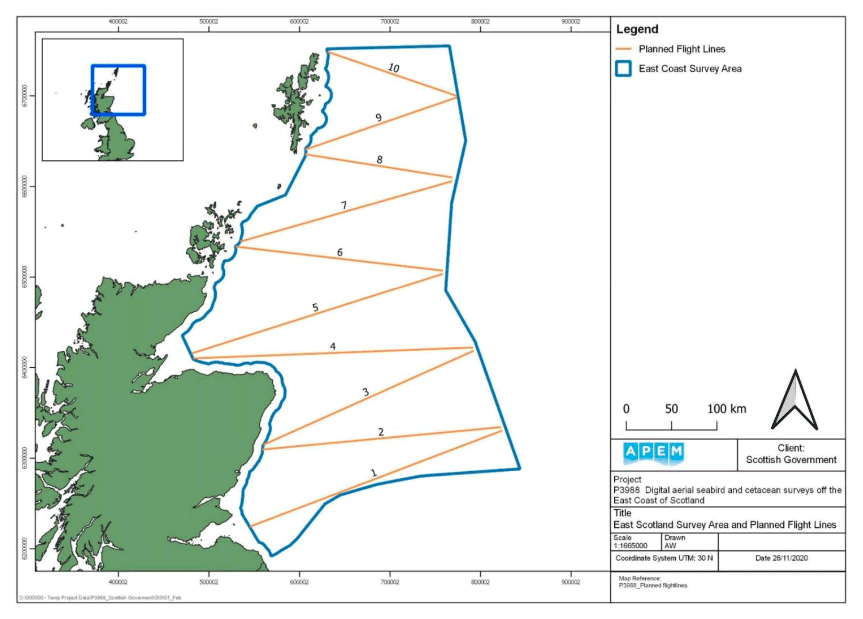
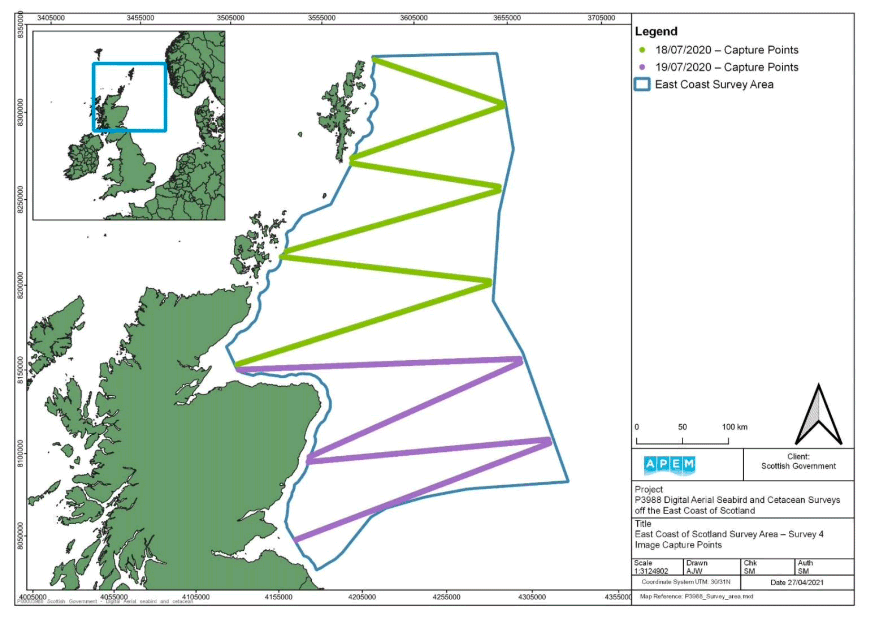
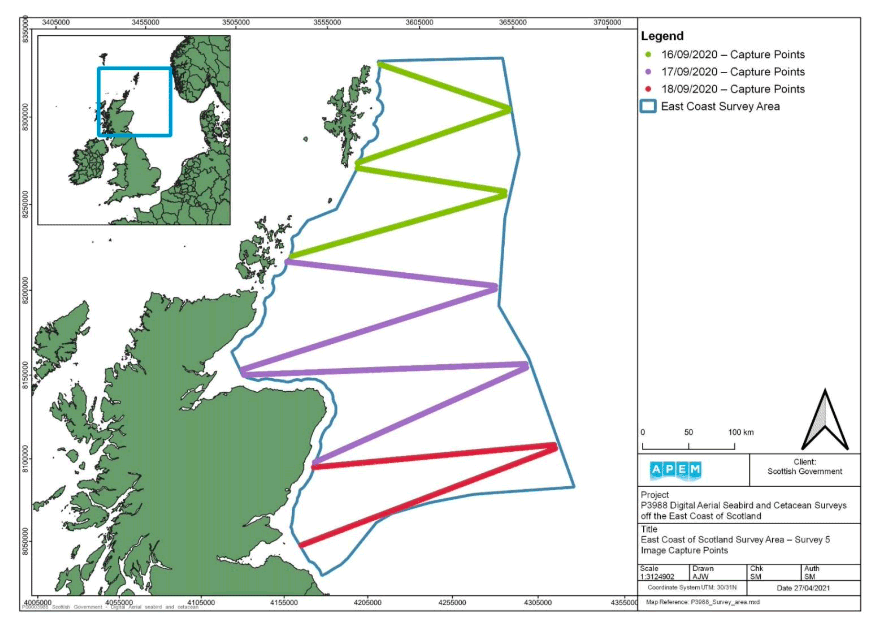
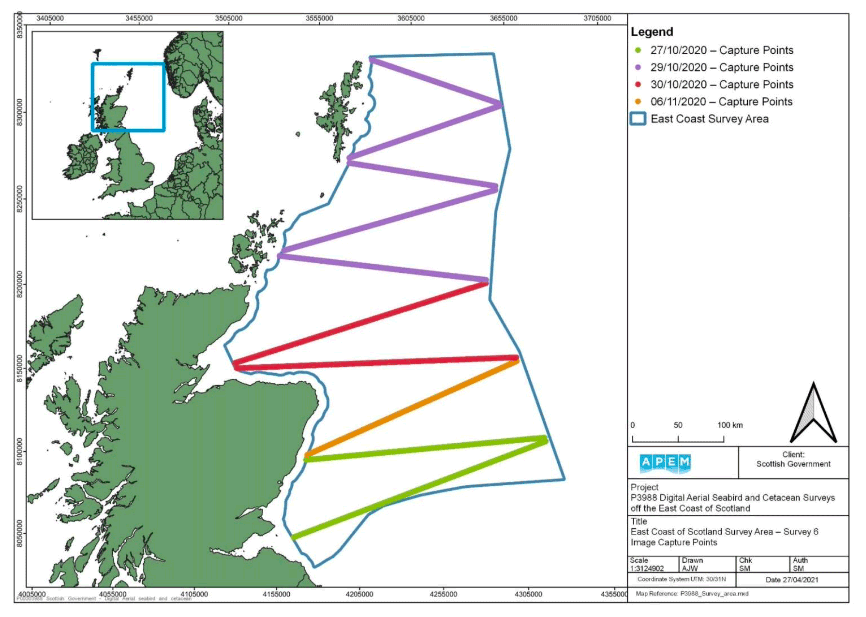
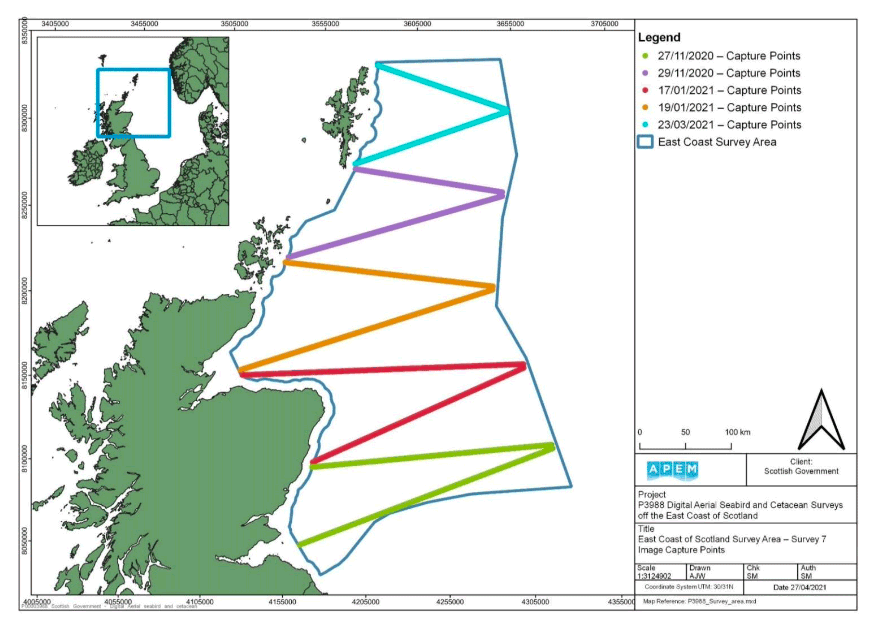
APEM's camera system was fitted into a twin-engine aircraft (Ravenair) and custom flight planning software allowed each flight line to be accurately mapped out before take-off. The use of global positioning system (GPS) linked to a bespoke flight management system ensured the survey tracks were flown with a high degree of accuracy. The aerial digital surveys captured images along ten transects spaced in a sawtooth pattern to achieve full coverage across the wider East Coast targeted area (hereafter known as Survey Area; Figure 1).
Data collection was on average better than two-centimetre (cm) ground sample distance (GSD) digital still images. The transect swathe was 960 meters (m), images were collected continuously (abutting digital still imagery) along the ten transects. At least 194 kilometres (km2) of sea surface area was collected representing 1.5% coverage of the wider survey area (Figure 1).
2.2. Image review – marking and species identification
The data collected from the Survey Area were processed to ensure the imagery was at the optimum clarity for screening purposes. Trained APEM analysts examined each image manually, using a systematic method. Images were split into those that contain targets (such as birds, marine mammals, sharks, fish and vessels) and those that were "blank" (no targets present). Via a user interface, targets were measured (cm) and identified. Analysts were aided by an in-house Image Archive Library, which provided images of avian and marine megafauna overhead, this was used alongside bird reference lengths to allow for accurate identification. For instance, when identifying sitting birds, the relationship between pixel size and length was known, this was compared to known reference lengths from multiple sources to aid identification. For flying birds, the wingspan measurements recorded were a minimum (as the wings may not be fully stretched), however this was still useful in eliminating confusion between species. Using these tools, targets were identified to the lowest taxonomic level possible. Once identified, each target was "snagged", which provided the following data for each target:
- Unique identification and cropped (low resolution) image;
- Time and date at which individual image was collected;
- GPS coordinate for each individual recorded, at an accuracy of +/- 1 to 5 m;
- Unique identifying numbers for each individual recorded, image number, and individual camera that captured that image;
- Details of avian target age, gender, and molt status wherever possible;
- Behavioural information observed for avian records to provide data on whether a bird was sitting on the water, flying, or diving (further information on whether an individual was part of a group or carrying food were also recorded);
- Behaviour for marine mammals were recorded for whether an individual was submerged or surfacing or nursing a juvenile;
- The orientation of birds in flight; and
- Body length (cm) of all avian and marine megafauna, wingspan (cm) of flying birds.
2.3. Quality control procedure
Once each target was located and identified in the imagery, the data was exported in Excel format. Following positive identification of targets, a review process was undertaken. The review was undertaken by internal quality control (QC) managers, experienced in the identification of the target taxa. During the QC process 100% of identified species were checked for accuracy.
A random audit of 10% of images recorded as "blank" was undertaken to quantify detection success. If detection success was ≤95%, all data was reprocessed. This was repeated until detection success reaches >95% to address any consistent errors and issues.
2.4. Species distribution maps
Bird observations comprised individual points for each recorded individual, geo-referenced to the actual spatial location at the time of survey. Species-specific survey distribution maps were produced for each survey using QGIS.
2.5. Summary of aerial digital surveys
The survey was undertaken by an APEM camera technician, and a pilot (Ravenair), surveys were only undertaken when the weather was deemed appropriate by the survey crew (Table 1). As well as being continually monitored during the survey, following each survey, sample imagery was evaluated to make sure it was of suitable quality for analysis. Data were then backed up on more than one secure server after each survey and prepared for analysis.
| Condition | Minimum Survey Requirement |
|---|---|
| Visibility (kilometres) | >10 |
| Cloud Cover (metres) | >549 |
| Wind (knots) | <30 |
| Sea State[3] | <4 |
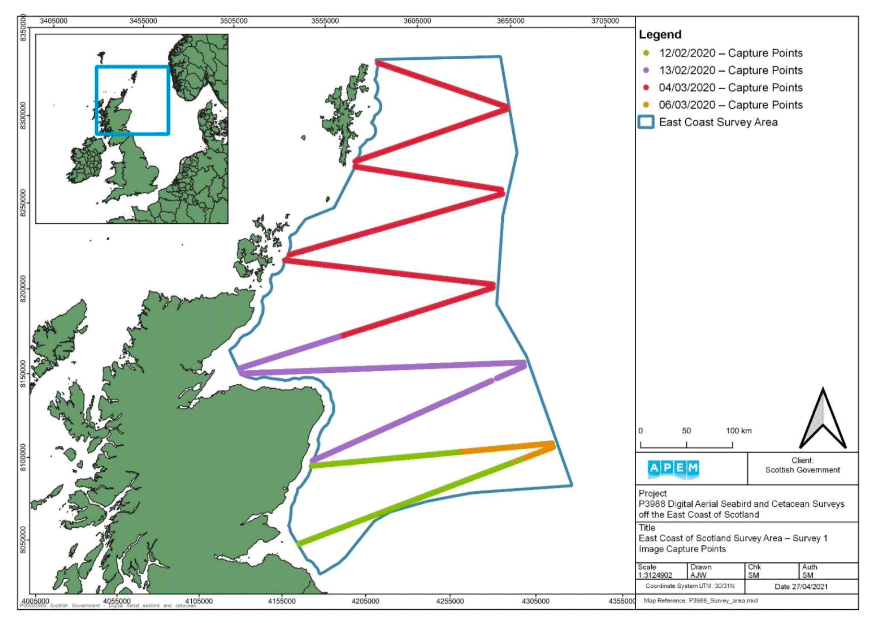
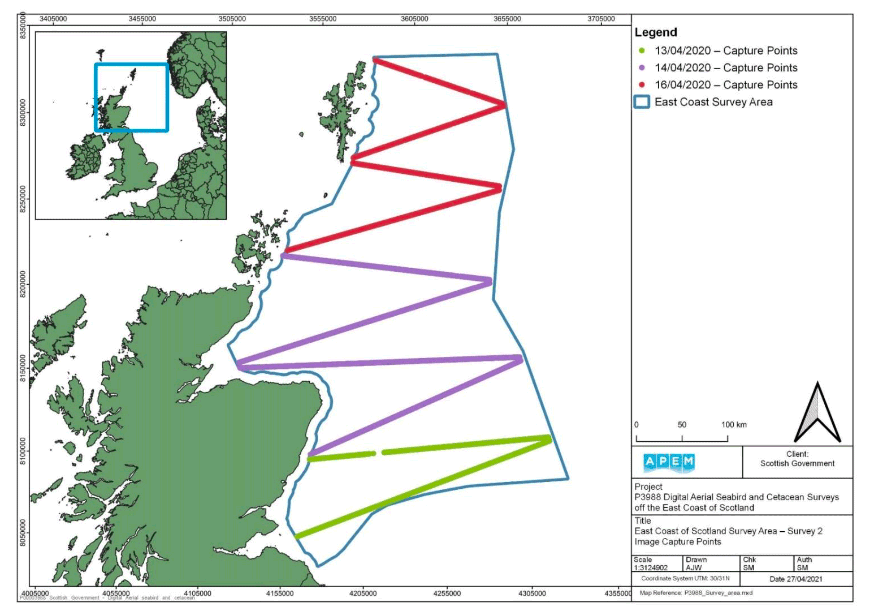
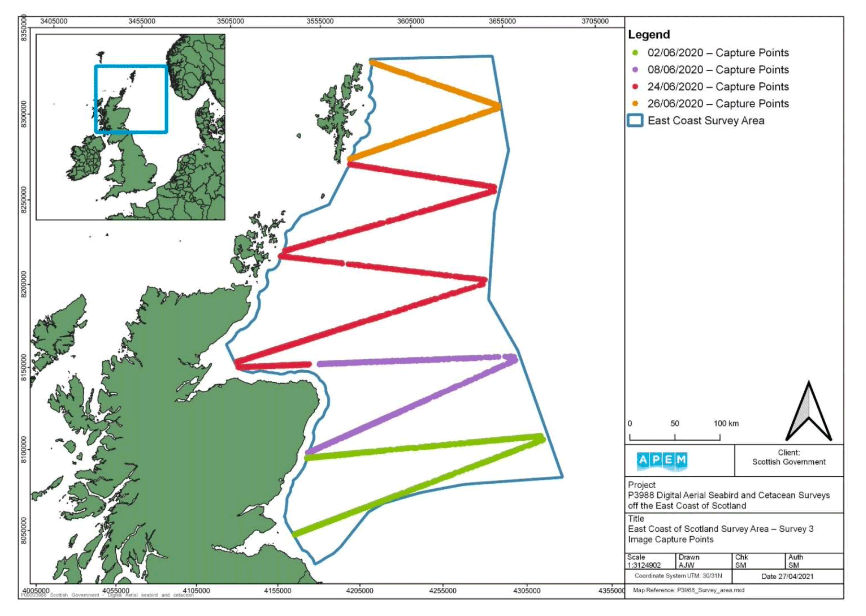
A summary of the dates each of the eight surveys that were flown is provided in Table 2. Due to the size of the survey area, surveys were conducted over more than one day; wherever possible the transects were attempted to be flown over consecutive days and if this was not possible, e.g. due to poor weather, the survey was undertaken in the next available survey window (Figures 2-8). A summary of the weather conditions that were recorded are provided in Table 3.
No health and safety issues were reported during the surveys.
| Survey | Date | UTC Start Time (HH:MM) | UTC End Time (HH:MM) |
|---|---|---|---|
| Survey 1 | 12/02/2020 | 12:57 | 15:34 |
| 13/02/2020 | 10:40 | 16:10 | |
| 04/03/2020 | 09:37 | 14:53 | |
| 06/03/2020 | 16:58 | 17:38 | |
| Survey 2 | 13/04/2020 | 15:00 | 17:32 |
| 14/04/2020 | 09:15 | 17:05 | |
| 16/04/2020 | 09:09 | 14:12 | |
| Survey 3 | 02/06/2020 | 08:19 | 10:56 |
| 08/06/2020 | 14:25 | 16:31 | |
| 24/06/2020 | 08:19 | 13:31 | |
| 25/06/2020 | 10:03 | 11:32 | |
| Survey 4 | 18/07/2020 | 07:50 | 11:13 |
| 18/07/2020 | 14:34 | 16:58 | |
| 19/07/2020 | 08:55 | 11:32 | |
| 19/07/2020 | 13:50 | 16:23 | |
| Survey 5 | 16/09/2020 | 08:10 | 09:58 |
| 16/09/2020 | 13:15 | 14:40 | |
| 17/09/2020 | 08:37 | 11:01 | |
| 17/09/2020 | 13:31 | 16:06 | |
| 18/09/2020 | 08:21 | 10:54 | |
| Survey 6 | 27/10/2020 | 11:54 | 14:12 |
| 29/10/2020 | 08:58 | 12:23 | |
| 29/10/2020 | 14:45 | 15:57 | |
| 30/10/2020 | 09:48 | 12:45 | |
| Survey 7 | 27/11/2020 | 10:06 | 12:32 |
| 29/11/2020 | 11:02 | 12:59 | |
| 17/01/2021 | 12:36 | 15:12 | |
| 19/01/2021 | 12:33 | 15:02 | |
| 23/03/2021 | 10:39 | 11:39 | |
| 23/03/2021 | 15:43 | 16:22 | |
| Survey 8 | 21/02/2021 | 11:01 | 14:04 |
| 28/02/2021 | 15:38 | 16:42 | |
| 05/03/2021 | 11:27 | 12:50 | |
| 06/03/2021 | 10:40 | 13:01 | |
| 06/03/2021 | 15:14 | 17:11 | |
| 14/03/2021 | 12:01 | 12:37 | |
| 23/03/2021 | 16:24 | 17:06 |
| Survey | Date | Visibility (km) | Sea State | Turbidity | Cloud Cover (%) | Air Temp (oC) | Wind Speed (knots) / Direction |
|---|---|---|---|---|---|---|---|
| Survey 1 | 12/02/2020 | 10+ | 4 | 1 | 73 | -7 to -6 | 37.5 – 40 / W |
| 13/02/2020 | 10+ | 1 | 0 | 10 | -6 | 10 – 15 | |
| 04/03/2020 | 10+ | 1 | 1 | 50 | -6 | <10 | |
| 06/03/2020 | 10+ | 1 | 0 | 50 | -6 | 16 / W | |
| Survey 2 | 13/04/2020 | 10+ | 1 | 0 | 50 | 0 | 10 / E |
| 14/04/2020 | 10+ | 1 – 2 | 0 | 50 | 1 – 4 | 5 – 20 / E | |
| 16/04/2020 | 10+ | 1 | 0 | 50 | 4 | 20 / E – 10 / W | |
| Survey 3 | 02/06/2020 | 10+ | 0 – 1 | 0 | 10 | 13 – 15 | 5 / E – 10 / NW |
| 08/06/2020 | 10+ | 0 – 1 | 0 | 10 | 5 | 9 / NW | |
| 24/06/2020 | 10+ | 1 | 1 | 10 – 95 | 15 – 16 | 15 / SW – 30 / SE | |
| 25/06/2020 | 10+ | 1 | 0 | 50 | 18 | 30 / SE | |
| Survey 4 | 18/07/2020 | 10+ | 1 – 3 | 1 | 0 | 8 | 20 / SW |
| 18/07/2020 | 10+ | 2 | 1 | 0 | 10 | 24 / W | |
| 19/07/2020 | 10+ | 2 | 1 | 0 | 8 | 20 / W | |
| 19/07/2020 | 10+ | 1 | 1 | 0 | 8 | 10 / W | |
| Survey 5 | 16/09/2020 | 10+ | 3 | 0 | 90 – 100 | 8 | 10 / E |
| 16/09/2020 | 10+ | 2 | 0 | 0 – 100 | 4 | 7 / W | |
| 17/09/2020 | 10+ | 3 | 0 | 90 – 100 | 12 | 10 / W | |
| 17/09/2020 | 10+ | 3 | 0 | 100 | 18 | 15 / W | |
| 18/09/2020 | 10+ | 1 | 0 | 0 | 15 | 7 / W | |
| Survey 6 | 27/10/2020 | 10+ | 1 | 2 | 70 | 7 | 10 / SW |
| 29/10/2020 | 10+ | 1 | 2 | 10 – 40 | 10 | 10 / SW | |
| 29/10/2020 | 10+ | 1 | 2 | 50 | 10 | 17 – 20 / E | |
| 30/10/2020 | 10+ | 2 | 2 | 30 – 40 | 9 | 10 / S | |
| Survey 7 | 27/11/2020 | 10+ | 1 | 1 | 50 – 60 | 5 | 12 / W |
| 29/11/2020 | 10+ | 2 | 1 | 70 – 80 | 8 | 15 / SW | |
| 17/01/2021 | 10+ | 3 | 1 | 50 – 70 | 4 | 15 / W | |
| 19/01/2021 | 10+ | 2 | 1 | 50 | 2 | 15 / W | |
| 23/03/2021 | 10+ | 3 | 0 | 100 | 3 | 35 / SW | |
| 23/03/2021 | 10+ | 3 | 0 | 100 | 3 | 35 / SW | |
| Survey 8 | 21/02/2021 | 10+ | 2 | 1 | 50 – 60 | 6 | 30 / S |
| 28/02/2021 | 10+ | 0 | 1 | 60 | 3 | 10 / W | |
| 05/03/2021 | 10+ | 1 – 2 | 2 | 10 | 4 | 15 / NW | |
| 06/03/2021 | 10+ | 1 – 2 | 2 | 70 – 100 | 3 | 20 / W | |
| 06/03/2021 | 10+ | 1 – 2 | 2 | 60 | 5 | 18 / W | |
| 14/03/2021 | 10+ | 2 | 1 | 100 | 1 | 28 / N | |
| 23/03/2021 | 10+ | 3 | 0 | 100 | 3 | 30 / SW |
*Beaufort Sea State – 0 = calm – flat, 1 = ripples, 2 = small wavelets, 3 = large wavelets, some white caps, 4= small waves (breaking), frequent whitecaps, 5= moderate waves of length, many whitecaps with spray
**Turbidity - 0 - Clear, 1 - Slightly Turbid, 2 - Moderately Turbid, 3 - Highly Turbid.
*** Cloud Cover - 0% - Clear, 1- 10% Few, 11- 50% Scattered, 51- 95% Broken Clear, 96-100% Overcast.
| Survey | Images | Km2 | Coverage (%) |
|---|---|---|---|
| Survey 1 | 32,049 | 2,181 | 1.94 |
| Survey 2 | 23,625 | 1,607 | 1.43 |
| Survey 3 | 32,036 | 2,180 | 1.94 |
| Survey 4 | 32,208 | 2,192 | 2.00 |
| Survey 5 | 32,064 | 2,185 | 1.94 |
| Survey 6 | 31,940 | 2,176 | 1.93 |
| Survey 7 | 32,278 | 2,196 | 1.95 |
| Survey 8 | 31,704 | 2,157 | 1.92 |
Contact
Email: REEAadmin@gov.scot