Diet and healthy weight: monitoring report 2020
Latest results against the obesity indicator framework originally developed to monitor progress against our Prevention of Obesity Route Map (February 2010), now superseded by the Diet and Healthy Weight Delivery Plan and Active Scotland Delivery Plan (summer 2018).
Adult overweight and obesity
Scottish Health Survey
Latest results
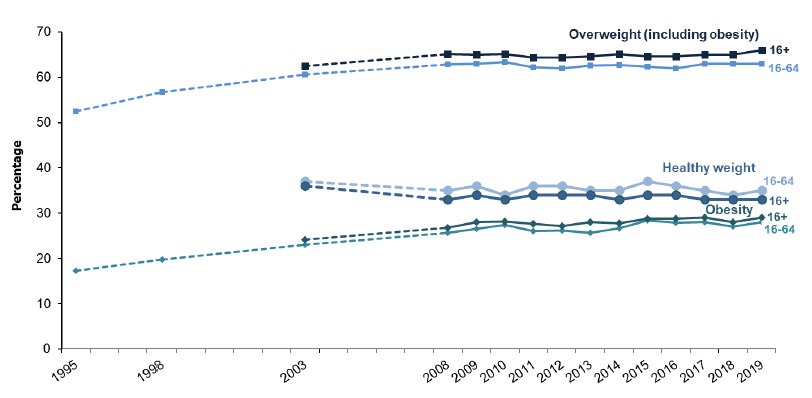
- In 2019, 66% of adults aged 16 and over were overweight (the highest in the time series, but not significantly different to the level observed in recent years), including 29% who were obese.
- In 2019, 33% of adults aged 16 and over had a weight within the healthy range, the same as in 2018 and 2017.
- There has been an increase in the proportion of adults aged 16-64 that are overweight (including obesity) since 1995, from 52% to 63%. Most of this increase was seen between 1995 and 2008, with figures remaining broadly stable since then.
- As in previous years, in 2019 prevalence of overweight including obesity was significantly higher among men compared with women (69% and 63% respectively). However, there was no significant difference between the proportion of men that were obese or morbidly obese compared with the proportion of women (29% and 30% respectively).
- Prevalence of overweight including obesity also varied with age; increasing from 40% of those aged 16-24, then linearly among those aged 25-74, to a high of 79% among adults aged 65-74, before decreasing to 71% among those aged 75 and over.
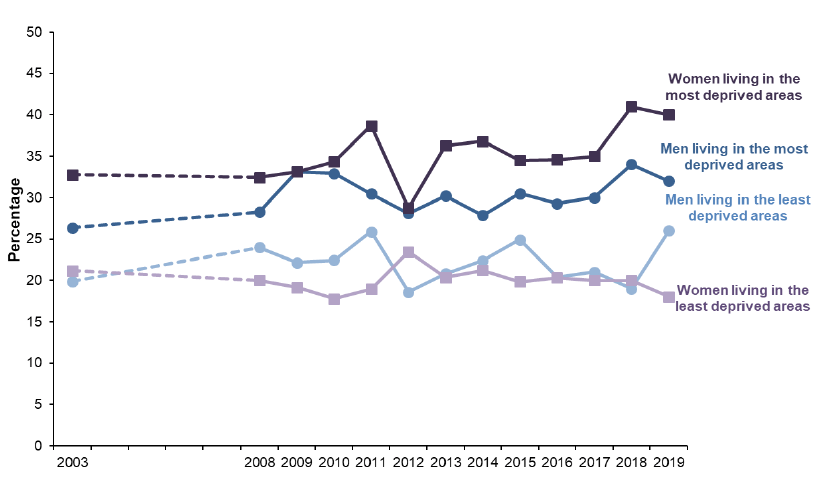
- Obesity rates are consistently higher in Scotland's most deprived areas compared to the least deprived (Figure 2). The gap has been particularly pronounced for women in recent years - obesity rates in 2019 were 40% in the most deprived areas compared to 18% in the least deprived.
Definitions
Weight within the healthy range – BMI 18.5 kg/m2 to less than 25 kg/m2
Overweight – BMI 25+ kg/m2
Obese – BMI 30+ kg/m2
Geography available
Scotland level, health board, local authority (where sample sizes are sufficient).
Equalities data
Breakdowns by age, sex, deprivation (SIMD), equivalised income and disability (limiting long-term illness) are available in the SHeS 2019 supplementary tables.
Rationale for including adult overweight and obesity
These data are useful to monitor changes in the proportion of Scotland's adult population who are within the healthy weight range, overweight and obesity. Different patterns amongst men and women of different ages can be identified.
The 16-64 trend is included to allow comparisons with the 1995 and 1998 Scottish Health Surveys, as they did not collect BMI data for all ages. In 1995, the sample was designed to provide a nationally representative sample of the working age population of Scotland (16-64) living in private households. In 1998, the upper age limit for adults was extended from 64 to 74.
Factors influencing adult overweight and obesity
- Diet, physical activity and sedentary behaviour are strongly associated with BMI.
- Obesity is significantly associated with area-level deprivation (SIMD)[7].