Designing and Evaluating Behaviour Change Interventions
Easy-to-use guidance on designing and evaluating any behaviour change intervention using the 5-step approach
AN UPDATED VERSION OF THIS GUIDANCE IS AVAILABLE HERE http://www.gov.scot/Publications/2016/05/1967
Step 4: Monitor your logic model
Use the logic model of identify indicators
Once the logic model is completed, you need to figure out how you will be able to tell if your model works as predicted, or not. To do this, you should:
1. Devise 'evaluation questions' – specific questions that you need to answer in order to test whether the model is working as predicted.
2. Identify specific indicators (measures or signals of some kind) that can answer these questions and therefore provide evidence that your model is or isn’t working as expected.
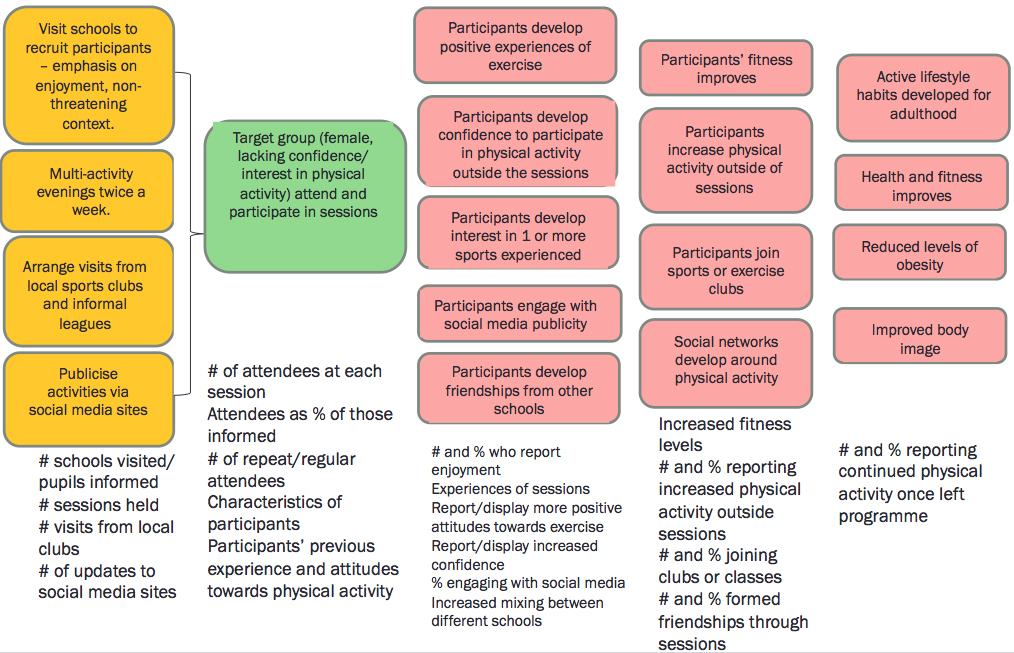
Example - Increasing physical activity
Example indicators for activities and outcomes
Data collection principles
Now you’ve identified your indicators, you need to decide on a way of measuring or observing these things. There are lots of different methods you can use to collect this data (see 'data collection methods') but some basic principles to observe are:
- Collect data for every stage of your logic model, including resources and activities as well as output.
- Collect data at a unit level (i.e. about every user of the service) and at an aggregate level (i.e. about the service as a whole). Unit level data can be very useful as it can tell you who the service is working for and who it isn’t. and you can follow the progress of individuals over time. It can also be combined to give you overall data about your service. But remember, if you only collect aggregate data you will not be able to disaggregate it and therefore collect evidence about particular individuals.
- Follow users through the project. You should collect data about users at the very start, throughout and ideally beyond completion of the project. This will enable you to evidence whether users have changed, in terms of their attitudes, behaviour or knowledge.
- Make use of numbers and stories. Collect qualitative as well as quantitative evidence. Averages and percentages can help you to assess overall trends and patterns in outcomes for service users. Talking to people, hearing about the views and experience of users and stakeholders will help you to explain these patterns.
- Don’t reinvent the wheel. Standardised and validated (pre-tested) tools are available to measure such things as self-esteem, wellbeing and employability. Using these will enhance the reliability of your evidence and save you valuable time. Freely available tools are detailed here:
- http://www.clinks.org/sites/default/files/UsingOffShelfToolstoMeasureChange.pdf
- http://www.evaluationsupportscotland.org.uk/resources/tools/
- http://inspiringimpact.org/resources/ (follow link to 'List of Measurement Tools and Systems')
- Be realistic and proportionate. Expensive and/or experimental projects should collect greater amounts of data than well-evidenced and established, cheaper projects. You might want to give questionnaires to all users but it would usually be sensible to carry out in-depth interviews with just a smaller sample of your users.
Data collection methods
Various methods can be used to collect data in relation to your evaluation questions. Data can be collected from service users, staff or outside agencies. Not all methods will be suitable for all projects. Evaluation Support Scotland have produced excellent guidance on using different approaches.
- Using Interviews and Questionnaires http://www.evaluationsupportscotland.org.uk/resources/129/
- Visual Approaches http://www.evaluationsupportscotland.org.uk/resources/130/
- Using Qualitative Information http://www.evaluationsupportscotland.org.uk/resources/136/
- Using Technology to Evaluate http://www.evaluationsupportscotland.org.uk/resources/131/
More general advice on generating useful evidence can be found in the 'Evidence for Success' guide http://www.evaluationsupportscotland.org.uk/resources/270/
TIP The most rigorous evaluations will be based on data collected using a range of methods.
Data capture and analysis
Data Capture
You need a way of capturing and storing the data you collect which will make it easy for you to analyse.
1. Input data into an Excel spread sheet (or any other database that allows the data to be analysed rather than just recorded).
An example database is currently in development by Scottish Government analysts and will be published in 2015/16.
2. Some data could be simply recorded as raw numbers such as costs, number of staff or age.
3. Some data might be recorded using drop-down menus, e.g. user characteristics (ethnicity, male/female,) response options in questionnaires or attendance at a particular session.
4. Qualitative data (e.g. from interviews and focus groups) may need to be transcribed or recorded via note-taking.
Data Analysis
Numerical data or 'tick box' answers might be analysed and reported using percentages and/or averages. E.g. 'the median (average) age of users was 16' or '80% of users rated the sessions as ‘enjoyable’ or ‘very enjoyable’.'
BUT remember to also report actual numbers as well as percentages, especially if you have only a small number of users. It can be misleading to say 66% of users attended a session, if there are only six users in total.
Where you have collected qualitative data (e.g. answers to open questions or interviews), go through all of the responses and highlight where common responses have been made by different people. These common responses can be reported as ‘themes’, to summarise the kinds of things people have said in their answers.
A data collection framework
A data collection framework is really useful for evaluators. It is a document, often in the form of a table, clearly setting out:
- What data you will collect in relation to each stage of the logic model
- From whom or what, will you collect your data
- Where and how you will record your data (e.g. on a database)
Appendix 1 shows an example of a fictitious data collection framework which is designed to test our previously described intervention to increase physical activity in young women.
Contact
Email: Catherine Bisset