Water - Delivery Assurance Group (DAG) report: quarter 2 - 2022 to 2023
Sets out how Scottish Water is progressing with the delivery of projects and programmes included on the ‘Committed List’ and confirms the position up to the end of December 2022 (quarter 2 2022 to 2023).
3. Indicator of Progress of Overall Delivery
The Indicator of Progress of Overall Delivery (IPOD) provides a high-level measurement of Scottish Water's progress in delivering the Committed List for projects over £1m[1]. It assesses the progress of these investment projects monitored across 3 delivery gates[2] combining this information to give an overall score.
When projects are added to the Committed List, each milestone is allocated 1 point. Each quarter, the number of points achieved by reaching gates is assessed against the baseline[3] level for the previous quarter (lower limit) and the subsequent quarter (upper limit). These points are shown as absolute scores. Scottish Water is considered to be within the range where the number of points gained lies within the lower and upper limits.
At the end of September 2022, Scottish Water's IPOD position was on track at 420 points, against a range of 406 to 555 points (Figure 1) indicating that overall, the programme is being delivered within the forecasted target range. Delivery of the programme is expected to remain within range.
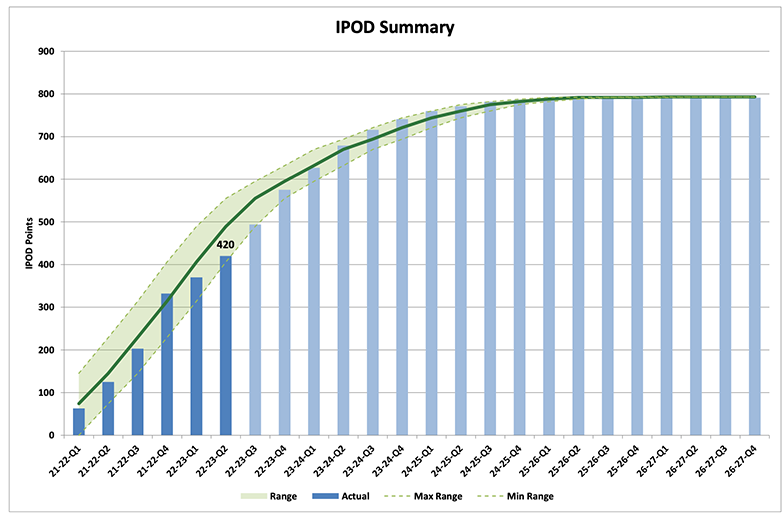
The green line in the figure above shows the aggregate of the forecast dates in the Committed List (the baseline). The solid blue bars show Scottish Water's actual position, and the light blue bars show the forecast position for future months. The green area above shows the + or – 3 months target range (i.e., the baseline from the previous and subsequent quarters respectively). Being above this shows that Scottish Water is more than 3 months ahead of the baseline and being below this shows that Scottish water is more than 3 months behind the baseline.
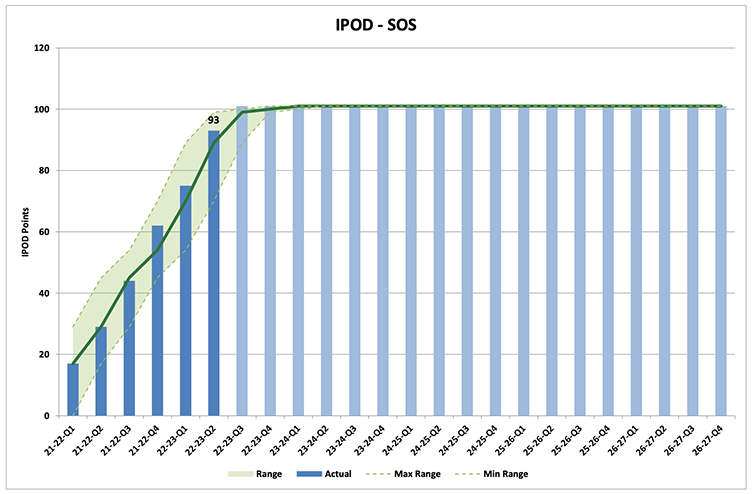
Figures 2, 3 and 4 below show the IPOD position at Quarter 2 2022/2023 by individual milestone
IPOD – SOS
18 projects started on site during Q2 with performance on the Start on Site milestone being in the top half of the range.
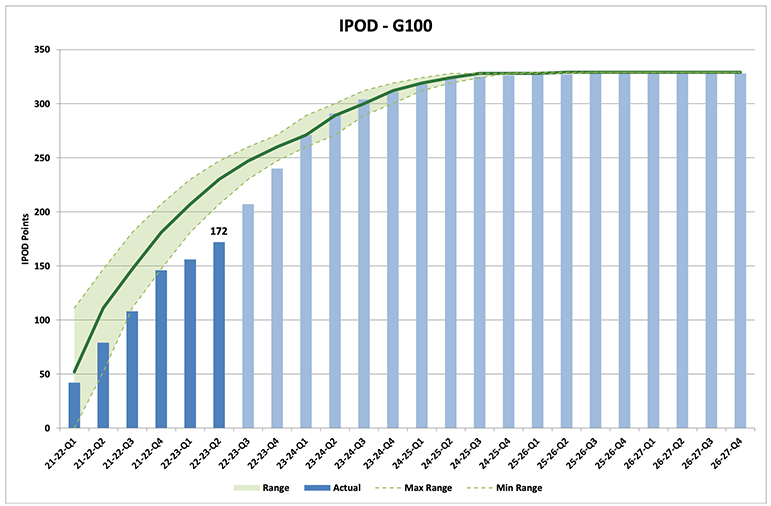
IPOD – Acceptance
16 projects achieved acceptance during Q2, bringing the total number of completed projects delivering benefit for customers to 172 which is outwith the forecast range of 207 - 247. 28 projects that have not yet had acceptance signed off are now substantially complete and are forecasting acceptance in Q3, with a further 18 forecasting acceptance by the end of the year. Explanation of this movement can be found in Sections 4 & 5. Full details of the projects impacted on the wastewater portfolio have been explored bi-laterally between SW and SEPA with details supplied to SEPA who will advise of any specific concerns, and the presentation deck is included as an extra Appendix F to this paper.
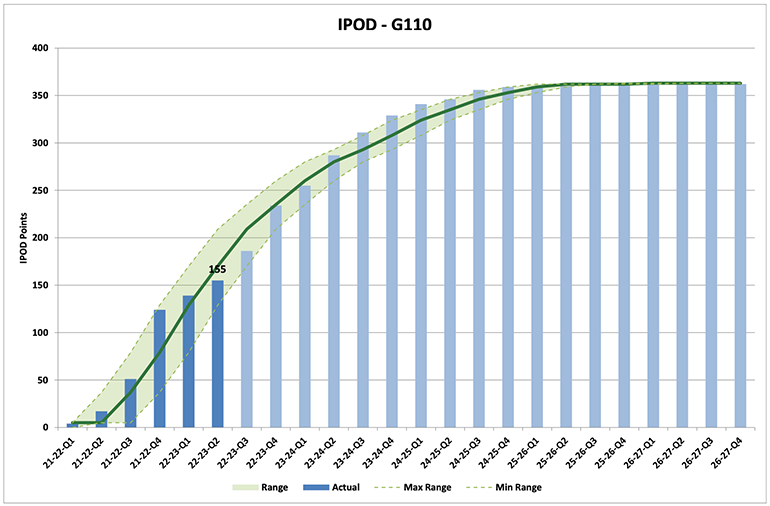
IPOD – Financial Completion
16 projects achieved financial completion during Q2. 155 points were achieved to date with the target range being 129 –209
Contact
Email: waterindustry@gov.scot