Building standards - Standard 2.15 Automatic Fire Suppression Systems: cost benefit analysis
We commissioned this cost benefit analysis research to inform the decision making process for Limitations to Standard 2.15 Automatic Fire Suppression Systems – Alterations, Extensions and Conversions , to consider the circumstances which would support the relaxation of the Standard to assist in the proposal to amend the limitations of Standard 2.15.
Part of
2. Analysis of Fire Statistics
2.1 Trends in the Number of Fires
2.1.1 This section sets the context for the analysis by providing a brief overview of the trends in the number fires and casualties in Scotland in recent years, drawing on the Scottish Fire and Rescue Service (SFRS) comprehensive incident dataset.
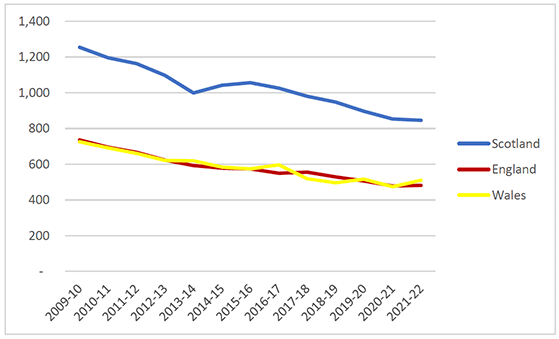
2.1.2 There has been a substantial reduction (-29%) in the number of dwelling fires in Scotland since 2009/10.[1] The number of fires per million population has fallen from 1,254 in 2009/10 to 845 in 2021/22. However, the number of fires per million population remains significantly higher than in England and Wales. Figure 2.1 provides details.
2.1.3 The SFRS data classify building fires into residential dwellings, residential 'other' and non-residential. The buildings covered by Standard 2.15 are primarily residential dwelling buildings, although there are some buildings within residential 'other' and non-residential categories which are relevant to the analysis.
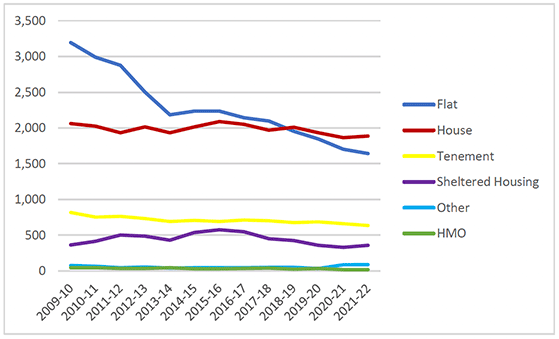
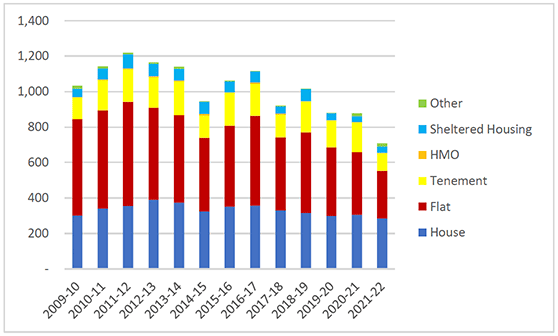
2.1.4 While the number of residential dwelling fires has declined by almost 30% since 2009/10, the decrease has primarily been driven by the decline in fires in flats. Figure 2.2 provides details of the number of residential dwelling fires by building type. Note that the sheltered housing data shown in the dwellings graph relate to self-contained sheltered housing.
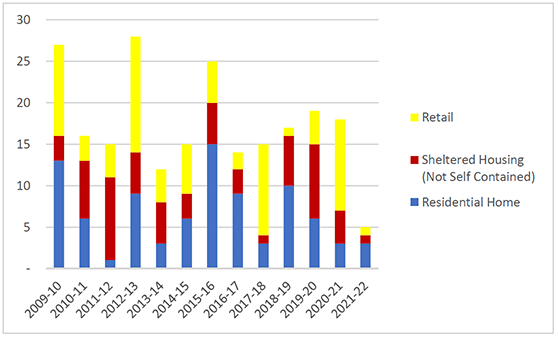
2.1.5 Figure 2.2 also shows the trend in the number of fires in other building types which are relevant to the current analysis. The absolute number of fires in these building categories in 2021/22 is considerably less than the residential dwelling categories except for HMOs and 'other' residential buildings.

2.2 Trends in the Number of Casualties
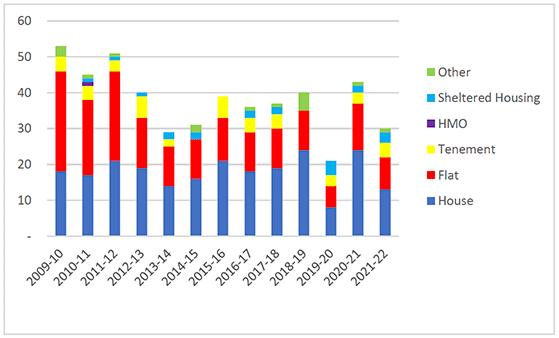
2.2.1 Figure 2.3 shows the number of fatal casualties in residential dwelling fires between 2009/10 and 2021/22. Although the number of fatalities fluctuates from year to year, there has been a clear reduction in the number of deaths in residential dwelling fires over the period from 53 in 2009/10 to 30 in 2021/22.
2.2.2 In each year, the majority of fatalities arise in house and flat fires, but as shown in Figure 2.2, house and flat fires dominate in terms of the number of fires. Throughout the period there has only been one fatality in HMO properties with the number of tenement and sheltered housing fatalities usually less than 5 per annum.
2.2.3 Figure 2.3 also shows the trend in the number of fatalities in other relevant building types. There have been very few fatalities in these building types over the period.
2.2.4 Figure 2.4 shows the trend in the number of non-fatal casualties in residential dwelling fires between 2009/10 and 2021/22. As with fires and fatalities, there has been a general reduction in the number of non-fatal casualties. Non-fatal casualties are dominated by casualties in flats and houses.
2.2.5 The number of non-fatal casualties in other building types is also shown in the Figure although the total number of non-fatal casualties is very low. Within each building type there are typically less than 10 non-fatal casualties per annum.
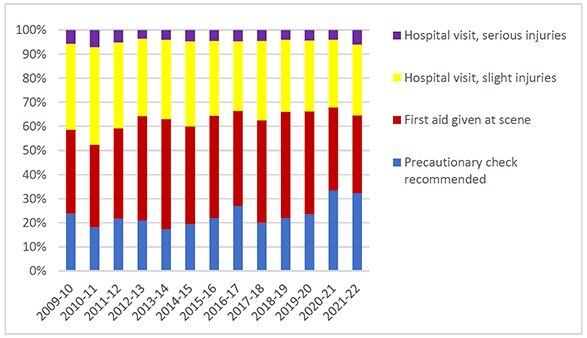
2.2.6 For all dwelling fires, the distribution of non-fatal casualties by severity of injury is shown in Figure 2.5. The injuries are classified using a scale where 'precautionary check recommended' is the lowest form of medical intervention through to hospital visit with serious injuries. The scale covers:
- Precautionary check recommended.
- First aid given at the scene.
- Hospital visit with slight injuries,
- Hospital visit with serious injuries.
2.2.7 While the proportion of non-fatal casualties requiring a hospital visit for serious injuries has remained steady at approximately 6%, there has been a move towards a higher proportion of non-fatal casualties requiring the lowest form of medical intervention (precautionary check recommended).
2.2.8 There is a strong relationship between age and rates of fatal casualties. The rate of fatalities increases significantly with age, particularly for those aged over 70. After age 79 the rate is considerably higher, with those aged 80-89 having a rate more than triple the Scotland average and those over 90 years of age having a rate over six times higher. The 10-year average rate of fatal and non-fatal casualties per million population is shown in Table 2.1.
2.2.9 The relationship between age and rate of casualties is not as strong for non-fatal casualties as it is for fatal casualties. The rate for non-fatalities aged 80-89 is 1.6 times the Scotland average and those over 90 have a rate over three times the average.
| Fatal Casualties | Non-Fatal Casualties | |
|---|---|---|
| 0-4 | 0.6 | 146.6 |
| 5-16 | 0.7 | 54.9 |
| 17-29 | 2.7 | 267.3 |
| 30-39 | 4.4 | 230.3 |
| 40-49 | 8.8 | 236.1 |
| 50-59 | 11.3 | 218.1 |
| 60-69 | 12.4 | 177.3 |
| 70-79 | 15.1 | 205.8 |
| 80-89 | 25.9 | 364.6 |
| 90+ | 53.7 | 662.8 |
| Total | 7.9 | 213.6 |
2.2.10 Analysis of SFRS data[2] also shows that:
- Deprivation is strongly associated with the rate of dwelling fires with the 20% most deprived areas of Scotland having a rate of dwelling fires 4.3 times higher than the 20% least deprived areas and approximately twice the Scottish average rate.
- When the characteristics of geographical areas are considered, remote small towns and large urban areas have higher rates of dwelling fires per million population - 1.2 and 1.15 times the Scottish average respectively.
2.3 Summary
2.3.1 The last 13 years have seen a substantial reduction in the number of dwelling fires in Scotland, although the rate per million population remains considerably higher than in England and Wales. The number of fatalities and non-fatal casualties has also decreased, particularly for residential dwelling fires.
2.3.2 There has also been a move towards a higher proportion of non-fatal casualties requiring the lowest form of medical intervention. There is a strong relationship between age and the rate of fatal casualties and deprivation is strongly associated with the rate of dwelling fires.
Contact
Email: BuildingStandards@gov.scot