Coronavirus (COVID-19): ONS Infection Survey – headline results – 12 November 2021
Results from the ONS COVID-19 infection survey from 12 November 2021.
ONS Coronavirus (COVID-19) Infection Survey Results 12 November 2021
The COVID-19 Infection Survey aims to measure:
- how many people test positive for COVID-19 infection at a given point in time, regardless of whether they report experiencing coronavirus symptoms
- the average number of new infections per week over the course of the study
- the number of people who test positive for antibodies, to indicate how many people are ever likely to have had the infection or have been vaccinated
The Office for National Statistics (ONS) publish estimates for England, Wales, Northern Ireland and Scotland on their website.
The underlying data displayed in the charts in this publication is available in the reference tables on the ONS website.
All results are provisional and are subject to revision.
Main points
In the week 31 October to 6 November 2021, the estimated percentage of the population living in private residential households testing positive for COVID-19 in Scotland was 1.18% (95% credible interval: 0.95% to 1.42%). The percentage of people testing positive for COVID-19 in the private residential population remained level in the most recent week.
This equates to an estimated 62,100 people living in private residential households in Scotland that had COVID-19 at any given time (95% credible interval: 50,000 to 74,500), or around 1 in 85 people (95% credible interval: 1 in 110 to 1 in 70).
In the week 31 October to 6 November 2021, estimates for the other nations of the UK are as follows:
- in England, the percentage of people testing positive in private residential households has decreased in the most recent week to 1.70% (95% credible interval: 1.61% to 1.79%)
- in Wales, the trend in the percentage of people testing positive in private residential households has decreased in the most recent week to 2.13% (95% credible interval: 1.73% to 2.57%)
- in Northern Ireland, the trend in the percentage of people testing positive in private residential households is uncertain in the most recent week: 1.35% (95% credible interval: 0.98% to 1.77%)
In Scotland, in recent weeks, the percentage testing positive decreased for those of secondary school age and young adults. The trend is uncertain for those of nursery/primary school age and older age groups in recent weeks.
In Scotland, in the week 17 to 23 October 2021, it is estimated that there were 5,700 new positive cases per day (95% credible interval: 4,100 to 7,600). The trend in the incidence rate has is uncertain in the latest week. Please note, there is a lag of two weeks between the incidence estimate and the positivity estimate.
Modelled estimate of the proportion of the private residential population in Scotland that had the coronavirus (COVID-19)
It is estimated that in the most recent week (31 October to 6 November 2021), the percentage of those living in private residential households in Scotland that had the coronavirus (COVID-19) was 1.18%. A 95% credible interval for this figure is 0.95% to 1.42% (see note 4 for further information about credible intervals).
In the same week (31 October to 6 November 2021), ONS estimate that 62,100 people living in private residential households in Scotland at any given time had COVID-19. A 95% credible interval for this figure is 50,000 to 74,500. This equates to around 1 in 85 people (95% credible interval: 1 in 110 to 1 in 70).
In Scotland, the percentage of people testing positive for COVID-19 in the private residential population remained level in the most recent week, as shown in Figure 1.
Modelled daily estimates of the percentage of people testing positive for COVID-19, and accompanying credible intervals, are represented in Figure 1 by the blue line and grey shading. The model smooths the series to understand the trend and is revised each week to incorporate new test results. Modelled daily estimates are used to calculate the official reported estimate and provide the best indication of trends over time.
Official reported estimates of the percentage of people testing positive for COVID-19, are based on the modelled estimate for the midpoint of the most recent week at the time of publication, and represent the best estimate at that point in time. Official reported estimates, and accompanying credible intervals, are represented in Figure 1 and Figure 2 by the point estimates (blue circles). In Figure 2, pale blue circles denote 14-day weighted estimates while the official reported weekly estimates are denoted by dark blue circles.
Figure 1: modelled daily estimates and official reported estimates of the percentage of the private residential population in Scotland testing positive for COVID-19 between 26 September and 6 November 2021, including 95% credible intervals (see notes 2,3,4,5,6)
Figure 2 shows the trend in the official weekly reported estimates of the percentage of those living in private residential households testing positive for COVID-19 between 3 October 2020 and 6 November 2021. As shown in Figure 2, the estimated percentage of the private residential population testing positive for COVID-19 had been increasing from the middle of August 2021, after weeks of a decreasing trend. The rate of increase then slowed, and the rates were decreasing up to early October. The estimated percentage of people testing positive remained level in the most recent week. All official reported estimates of positivity displayed in this chart are available in the accompanying dataset on the ONS website.
Figure 2: official reported estimates of the percentage of the private residential population in Scotland testing positive for COVID-19 between 3 October 2020 and 6 November 2021, including 95% credible intervals (see notes 3,4,5,6,7)
Age analysis of the percentage of people testing positive for COVID-19 in Scotland
Figure 3 shows the percentage of people testing positive for COVID-19 by reference age, between 26 September and 6 November 2021. These estimates are based on modelled daily estimates of the percentage of the private residential population testing positive for COVID-19 in Scotland by single year of age, which are available in an accompanying dataset on the ONS website.
In recent weeks, the percentage testing positive decreased for those of secondary school age and young adults. The trend is uncertain for those of nursery/primary school age and older age groups in recent weeks.
Caution should be taken in over-interpreting small movements in the latest trend.
Figure 3: Modelled daily estimates of the percentage of the private residential population in Scotland testing positive for COVID-19, by reference age, between 26 September and 6 November 2021, including 95% confidence intervals (see notes 2,5,6,8)
ONS publish an interactive chart in their weekly bulletin.
Modelled estimate of the proportion of the private residential population testing positive for COVID-19 in each of the four nations of the UK
In Scotland, the percentage of people living in private residential households testing positive remained level in the most recent week. In England and Wales, the percentage of people testing positive has decreased in the most recent week. In Northern Ireland, the trend of the percentage of people testing positive is uncertain in the most recent week.
Figure 4: Modelled daily estimates of the percentage of the private residential population testing positive for COVID-19 in each of the four nations of the UK, between 26 September and 6 November 2021, including 95% credible intervals (see notes 2,3,4,5,6)
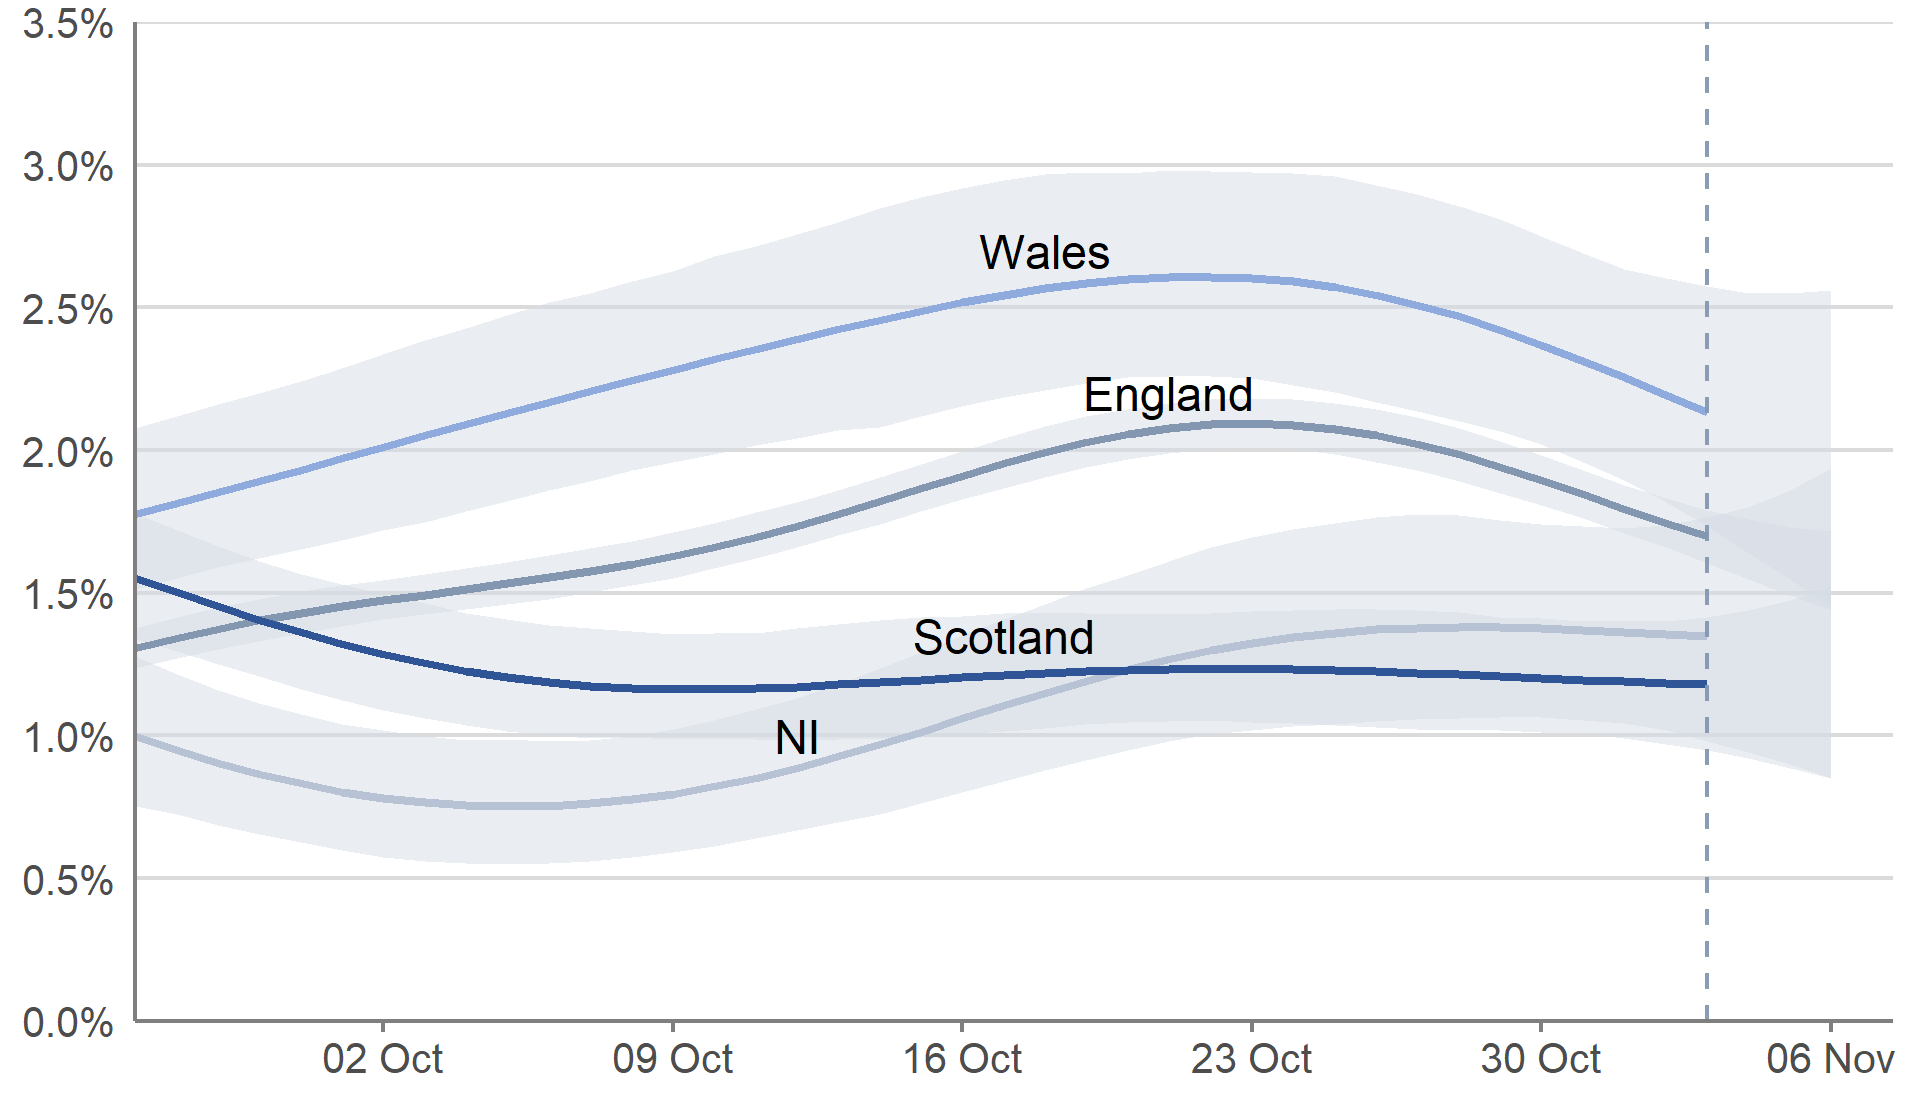 Table 1: Modelled estimates of the proportion of the private residential population testing positive for COVID-19, and corresponding 95% credible intervals, in the week 31 October to 6 November 2021, for the four nations of the UK (See notes 1,3,4,5)
| Nation |
Estimated percentage of the population that had COVID-19 |
Estimated number of people who had COVID-19 |
Estimated ratio of people who had COVID-19 |
| England |
1.70% (1.61% to 1.79%) |
925,400 (875,200 to 975,100) |
1 in 60 (1 in 60 to 1 in 55) |
| Northern Ireland |
1.35% (0.98% to 1.77%) |
24,700 (18,000 to 32,400) |
1 in 75 (1 in 100 to 1 in 55) |
| Scotland |
1.18% (0.95% to 1.42%) |
62,100 (50,000 to 74,500) |
1 in 85 (1 in 110 to 1 in 70) |
| Wales |
2.13% (1.73% to 2.57%) |
64,900 (52,700 to 78,200) |
1 in 45 (1 in 60 to 1 in 40) |
Modelled estimates of the percentage of the private residential population testing positive for COVID-19, by COVID-19 Infection Survey sub-regions
ONS have created sub-regions across the UK for the purposes of this survey. In Scotland, these sub-regions are comprised of Health Boards. For a list of sub-regions in Scotland, see note 9.
The sub-region with the highest modelled estimate for the percentage of people testing positive was CIS Region 124 (NHS Fife, NHS Forth Valley and NHS Tayside) at 1.24% (95% credible interval: 1.03% to 1.51%).
The sub-region with the lowest modelled estimate was Region 128 (NHS Ayrshire & Arran, NHS Borders and NHS Dumfries & Galloway), at 0.92% (95% credible interval: 0.71% to 1.17%).
This data is shown in Figure 5, and is also available as a dynamic map (see notes 3,4,5,9,10,12,14).
Sub-regional estimates are based on a different model to the headline estimates, and should not be compared to headline positivity estimates. The sub-regional figures may differ from the headline estimates because they are averaged over a longer time period.
The number of people sampled in each sub-regional area who tested positive for COVID-19 is lower relative to the respective overall national samples. This means there is a higher degree of uncertainty in these estimates; caution should be taken, and the uncertainty of the estimates and wide credible intervals taken into account when interpreting or ranking them.
Figure 5: Modelled estimates of the percentage of the private residential population within each CIS sub-region who would have tested positive for COVID-19 in the week 31 October to 6 November 2021, for the four nations (See notes 3,5,9,10,12,14)
Number of new COVID-19 infections in Scotland
ONS provides estimates of incidence, a measure of new polymerase chain reaction (PCR)-positive cases in a given time period. This gives the rate at which new positives occur, and subsequently become detectable, within the population.
The reference date used for the official estimates of incidence is 14 days prior to the positivity reference date (3 November 2021), with credible intervals provided until 7 days after the incidence reference date. Therefore, there is a time lag of 2 weeks between the incidence estimate and the positivity estimate. The incidence reference date used in this publication is 20 October 2021, relating to the week 17 to 23 October 2021.
For more information on how estimates of incidence are calculated, please see COVID-19 Infection Survey: methods and further information.
In Scotland, during the week 17 to 23 October 2021, it is estimated that there were 10.85 new PCR-positive coronavirus (COVID-19) cases per 10,000 people per day (95% credible interval: 7.77 to 14.35). This equates to 5,700 new positive cases in Scotland per day (95% credible interval: 4,100 to 7,600). The trend in the incidence of new PCR positive COVID-19 cases is uncertain in the most recent week.
Modelled daily estimates of incidence rates, and accompanying credible intervals, are represented in Figure 6 by the blue line and grey shading. The model smooths the series to understand the trend and will be revised to incorporate new test results. Modelled daily estimates are used to calculate the official reported/indicative estimate.
Official reported/indicative estimates of incidence rates, are based on the modelled estimate for the midpoint of the week. Indicative estimates are denoted by pale blue circles, while the official estimates are denoted by dark blue circles, in Figure 6 and 7. Indicative estimates are presented on the official estimates charts, but were not previously published.
Figure 6: modelled daily estimates and official reported/indicative estimates of incidence rates in Scotland between 16 September and 27 October 2021, including 95% credible intervals (see notes 4,5,6,11,13)
Figure 7: official reported/indicative estimates of incidence rates in Scotland between 25 October 2020 and 23 October 2021, including 95% credible intervals (see notes 4,5,6,13)
Estimated percentages of those testing positive for COVID-19 by variant
Since the end of July 2021, infections compatible with the Delta variant have been the most common in all four UK countries. The most recent results show that over 99% of all COVID-19 infections detected in this study where a genetic sequence was obtained were the Delta variant or a genetic descendant/sub-lineage of the Delta variant. These all have the same gene positivity pattern. Because of this high proportion with the same gene positivity pattern, ONS have not included a breakdown of infections by variant based on gene positivity patterns from swab tests. ONS last published their main variant analysis on the 23 July 2021, where more details can be found. Infections by variant will continue to be monitored and will reintroduce the charts and analysis by gene matching pattern when considered helpful.
The World Health Organisation (WHO) have suggested new names for Variants of Concern and Variants of Interest to assist with public discussions of the variants, which can be found as a table on the WHO website.
Whole Genome Sequencing analysis was produced by research partners at the University of Oxford, for more details please see the report on the ONS website.
Further information
The latest estimate of the proportion of those living in private residential households aged 16 and over in Scotland who would have tested positive for COVID-19 antibodies was published on 10 November 2021 on the Scottish Government website and ONS website.
An article on the prevalence of ongoing symptoms following coronavirus (COVID-19) infection in the UK was published on the ONS website on 4 November 2021. The article includes estimates of the prevalence of self-reported "long COVID", and the duration of ongoing symptoms following confirmed coronavirus infection, using UK Coronavirus (COVID-19) Infection Survey data to 2 October 2021.
A technical article on updated estimates of the prevalence of post-acute symptoms among people with coronavirus (COVID-19) – commonly known as “long COVID” – in the UK was published on the ONS website on 16 September 2021. This article contains experimental estimates from three approaches to estimating the percentage of people testing positive for coronavirus (COVID-19) and who experience symptoms four or more weeks after infection, broken down by demographic and viral characteristics, using UK Coronavirus Infection Survey data. Please note that the estimates in this article are presented as percentages of those testing positive for COVID-19, and are not comparable to the estimates published on 4 November which are presented as percentages of the private residential population.
An article on how often individuals are reporting social contact with other people outside their own household, either socially distanced or physical contact was published on 21 October 2021 on the Scottish Government website and the ONS website. This article also includes estimates of the percentage of people testing positive that reported symptoms and the likelihood of reporting specific symptoms by nation. The article on the ONS website also includes analysis on the characteristics of people who are more likely to test positive for coronavirus.
A technical article on predictors of positivity across countries of the UK for coronavirus was published on the ONS website on 28 October 2021. The article presents the methods and results of analysis to identify characteristics of people who are more likely to test positive for coronavirus (COVID-19) in Wales, Northern Ireland, and Scotland. It screens the different characteristics of people sampled in the Coronavirus (COVID-19) Infection Survey (CIS) who have and have not tested positive for COVID-19 and uses a statistical model to assign risk to each of these characteristics.
A technical article on positivity after vaccination (UK) was published on 17 June on the ONS website.
How this data can be used
The data can be used for:
- estimating the number of current positive cases in the private residential population, including cases where people do not report having any symptoms
- estimating the number of new cases and change over time in positive cases
The data cannot be used for:
- measuring the number of cases and infections in care homes, hospitals and other communal establishments
- estimating the number of positive cases and new infections in smaller geographies, such as towns and cities
- providing information about recovery time of those infected
Methodology
The results are based on nose and throat swabs provided by participants to the study, obtained from fieldwork which started in Scotland on 21 September 2020.
The results are for private households only, and do not apply to those in hospitals, care homes or other communal establishments. The population used in this analysis relates to the private residential population aged two years and over.
In the latest six-week period, there were 55,321 swab tests from 33,676 people, with a total of 614 positive tests in 571 people from 448 households. In the latest two-week period, there were 15,194 swab tests from 14,509 people, with a total of 152 positive tests in 145 people from 120 households.
The COVID-19 Infection Survey bulletins and datasets available on the ONS website also include results for England, Wales and Northern Ireland.
The Welsh Government and the Department of Health in Northern Ireland also publish results from the COVID-19 Infection Survey for Wales and Northern Ireland respectively:
Further details on the methodology used can be found on the ONS website.
Notes
1. The ratios presented are rounded to the nearest 100 if over 1,000, to the nearest 10 if under 1,000 and to the nearest 5 if under 100. These ratios do not represent a person's risk of becoming infected, since risk of infection depends on a number of factors such as contact with others or whether a person has been vaccinated.
2. There is more uncertainty around estimates for the latest three reported days (as shown by the vertical dashed line), as lab results for this period are still being processed at the time of publication. Additional swab tests that become available after this publication are included in subsequent models, meaning that modelled estimates can change as additional data is included.
3. Modelled estimates are not directly comparable with the 14-day weighted estimates provided in the accompanying dataset on the ONS website. The 14-day weighted estimates underpin the modelled estimates and are provided for context. 14-day weighted estimates are not directly comparable with the weekly modelled estimates due to the differing methodology, however they have been included in Figure 2 as they were reported as the official estimates for Scotland before the weekly modelled estimates became available.
4. The model used to provide these estimates is a Bayesian model: these provide 95% credible intervals. A credible interval gives an indication of the uncertainty of an estimate from data analysis. 95% credible intervals are calculated so that there is a 95% probability of the true value lying in the interval. A credible interval gives an indication of the degree of uncertainty of an estimate, showing the precision of a sample estimate.
5. Because of the relatively small number of tests and a low number of positives in the sample, credible intervals are wide and therefore results should be interpreted with caution.
6. The blue line and shading represent the modelled trend and credible intervals based on the latest data. The point estimates and error bars represent the official weekly estimates and their credible intervals, which are based on the modelled estimate for the midpoint of the week at the time of publication.
7. As there was no publication on 15 January 2021 there are no official estimates available for the week ending 9 January 2021. However, ONS conducted some additional analysis to assess what the estimate may have been, therefore this estimate is included in Figure 2, shown in light grey.
8. A confidence interval gives an indication of the degree of uncertainty of an estimate, showing the precision of a sample estimate. The 95% confidence intervals are calculated so that if we repeated the study many times, 95% of the time the true unknown value would lie between the lower and upper confidence limits. A wider interval indicates more uncertainty in the estimate.
9. The table below contains the composition of each CIS region in Scotland, by Health Board and Local Authority area. Local Authority areas map to the Health Board areas.
| CIS Region Code |
Health Boards |
Local Authority Areas |
| 123 |
NHS Grampian, NHS Highland, NHS Orkney, NHS Shetland and NHS Western Isles |
Aberdeen City, Aberdeenshire, Argyll & Bute, Highland, Moray, Na h-Eileanan Siar, Orkney Islands, Shetland Islands |
| 124 |
NHS Fife, NHS Forth Valley and NHS Tayside |
Angus, Clackmannanshire, Dundee City, Falkirk, Fife, Perth & Kinross, Stirling |
| 125 |
NHS Greater Glasgow & Clyde |
East Dunbartonshire, East Renfrewshire, Glasgow City, Inverclyde, Renfrewshire, West Dunbartonshire |
| 126 |
NHS Lothian |
City of Edinburgh, East Lothian, Midlothian, West Lothian |
| 127 |
NHS Lanarkshire |
North Lanarkshire, South Lanarkshire |
| 128 |
NHS Ayrshire & Arran, NHS Borders and NHS Dumfries & Galloway |
Dumfries & Galloway, East Ayrshire, North Ayrshire, Scottish Borders, South Ayrshire |
10. Sub-regional estimates are based on a different model to our headline estimates. Our sub-regional estimates are calculated as an average over a seven-day period and should not be compared to our headline positivity estimates which are for a single reference date. Therefore, the sub-regional figures may differ from the headline estimates because they are averaged over a longer time period. If a trend is changing, the figures shown in Figure 5 may not reflect the change we are seeing in our headline estimates.
11. There is more uncertainty around incidence estimates for the latest seven reported days (as shown by the vertical dashed line), as modelled estimates can change as additional data is included.
12. Please note, due to different trends across the four countries, Wales, Scotland and Northern Ireland have been modelled separately to England. In previous weeks, Northern Ireland has been modelled separately, and England, Wales and Scotland have been modelled together. England’s sub-regional estimates have been modelled with Wales and Scotland included.
13. Please note, no incidence rate estimates were provided in the release on 3 September 2021, for data relating to the week 7 to 13 August 2021, due to the August bank holiday in England and Wales.
14. Please note that a new category was added on the scale of this map in the 24 September 2021 publication – the “1.50% to <2.00%” category has been split into the “1.50% to <1.75%” and “2.75% to <2.00%” categories.
15. Estimates are based on confirmed positive test results. The remaining swabs are either negative, inconclusive or test failures. ONS are working with the laboratories to understand consistency in the identification of inconclusive results, that could be weak positive results. The impact of this on our estimates of positive infections is likely to be very small and unlikely to affect the trend.