Coronavirus (COVID-19): ONS Infection Survey – characteristics data for Scotland – 11 May 2022
Characteristics data from the ONS COVID-19 infection survey published on 11 May 2022.
The article is based on findings from the Office for National Statistics (ONS) COVID-19 Infection Survey.
The COVID-19 Infection Survey aims to measure:
- how many people test positive for COVID-19 infection at a given point in time, regardless of whether they report experiencing coronavirus symptoms
- the average number of new infections per week over the course of the study
- the number of people who test positive for antibodies, to indicate how many people are ever likely to have had the infection or have been vaccinated
The Office for National Statistics (ONS) publish analysis of the characteristics of those testing positive for COVID-19 in England, Wales, Northern Ireland, Scotland and the UK on their website.
The underlying data displayed in the charts in this publication is available in the reference tables on the ONS website.
All results are provisional and subject to revision.
Main points
In Scotland, the number of socially distanced and physical contacts adults reported with other adults has increased since January 2022.
Trends in the contacts of children vary over time and are likely to be primarily driven by the timing of school holidays.
In Scotland, 67.0% of people living in private residential households who tested positive for COVID-19 with a strong positive test between 1 February and 24 April 2022 reported having any symptoms (95% confidence interval: 65.5% to 68.5%).
The most commonly experienced symptoms in those living in private residential households in Scotland were a cough, a sore throat, a headache and fatigue or weakness.
Socially distanced and physical contacts - Scotland
This analysis looks at how often individuals are reporting social contact with other people outside their own household, either socially distanced or physical contact. As part of survey visits, individuals were asked how many people outside their household, aged 17 years and under, 18 to 69 years, and 70 years and over, they had had contact with up to seven days prior to each study visit.
Contact refers to either of the following:
- socially distanced contact – direct contact with social distancing only
- physical contact – physical contact, such as a handshake or personal care, including wearing personal protective equipment (PPE)
In this article, fortnightly estimates are available for the time period from 10 to 23 April 2022. Data on socially distanced and physical contacts for Scotland was previously presented in an article published on 13 April 2022.
Estimates have been weighted to be representative of the total population in Scotland. Analysis includes all people taking part in the survey. The survey only includes those living in private residential households. Contact analysis is presented for school-age children (age two years to school year S4) and adults (school year S5 and above).
The number of contacts is reported in the following groups:
- 0 (no reported contacts)
- 1 to 5 (reported contacts)
- 6 to 10 (reported contacts)
- 11 to 20 (reported contacts)
- 21 or more (reported contacts)
School-age children
The proportions of school-age children reporting each category of number of physical and socially distanced contacts are shown in Figures 1 and 2 respectively. In Figures 1 to 4, each bar represents one two-week period.
Trends in the contacts of children vary over time and are likely to be primarily driven by the timing of school holidays.
Figure 1: Proportion of school-age children by number of physical contacts with different age groups, from 27 September 2020 to 23 April 2022
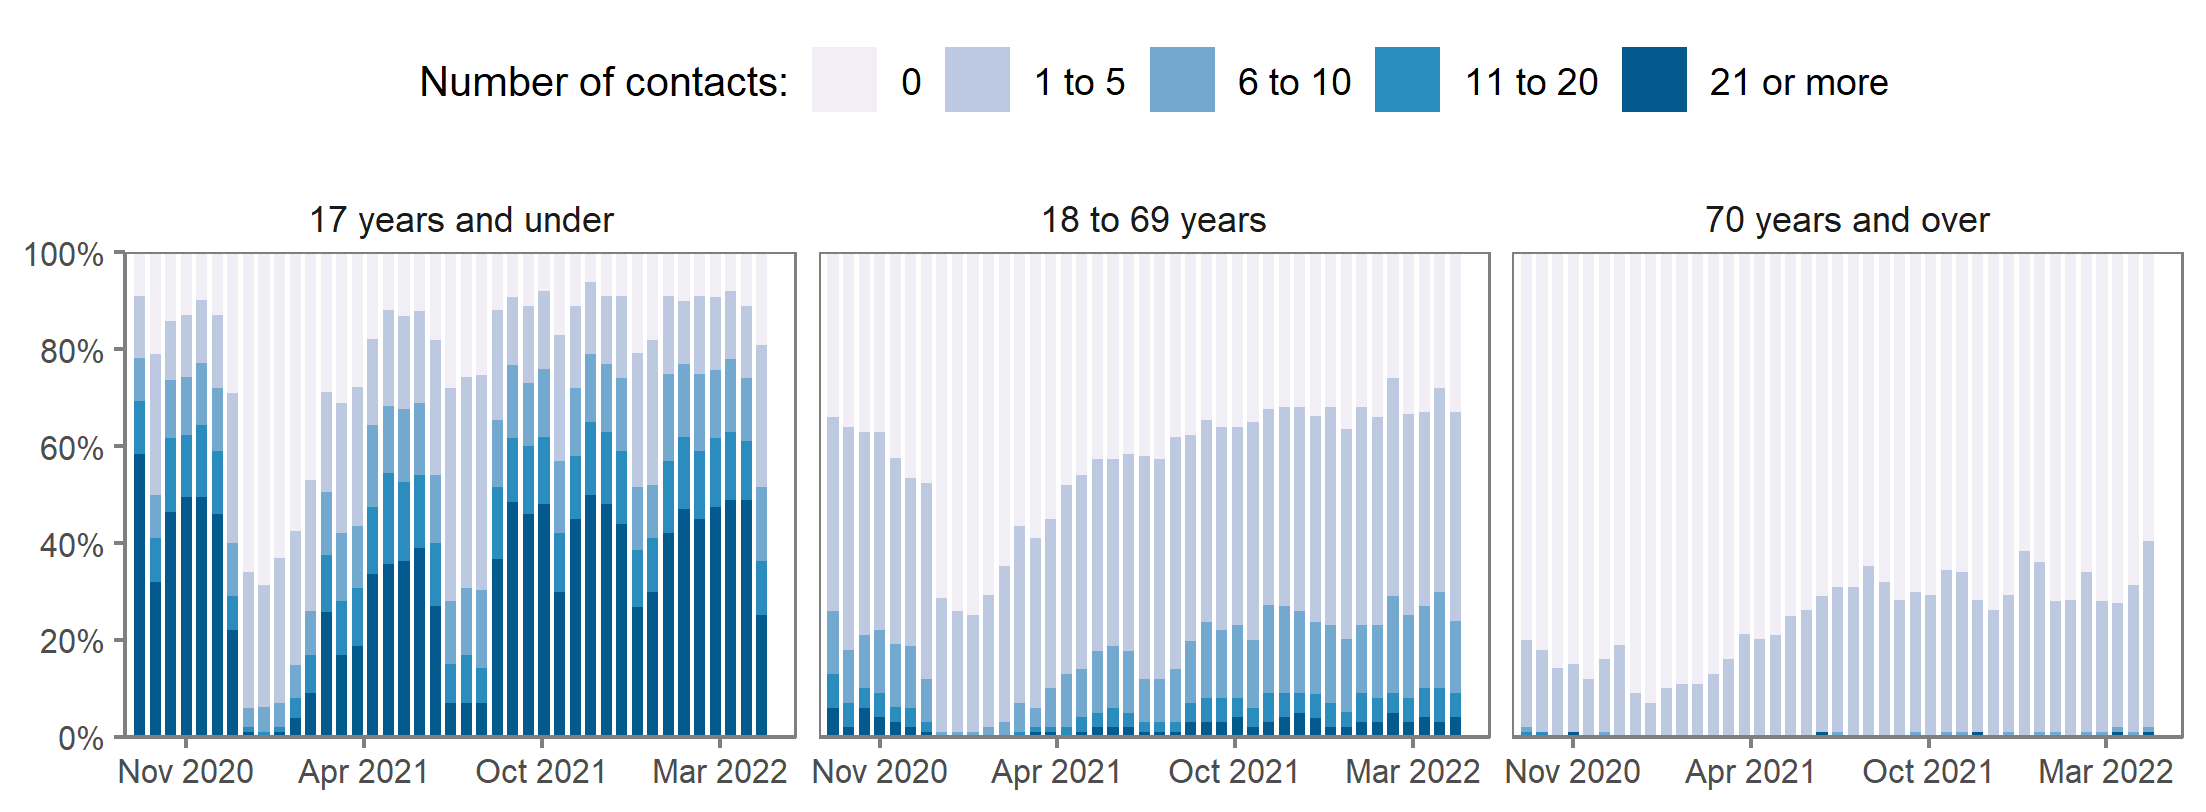 Figure 2: Proportion of school-age children by number of socially distanced contacts with different age groups, from 27 September 2020 to 23 April 2022
Adults
The proportions of adults reporting each category of number of physical and socially distanced contacts are shown in Figures 3 and 4 respectively.
In Scotland, the number of socially distanced and physical contacts adults reported with other adults has increased since January 2022.
Figure 3: Proportion of adults by number of physical contacts with different age groups, from 27 September 2020 to 23 April 2022
Figure 4: Proportion of adults by number of socially distanced contacts with different age groups, from 27 September 2020 to 23 April 2022
Symptom profile of people who tested positive for COVID-19 in Scotland
This analysis considers individuals with any positive test, including repeated positive tests, that had a high viral load (Ct value (see note 2) less than 30) between 1 February and 24 April 2022 in Scotland.
Individuals taking part in the survey were asked at each visit whether they had experienced a range of possible symptoms in the seven days before they were tested, and also separately whether they felt that they had symptoms compatible with COVID-19 infection in the last seven days. This analysis considers all symptoms reported at visits within 35 days of the first positive test of the episode.
This includes symptoms reported even when there is a negative test within this timeframe or a positive test with a higher Ct value. Data for the whole UK, for each nation and for the UK split by variant is available in the article published on the ONS website, along with more details on the methods used in this analysis.
In Scotland, 67.0% of people living in private residential households who tested positive for COVID-19 with a strong positive test between 1 February and 24 April 2022 reported having any symptoms (95% confidence interval: 65.5% to 68.5%).
The most commonly experienced symptoms in those living in private residential households in Scotland were a cough, a sore throat, a headache and fatigue or weakness.
At the UK level, the percentage of people testing positive who reported "classic" symptoms remained at similar levels in March and April 2022. The percentage of people testing positive who reported loss of taste or smell decreased sharply between December 2021 and January 2022 and remained at a lower level in April 2022. This decrease coincided with increasing infections with the Omicron variants of COVID-19. The percentage of people testing positive who reported gastrointestinal symptoms decreased slightly in December 2021 and has remained unchanged since then.
The full article which includes reported symptoms across the UK can be accessed on the ONS website.
The data presented are unweighted percentages of people with any positive test result that had a Ct value less than 30.
Figure 5: Unweighted percentage of people with a strong positive test for COVID-19 who reported having any symptoms and no symptoms, in each of the four nations of the UK, from 1 February 2022 to 24 April 2022, including 95% confidence intervals
Figure 6: Unweighted percentage of people with a strong positive test for COVID-19, by grouped symptoms, from 1 February 2022 to 24 April 2022 in Scotland, including 95% confidence intervals
Figure 7: Unweighted percentage of people with a strong positive test for COVID-19, by symptom, from 1 February 2022 to 24 April 2022 in Scotland, including 95% confidence intervals
Methodology and further information
- The population relates to those living in private residential households aged two years and over, and excludes those in hospitals, care homes and/or other communal establishments.
- The symptom profile analysis looks at symptoms associated with positive episodes (including repeated positive tests) with any Ct value in the episode below 30. This is to exclude the possibility that symptoms are not identified when an individual tests positive as it is very early on or later on in the infection.
- The symptom profile analysis is based on data collected at each study visit where participants are asked to report their symptoms in the previous 7 days.
- The symptom profile analysis shows the proportion of individuals testing positive who reported experiencing symptoms at study visits within 35 days of their first positive test.
- Symptoms are self-reported and were not professionally diagnosed.
- Because of the relatively small number of tests and a low number of positives in the sample, confidence intervals are wide and therefore results should be interpreted with caution.
- SARS-CoV-2 is the scientific name given to the specific virus that causes COVID-19.
- Estimates are provided with 95% confidence intervals to indicate the level of uncertainty around them. A confidence interval gives an indication of the degree of uncertainty of an estimate, showing the precision of a sample estimate. The 95% confidence intervals are calculated so that if we repeated the study many times, 95% of the time the true unknown value would lie between the lower and upper confidence limits. A wider interval indicates more uncertainty in the estimate.
- Please note that the sampling method used in Northern Ireland is different to the other nations, inviting only people who have previously participated in a Northern Ireland Statistics and Research Agency (NISRA) survey, which could result in a sample of individuals who are less likely to report symptoms.
The full article published by the ONS on 11 May 2022, which includes data for England, Wales and Northern Ireland, can be accessed on the ONS website. The full article also includes UK level analysis of characteristics associated with testing positive, reinfections, risk factors of reinfections and on reported symptoms over time.
More information about the COVID-19 Infection Survey in Scotland can be found on the information page on the Scottish Government website, and previous COVID-19 Infection Survey data for Scotland can be found in this collection.