Coronavirus (COVID-19): ONS Infection Survey – characteristics data for Scotland – 28 July 2021
The article is based on findings from the Office for National Statistics (ONS) COVID-19 Infection Survey.
The COVID-19 Infection Survey aims to measure:
- how many people test positive for COVID-19 infection at a given point in time, regardless of whether they report experiencing coronavirus symptoms
- the average number of new infections per week over the course of the study
- the number of people who test positive for antibodies, to indicate how many people are ever likely to have had the infection or have been vaccinated
The results are for private households only, and do not apply to those in hospitals, care homes or other institutional settings. The population used in this analysis relates to the community population aged two years and over.
The Office for National Statistics (ONS) publish analysis of the characteristics of those testing positive for COVID-19 in England, Wales, Northern Ireland, Scotland and the UK.
The underlying data displayed in the charts in this publication is available in the reference tables on the ONS website.
Main points
In the community population in Scotland, 58.2% of people who tested positive for COVID-19 with a strong positive test between 1 December 2020 and 12 July 2021 reported having any symptoms (95% confidence interval: 53.7% to 62.6%).
The most commonly experienced symptoms in the community population in Scotland were fatigue or weakness, headache and a cough.
Physical contacts that adult respondents in Scotland have reported have increased since early March, and socially distanced contacts follow a similar trend.
Physical contacts that school age respondents in Scotland have reported have also gradually increased since March, with a dip in mid-April and in early July, corresponding with school holidays. Socially distanced contacts that school age children have reported follow a similar trend.
Symptom profile of people who tested positive for COVID-19 in Scotland
This analysis considers individuals with any positive test, including repeated positive tests, that had a high viral load (Ct value (please see footnote 2) less than 30) between 1 December 2020 and 12 July 2021 in Scotland.
Individuals taking part in the survey were asked at each visit whether they had experienced a range of possible symptoms in the seven days before they were tested, and also separately whether they felt that they had symptoms compatible with COVID-19 infection in the last seven days. This analysis considers all symptoms reported at visits within 35 days of the first positive test of the episode.
This includes symptoms reported even when there is a negative test within this timeframe or a positive test with a higher Ct value. UK data, split by nation and for the whole UK, is available in the article published on the ONS website, along with more details on the methods used in this analysis.
In the community population in Scotland, 58.2% of people who tested positive for COVID-19 with a strong positive test between 1 December 2020 and 12 July 2021 reported having any symptoms (95% confidence interval: 53.7% to 62.6%).
The data presented are unweighted percentages of people with any positive test result that had a Ct value less than 30.
Over half the people who are estimated to have tested positive for COVID-19 with a strong positive test reported having some symptoms within 35 days of the test in England, Wales and Scotland.
Results should be interpreted with caution for Scotland, Wales and Northern Ireland because of smaller sample sizes of people who have a strong positive test (Ct less than 30) than for England, resulting in wider confidence intervals.
Figure 1: Unweighted percentage of people with a strong positive test for COVID-19 who reported having any symptoms and no symptoms, in each of the four nations of the UK, from 1 December 2020 to 12 July 2021 including 95% confidence intervals
Figure 2 shows that people who tested positive for COVID-19 with a strong positive test were more likely to report ‘classic’ Covid-19 symptoms (cough, fever, loss of taste or loss of smell) than gastrointestinal symptoms, or loss of taste or smell only.
Figure 2: Unweighted percentage of people with a strong positive test for COVID-19, by grouped symptoms, from 1 December 2020 to 12 July 2021 in Scotland, including 95% confidence intervals
Figure 3 shows that fatigue or weakness, headache and a cough were the most common symptoms reported in strong positive COVID-19 cases in Scotland. Abdominal pain, diarrhoea and nausea or vomiting were less commonly reported symptoms in strong positive COVID-19 cases. Similar patterns in reported symptoms can be seen across all four UK countries.
Figure 3: Unweighted percentage of people with a strong positive test for COVID-19, by symptom, from 1 December 2020 to 12 July 2021 in Scotland, including 95% confidence intervals
Socially distanced and physical contacts - Scotland
This analysis at how often individuals are reporting social contact with other people outside their own household, either socially distanced or physical contact. As part of survey visits, individuals were asked how many people outside their household, aged 17 years and under, 18 to 69 years, and 70 years and over, they had had contact with up to seven days prior to each study visit.
Contact refers to either of the following:
- Socially distanced contact – direct contact with social distancing only
- Physical contact – physical contact, such as a handshake or personal care, including wearing personal protective equipment (PPE)
In this article, fortnightly estimates are available for the time period between 20 September 2020 to 10 July 2021. Data on socially distanced and physical contacts for Scotland was previously presented on 30 June 2021.
Estimates have been weighted to be representative of the total population in Scotland. Analysis includes all people taking part in the survey. The survey only includes those in the community population. Contact analysis is presented for school-age children (age two years to school year S4) and adults (school year S5 and above).
The number of contacts is reported in the following groups:
- 0 (no reported contacts)
- 1 to 5 (reported contacts)
- 6 to 10 (reported contacts)
- 11 to 20 (reported contacts)
- 21 or more (reported contacts)
School-age children
The proportions of school-age children reporting each category of number of physical and socially distanced contacts are shown in Figures 4 and 5 respectively.
Physical contacts that school age respondents in Scotland have reported has also gradually increased since March, with a dip in mid-April and in early July, corresponding with school holidays. Socially distanced contacts that school age children have reported follows a similar trend.
In Figures 4 to 7 each bar represents one two-week period, denoted by the end date of that period. For example, 10 July 2021 denotes the estimate relating to 27 June to 10 July 2021.
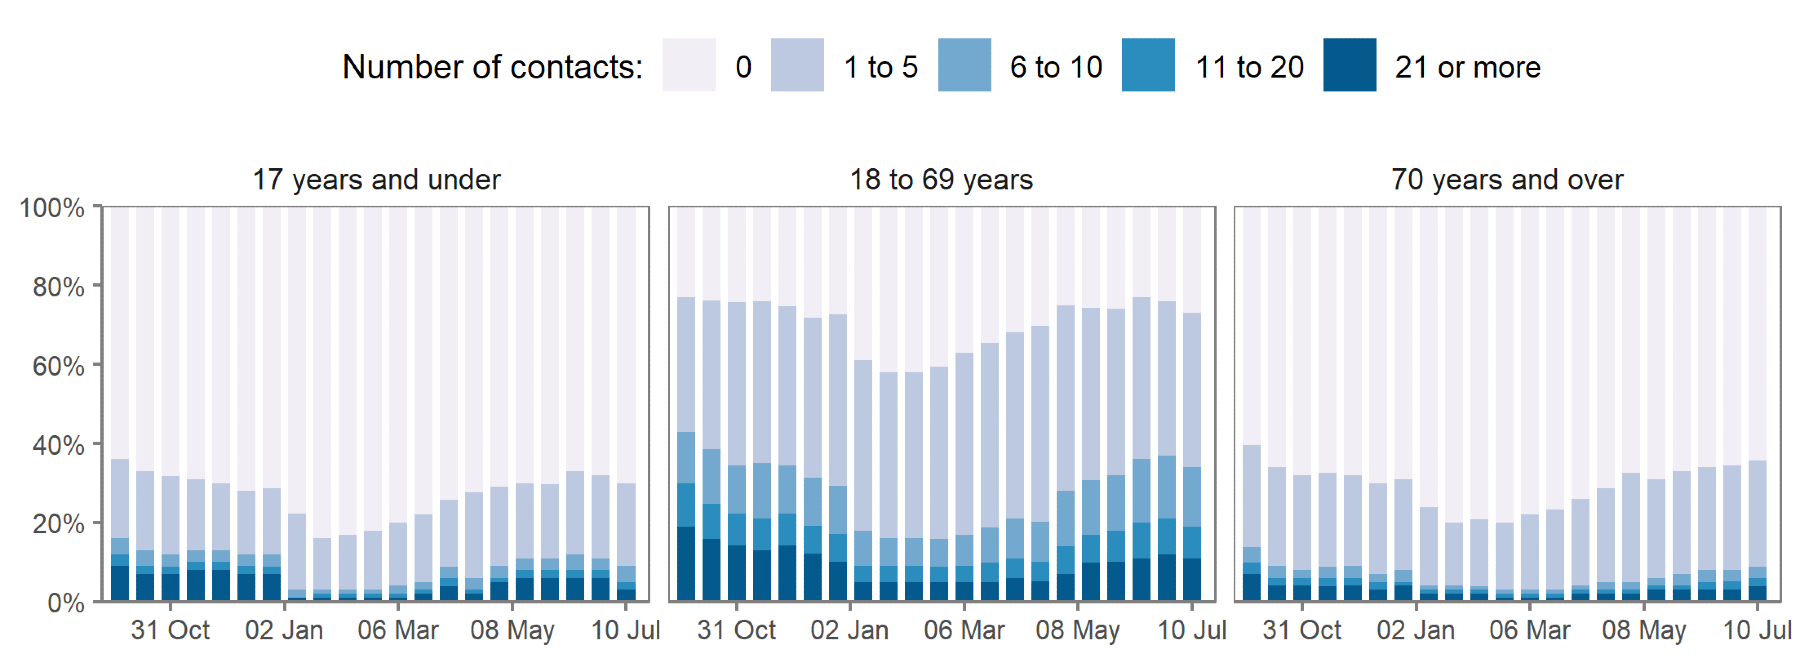
Figure 4: Proportion of school-age children by number of physical contacts with different age groups, from 20 September 2020 to 10 July 2021
Figure 5: Proportion of school-age children by number of socially distanced contacts with different age groups, from 20 September 2020 to 10 July 2021
Adults
The proportions of adults reporting each category of number of physical and socially distanced contacts are shown in Figures 6 and 7 respectively.
Physical contacts that adult respondents in Scotland have reported has increased since early March, and socially distanced contacts follows a similar trend.
Figure 6: Proportion of adults by number of physical contacts with different age groups, from 20 September 2020 to 10 July 2021
Figure 7: Proportion of adults by number of socially distanced contacts with different age groups, from 20 September 2020 to 10 July 2021
 Methodology and further information
- The population relates to the community population (private households) aged two years and over, and does not include people in hospital, care homes or students in halls of residence, where rates of COVID-19 infection are likely to be different.
- The symptom profile analysis looks at symptoms associated with positive episodes (including repeated positive tests) with any Ct value in the episode below 30. This is to exclude the possibility that symptoms are not identified when an individual tests positive as it is very early on or later on in the infection. You can find more information on Ct values in a paper written by academic partners at the University of Oxford.
- The symptom profile analysis is based on data collected at each study visit where participants are asked to report their symptoms in the previous 7 days.
- The symptom profile analysis shows the proportion of individuals testing positive who reported experiencing symptoms at study visits within 35 days of their first positive test.
- Symptoms are self-reported and were not professionally diagnosed.
- Because of the relatively small number of tests and a low number of positives in the sample, confidence intervals are wide and therefore results should be interpreted with caution.
- SARS-CoV-2 is the scientific name given to the specific virus that causes COVID-19.
- Estimates are provided with 95% confidence intervals to indicate the level of uncertainty around them. A confidence interval gives an indication of the degree of uncertainty of an estimate, showing the precision of a sample estimate. The 95% confidence intervals are calculated so that if we repeated the study many times, 95% of the time the true unknown value would lie between the lower and upper confidence limits. A wider interval indicates more uncertainty in the estimate.
The full article was published by the Office for National Statistics on 28 July 2021, which includes data for England, Wales and Northern Ireland, can be accessed on the ONS website. The full article also includes analysis on reported symptoms across the UK, and COVID-19 positivity by patient-facing and non-patient facing job roles is also available at the UK level.
More information about the COVID-19 Infection Survey in Scotland can be found on the information page on the Scottish Government website, and previous COVID-19 Infection Survey data for Scotland can be found in this collection.
Contact
Scottish Government Covid-19 Infection Survey Team
covidinfectionsurvey@gov.scot