Coronavirus (COVID-19): ONS Infection Survey – antibody data - 28 April 2021
Antibody data from the ONS COVID-19 infection survey published on 28 April 2021.
This article presents an analysis of antibody prevalence, which can be used to identify individuals who have had COVID-19 in the past or who have developed antibodies as a result of vaccination. The article is based on findings from the Office for National Statistics (ONS) COVID-19 Infection Survey.
This data refers to the presence of antibodies to SARS-CoV-2 within the community population aged 16 and over; community in this instance refers to private residential households, and it excludes those in hospitals, care homes and/or other institutional settings. SARS-CoV-2 is the scientific name given to the specific virus that causes COVID-19. All results are provisional and subject to revision.
The COVID-19 Infection Survey aims to measure:
- how many people test positive for COVID-19 infection at a given point in time, regardless of whether they report experiencing coronavirus symptoms
- the average number of new infections per week over the course of the study
- the number of people who test positive for antibodies, to indicate how many people are ever likely to have had the infection or have been vaccinated
The Office for National Statistics (ONS) publish estimates for England, Wales, Northern Ireland and Scotland on their website.
The underlying data displayed in the charts in this publication is available in the reference tables on the ONS website.
Main points
In the week 5 to 11 April 2021, it is estimated that 57.8% of the community population in Scotland aged 16 and over would have tested positive for antibodies to SARS-CoV-2 from a blood sample (95% credible interval: 52.9% to 63.1%). Antibody positivity has continued to increase in Scotland.
In Scotland in the week 5 to 11 April 2021, the modelled percentage of people testing positive for antibodies to SARS-CoV-2 from a blood sample for those:
- aged 80 years and over was 79.8% (95% credible interval: 69.8% to 86.0%)
- aged 75 to 79 years was 76.4% (95% credible interval: 68.5% to 82.8%)
- aged 70 to 74 years was 81.4% (95% credible interval: 74.9% to 86.4%)
- aged 65 to 69 years was 85.1% (95% credible interval: 80.0% to 89.3%)
- aged 60 to 64 years was 80.1% (95% credible interval: 74.1% to 85.7%) and
- aged 50 to 59 years was 73.2% (95% credible interval: 66.5% to 80.3%)
The modelled percentage of people testing positive for antibodies for those aged 16 to 49 years ranged from 30.7% to 42.9%.
Information on this release
It is important to draw the distinction between testing positive for antibodies and having immunity. Following infection or vaccination, antibody levels can vary and sometimes increase but are still below the level identified as “positive” in our test, and other tests. This does not mean that a person has no protection against coronavirus (COVID-19) since an immune response does not rely on the presence of antibodies alone. We also do not yet know exactly how much antibodies need to rise to give protection. A person’s ‘T cell’ response will provide protection but is not detected by blood tests for antibodies.
Estimates on the proportion of people in the community population that have received at least one dose of a vaccine against SARS-CoV-2 are also reported, which helps show a clear pattern between vaccination and testing positive for antibodies.
ONS also present data on the estimated percentage of people aged 16 years and over who have received one or more doses of a COVID-19 vaccination since 14 December 2020 and the percentage of people aged 16 years and over who are fully vaccinated since 15 February 2021. The first COVID-19 vaccination was administered on 8 December 2020, but vaccination rates were too low to model until 14 December 2020. The estimates of the percentage of people vaccinated are based on modelling of the people visited in the COVID-19 Infection Survey in the community in a particular time period. These estimates are then adjusted (post-stratified) using population estimates to be representative (in the same way as for the antibody analysis).
It is important to note that this release contains estimates based on self-reported vaccines from the ONS COVID-19 Infection Survey and should not be used to track the progress of the vaccine rollout. Please see the latest daily vaccination data on the UK coronavirus dashboard to understand the progress of the vaccination programme across the UK.
Survey estimates refer to the community population, by which we mean private households only and excludes those in hospitals, care homes or other institutional settings. This data does not include those that live in care homes, one of the priority groups identified by the Joint Committee on Vaccination and Immunisation (JCVI).
There is high uncertainty around COVID-19 Infection Survey estimates due to the relatively small number of people included in this analysis, so caution should be taken in interpreting the results.
Further information on the methodology can be found at the end of this release.
Antibody data is a week behind vaccination data as there is a time lag on when antibody data is received, whereas vaccine data is self-reported and more readily available.
ONS have published analysis which examines behavioural changes following vaccination, among those over the age of 50, from 5 January to 10 April 2021 across all four UK countries.
Likelihood of testing positive for COVID-19 antibodies in Scotland
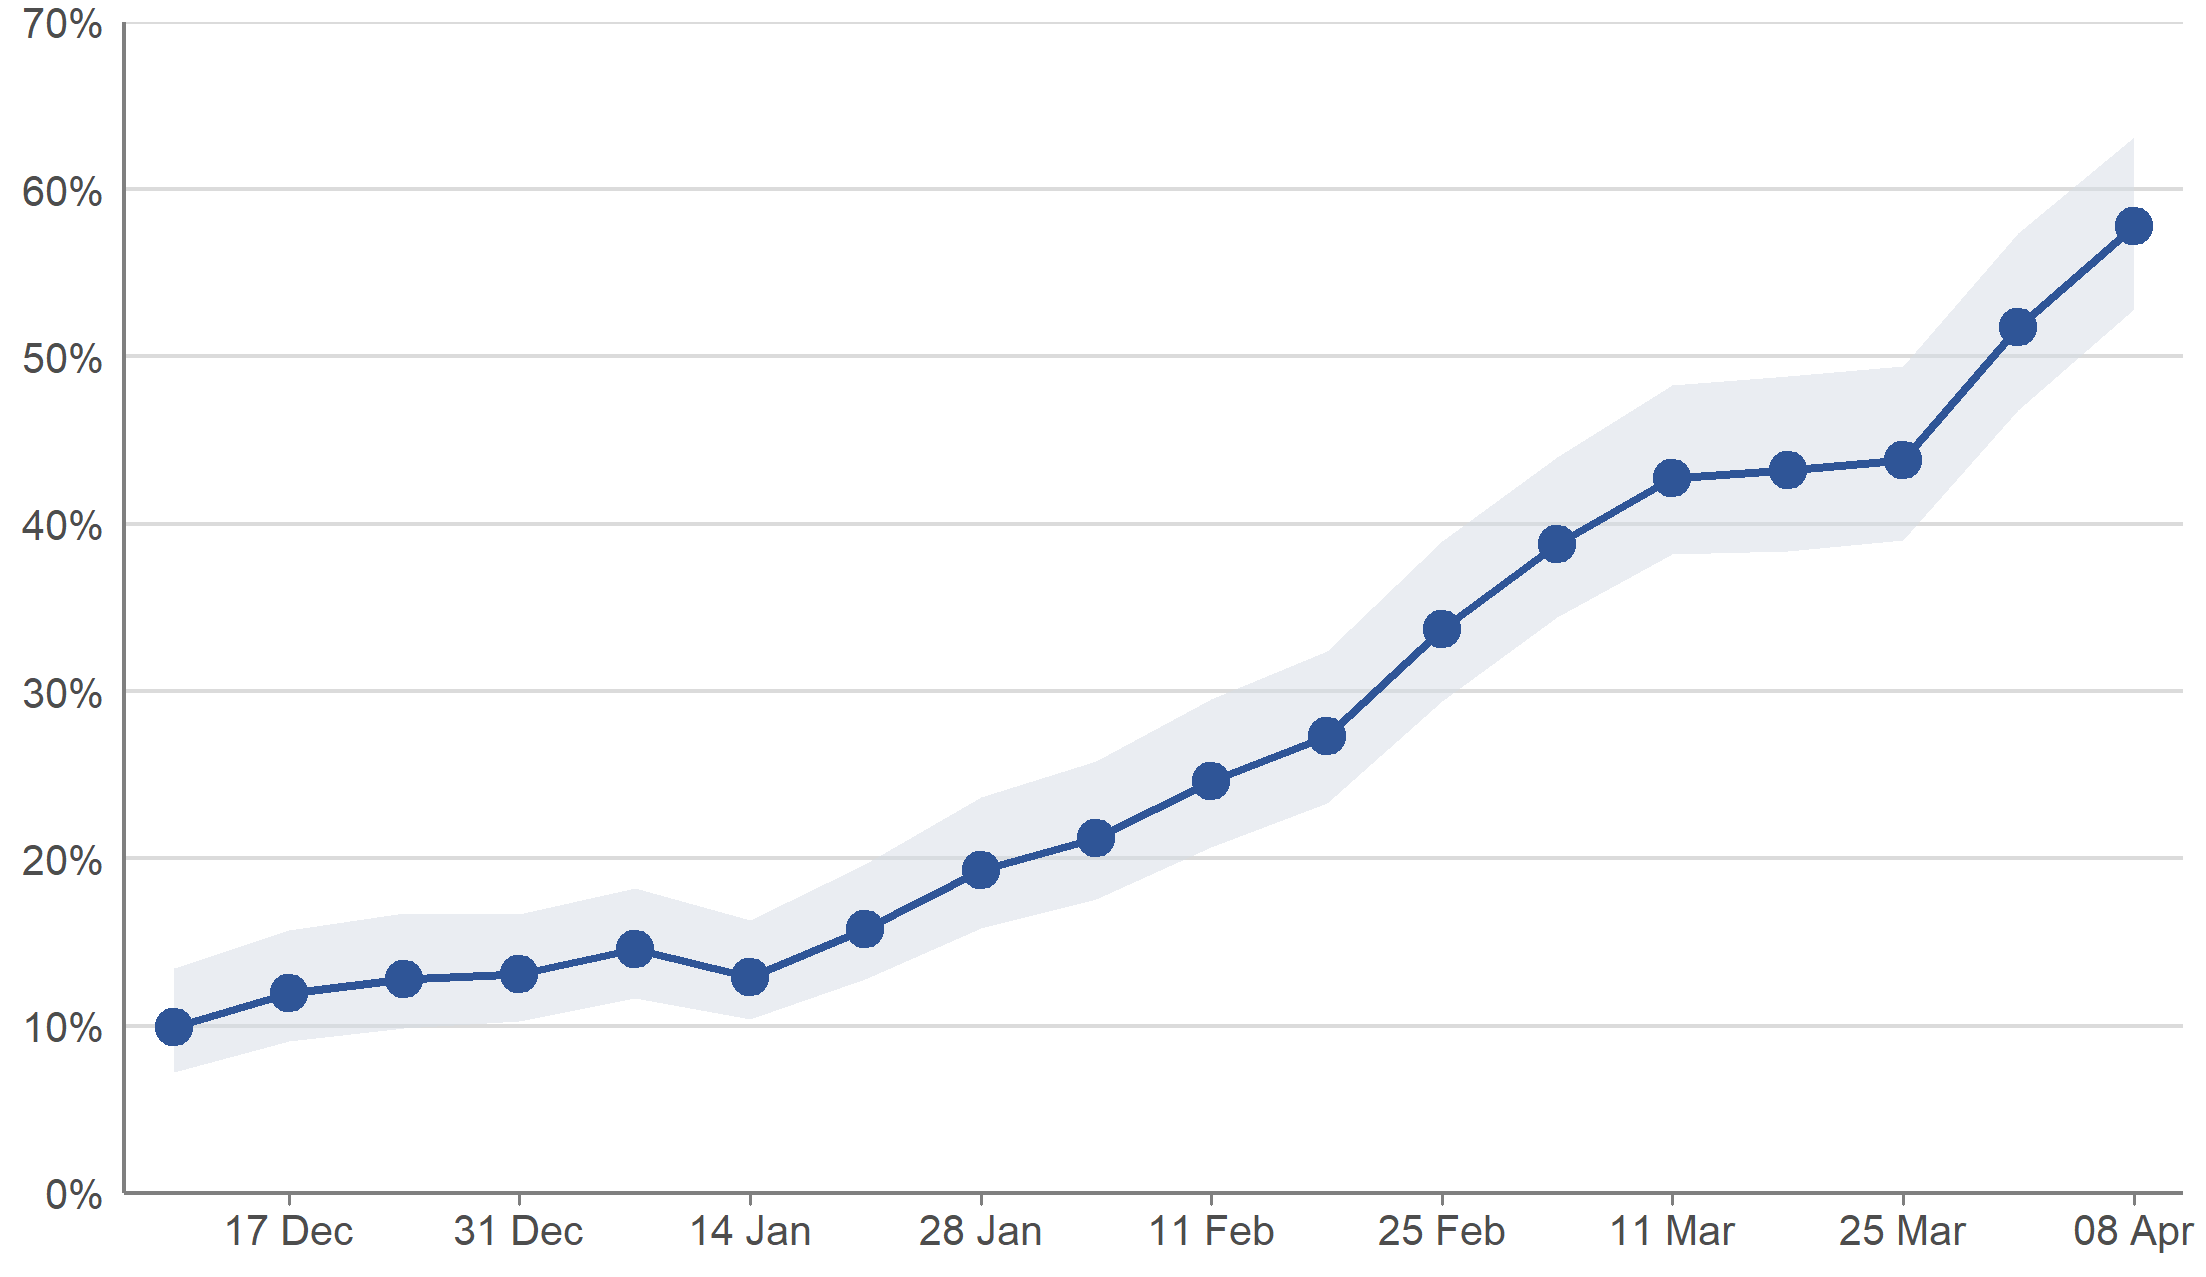
In the week 5 to 11 April 2021, it is estimated that 57.8% of the community population in Scotland aged 16 and over would have tested positive for antibodies to SARS-CoV-2 from a blood sample. A 95% credible interval for this estimate is 52.9% to 63.1%. Antibody positivity has continued to increase in Scotland.
Modelled weekly estimates of the percentage of people testing positive for antibodies to SARS-CoV-2 from a blood sample, are displayed in Figure 1 as estimates for the midpoint of the week.
Figure 1: Modelled weekly percentage of people testing positive for antibodies to SARS-CoV-2 from a blood sample, from 7 December 2020 to 11 April 2021, including 95% credible intervals
Age analysis on the likelihood of testing positive for COVID-19 antibodies in Scotland
In the week 5 to 11 April 2021, the modelled percentage of people testing positive for antibodies to SARS-CoV-2 from a blood sample for those:
- aged 80 years and over was 79.8% (95% credible interval: 69.8% to 86.0%)
- aged 75 to 79 years was 76.4% (95% credible interval: 68.5% to 82.8%)
- aged 70 to 74 years was 81.4% (95% credible interval: 74.9% to 86.4%)
- aged 65 to 69 years was 85.1% (95% credible interval: 80.0% to 89.3%)
- aged 60 to 64 years was 80.1% (95% credible interval: 74.1% to 85.7%) and
- aged 50 to 59 years was 73.2% (95% credible interval: 66.5% to 80.3%)
The modelled percentage of people testing positive for antibodies for those aged 16 to 49 years ranged from 30.7% to 42.9%
Figure 2: Modelled percentage of people testing positive for antibodies to SARS-CoV-2 from a blood sample, by age group, in the week 5 to 11 April 2021, including 95% credible intervals
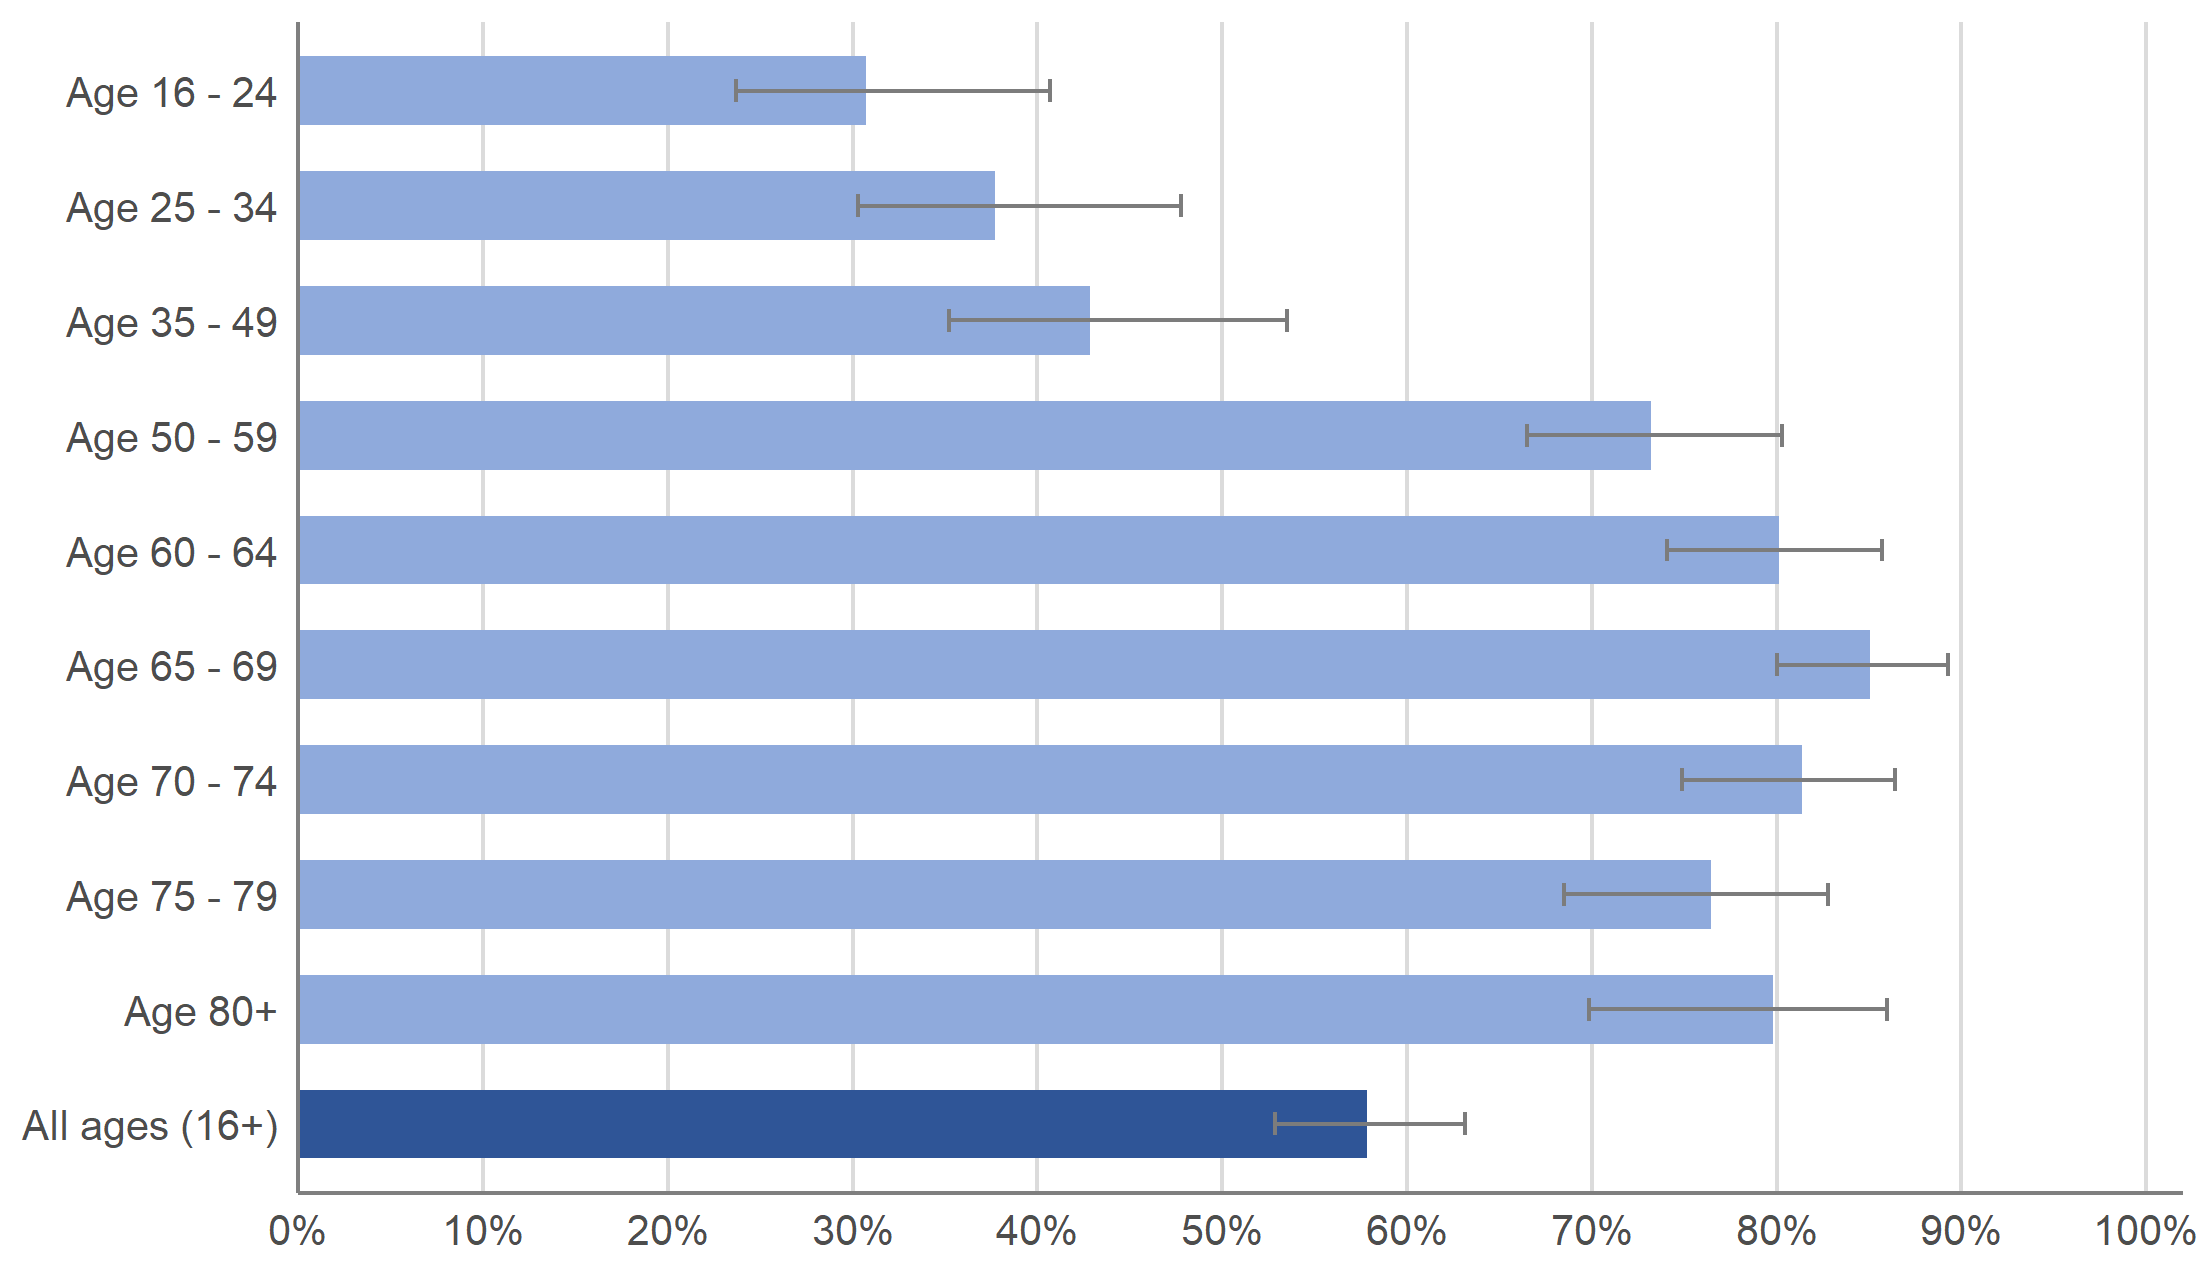
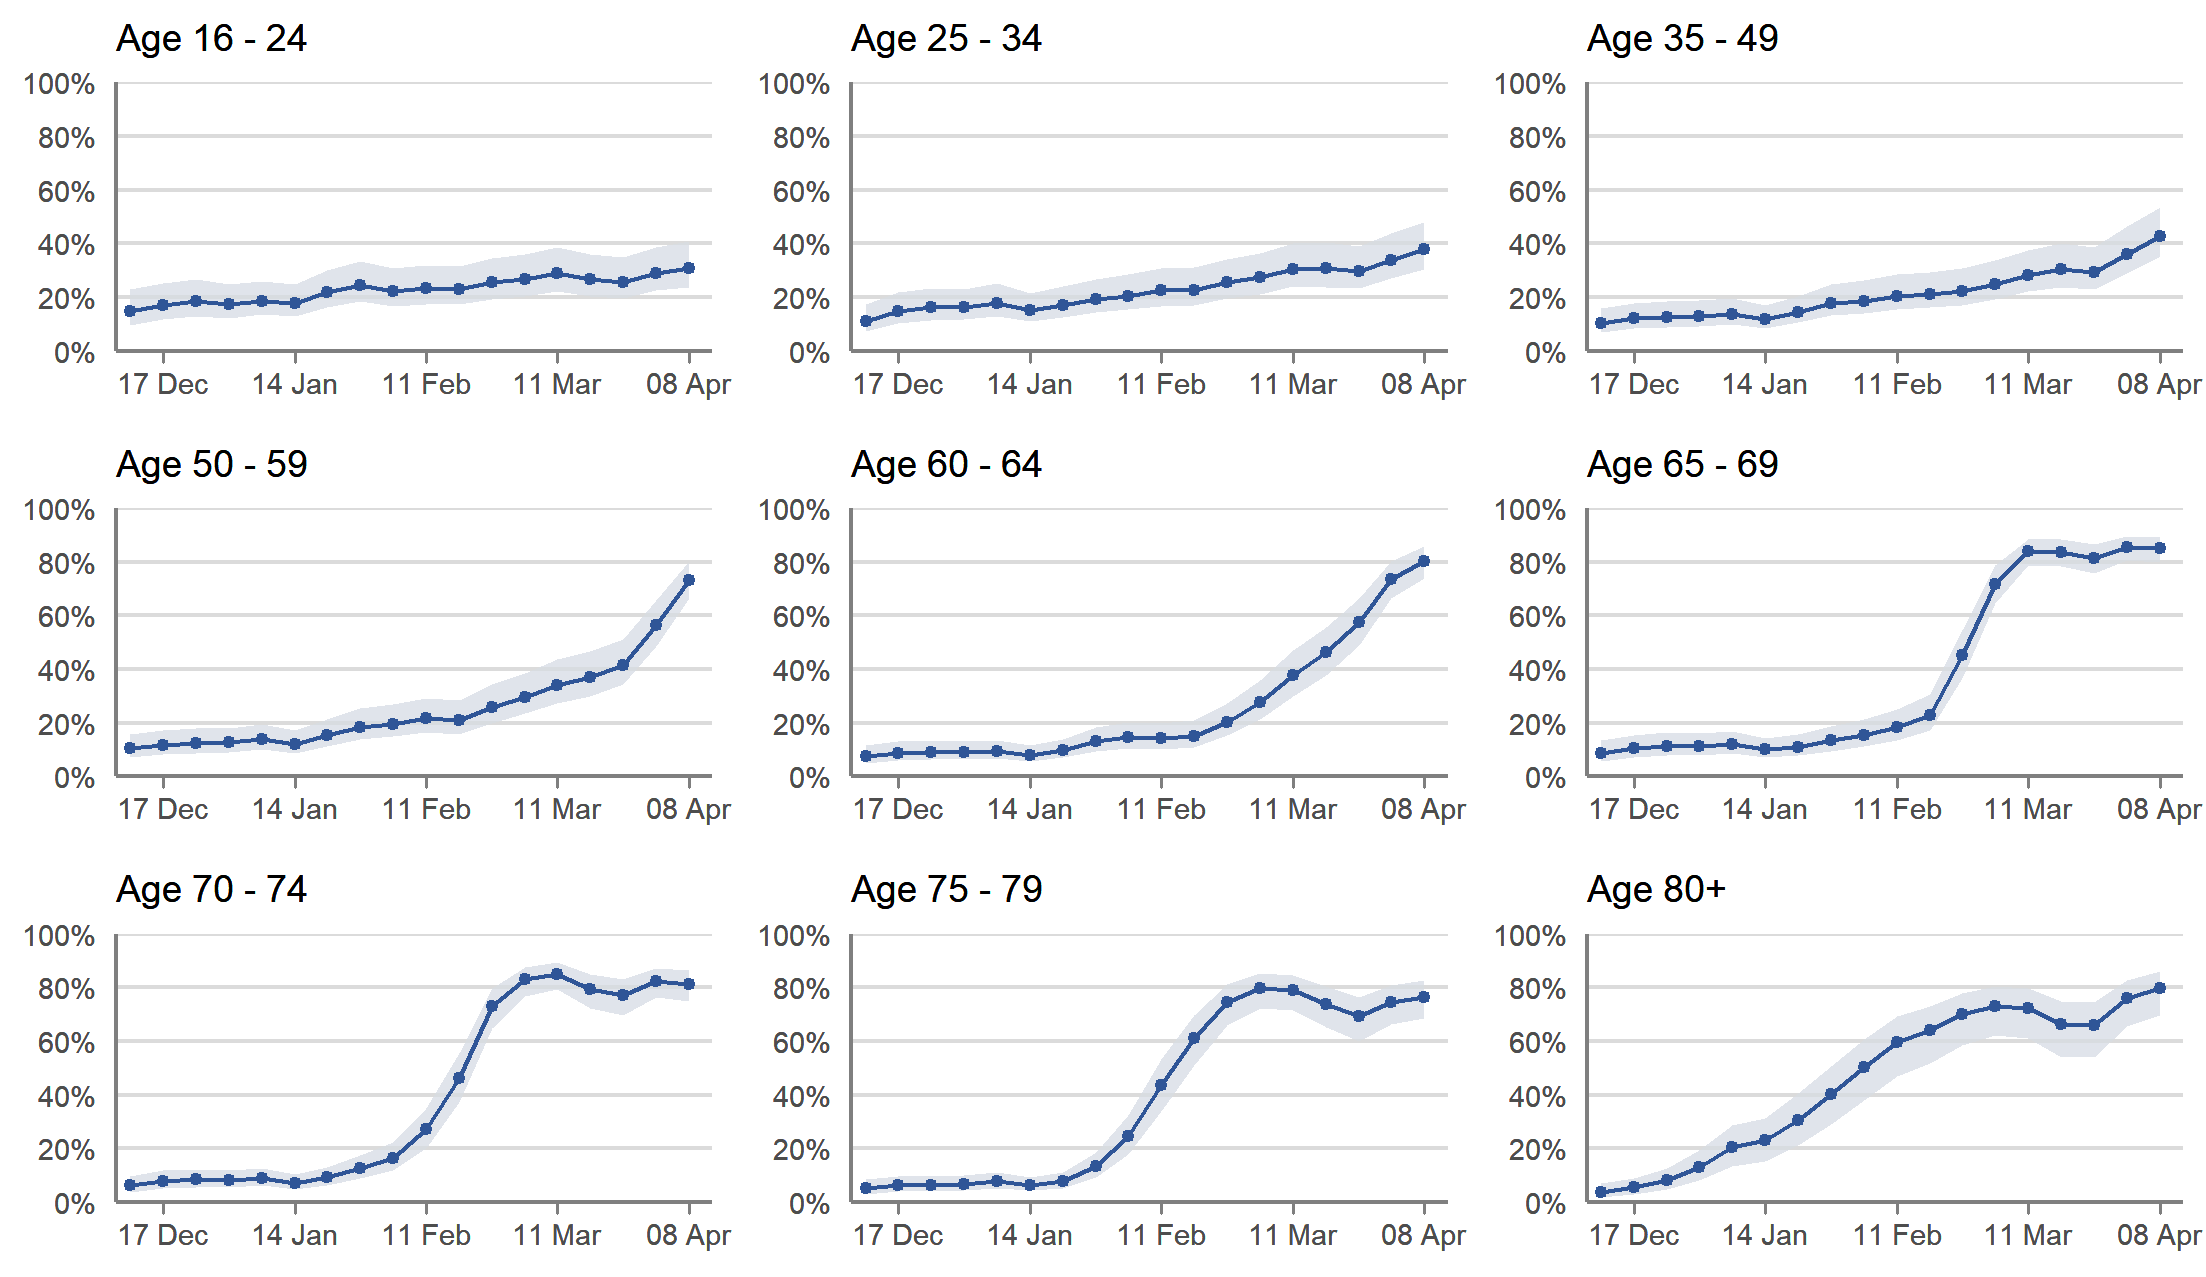
Figure 3 shows the modelled weekly estimate of the percentage of people testing positive for antibodies to SARS-CoV-2 from 7 December 2020 to 11 April 2021 by age group, showing the trend over time. Antibody positivity is increasing with age, with the highest percentage testing positive for antibodies in the older age groups and lowest among the youngest groups; reflecting the age prioritisation in vaccination programmes in place across the UK.
There was a decrease in the estimated percentage of adults testing positive for antibodies in the older ages in early to mid-March 2021. Antibody positivity has since risen again in the older ages. This is likely to reflect the increase in individuals receiving the second dose of their COVID-19 vaccination.
Modelled weekly estimates of the percentage of people testing positive for antibodies to SARS-CoV-2 from a blood sample by age group are displayed in Figure 3 as estimates for the midpoint of the week.
Figure 3: Modelled weekly percentage of people testing positive for antibodies to SARS-CoV-2 from a blood sample, by age group, from 7 December 2020 to 11 April 2021, including 95% credible intervals
Modelled daily estimates of antibody positivity by single year of age in the most recent weeks can also be found in the accompanying dataset and visualisation published by the ONS.
The methodology used to produce the daily modelled estimates is different to that used to produce the weekly estimates and as such, these figures are not directly comparable. However, the broad pattern across age groups appears similar.
Comparison of modelled estimates of the proportion of people who have received one or more doses of a COVID-19 vaccination, and those that have been fully vaccinated, with the likelihood of testing positive for antibodies to SARS-CoV-2 in Scotland
It is important to note that this section contains estimates based on self-reported vaccines from the ONS COVID-19 Infection Survey and should not be used to track the progress of the vaccine rollout. Please see the latest daily vaccination data on the UK coronavirus dashboard to understand the progress of the vaccination programme across the UK.
Survey estimates refer to the community population, by which we mean private households only and excludes those in hospitals, care homes or other institutional settings. This data does not include those that live in care homes, one of the priority groups identified by the Joint Committee on Vaccination and Immunisation (JCVI).
Further information on the methodology can be found at the end of this release.
Estimates from the survey are not the same as data reported from the UK coronavirus dashboard which includes daily data for the UK and each constituent country on the actual number of people who have received a COVID-19 vaccination based on individual vaccination records (administrative data held by each nation). The UK coronavirus dashboard figures include those in care homes, hospitals and other communal establishments.
The estimates produced from the survey are helpful to compare with other characteristics, such as testing positive for antibodies and further analysis will be produced as more data become available.
Modelled estimates suggest there has been an increase in the proportion of people who have been vaccinated in the period 12 to 16 April 2021, and that antibody positivity increased in the week ending 11 April 2021 in Scotland. There is a clear pattern between vaccination and testing positive for COVID-19 antibodies as shown in Figure 4.
Modelled weekly estimates are displayed in Figure 4 as estimates for the midpoint of the week.
Figure 4: The percentage of people that have received one or more doses of a COVID-19 vaccine, from 14 December 2020 to 16 April 2021, modelled weekly estimates of the percentage of people that have been fully vaccinated from 15 February 2021 to 16 April 2021 and modelled weekly estimates of the percentage of people testing positive for antibodies to SARS-CoV-2 from a blood sample, from 7 December 2020 to 11 April 2021, including 95% credible intervals
Modelled weekly estimates of the percentage of people that have received one or more doses of a COVID-19 vaccine, or who have been fully vaccinated by age group can also be found in the full article published by the Office for National Statistics on 28 April 2021.
Methodology and further information
The analysis in this section of the article is based on blood test results taken from a randomly selected subsample of individuals aged 16 years and over, which are used to test for antibodies against SARS-CoV-2. This can be used to identify individuals who have had the infection in the past or have developed antibodies as a result of vaccination.
It takes between two and three weeks after infection or vaccination for the body to make enough antibodies to fight the infection. Antibodies remain in the blood at low levels, although these levels can decline over time to the point that tests can no longer detect them. Having antibodies can help to prevent individuals from getting the same infection again.
The presence of antibodies is measured to understand who has had COVID-19 in the past and the impact of vaccinations. Once infected, the length of time antibodies remain at detectable levels in the blood is not fully known. It is also not yet known how having detectable antibodies, now or at some time in the past, affects the chance of getting COVID-19 again, since other parts of the immune system (T cell response) will offer protection.
The full article on antibody and vaccination data published by the Office for National Statistics on 28 April 2021, which includes antibody information for England, Wales and Northern Ireland, can be accessed.
More information about the COVID-19 Infection Survey in Scotland can be found on the information page on the Scottish Government website, and previous COVID-19 Infection Survey data for Scotland can be found in this collection.
Additional methodology notes not covered in main body of publication:
1. The model used to provide these estimates is a Bayesian model: these provide 95% credible intervals. A credible interval gives an indication of the uncertainty of an estimate from data analysis. 95% credible intervals are calculated so that there is a 95% probability of the true value lying in the interval. A wider interval indicates more uncertainty in the estimate.
2. National Immunisation Management System (NIMS) administrative data is used to validate COVID-19 Infection Survey self-reported records of vaccination for England. The equivalent of this is currently not included for other countries, meaning the estimates for Wales, Northern Ireland and Scotland are produced only from COVID-19 Infection Survey self-reported records of vaccination.
3. The denominators used for vaccinations are the total people in the sample at that particular time point, which are then post-stratified by the mid-year population estimate.
4. There is high uncertainty around COVID-19 Infection Survey estimates due to the relatively small number of people included in this analysis, so caution should be taken in interpreting the results.
5. Previously, published estimates of antibody positivity were weighted estimates for 28-day periods of antibody positivity for England, Wales, Northern Ireland and Scotland, with fortnightly updates on antibody data. The first article using this new methodology was published on 30 March 2021. Estimates are now based on a model where England, Wales and Scotland are included together in a spatial-temporal model with Northern Ireland being modelled separately. This reflects the geography of the four countries with Northern Ireland not sharing a land border with Great Britain. The geo-spatial model incorporates physical land distance between regions. The data is modelled on standardised Monday-Sunday surveillance weeks and data from 7 December 2020 is presented. The latest week’s modelled estimate is subject to more uncertainty as it is an incomplete week of data and therefore more likely to change when more data become available. Further information on this method to model antibodies can be found in ONS updated methods article.