The Best Start - caesarean section rates: review report
This report provides information about the rising caesarean section rate in Scotland and explores the factors contributing to this by exploring the published data and evidence within Scotland, across the UK and wider where applicable.
Caesarean Section Rates
Caesarean Section rates - Long Term Trends
Current rates and long-term trends in caesarean sections in Scotland, relative to the other countries of Great Britain and international comparisons where appropriate.
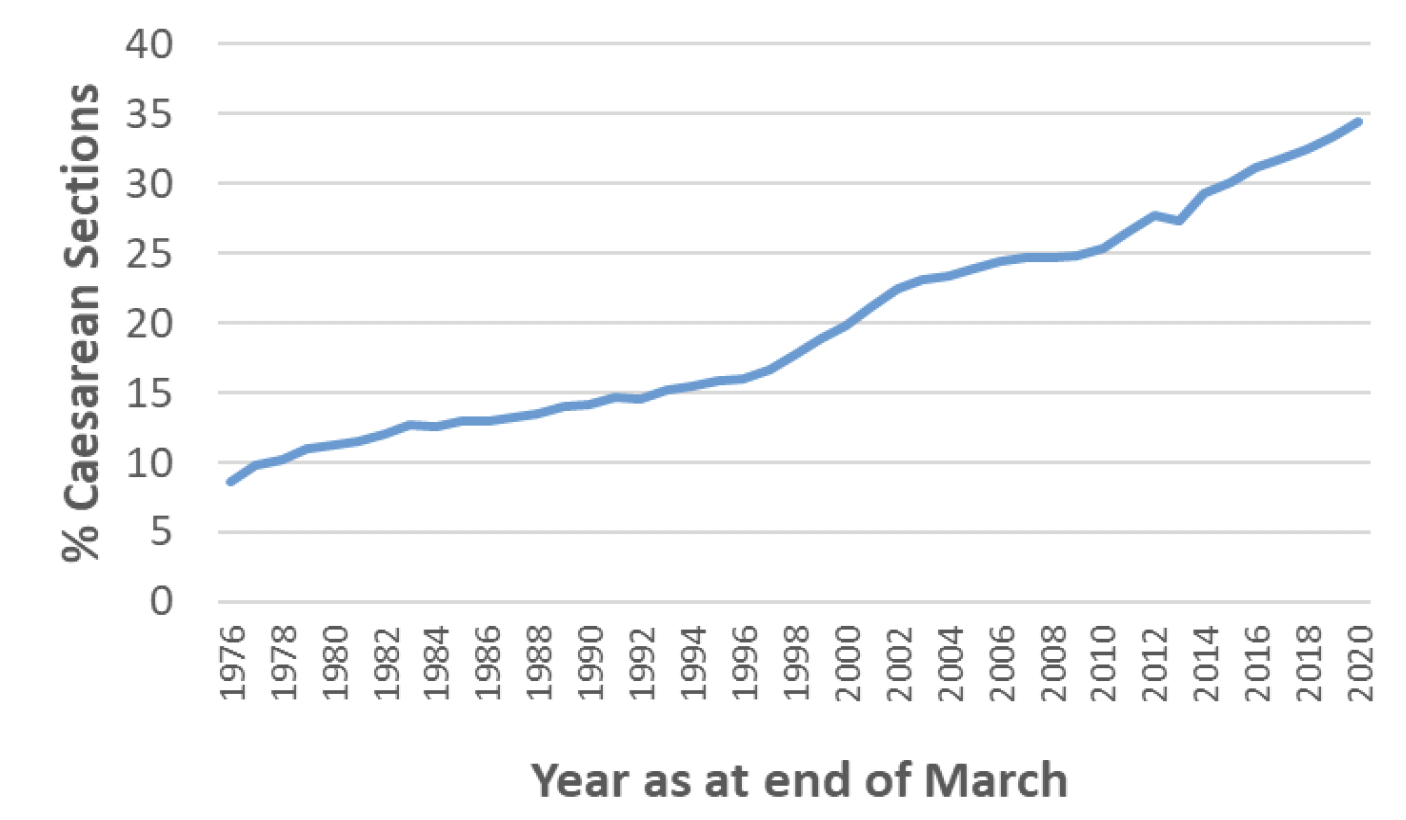
Overall the proportion of birth delivered by caesarean section (caesarean section rate) in Scotland has risen steadily over the last five decades from 9% of live singleton babies delivered by caesarean section in 1975/76 (when the national maternity dataset, SMR02, was introduced) to 35% in 2019/20, the highest rate since records began.
Nationally, the increase in caesarean section rates has generally been steady and constant from the 70's to the present day, from zero to one percentage points per year. However, during this time the largest year-on-year increases in caesarean section rates were between 1997/98 and 2002/03 (increase from 18% to 23%) and more recently between 2012/13 and 2019/20 (increase from 27% to 34%). (Chart 1).
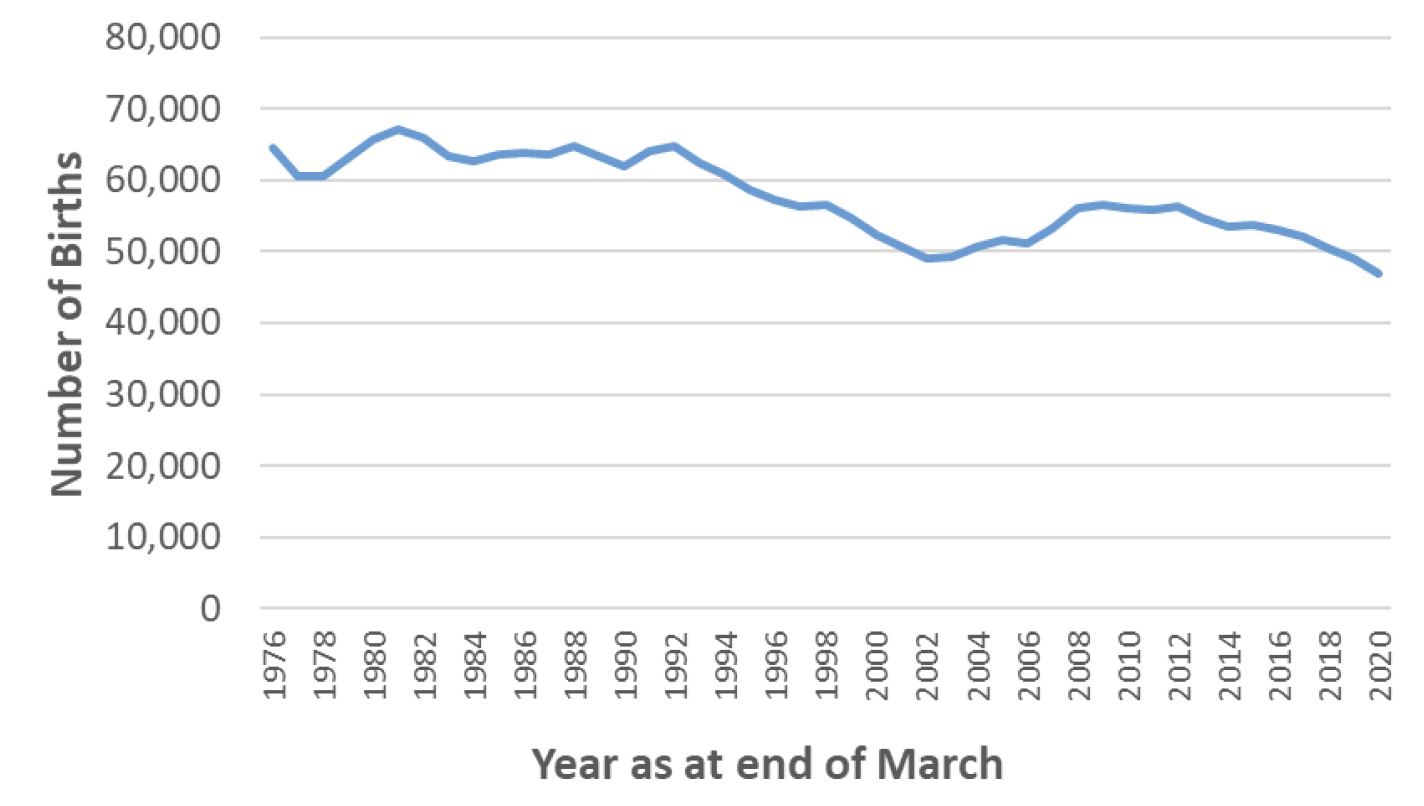
Over the same period of time, the number of births per year in Scotland has gradually declined, from 64,587 in 1976/77 to 46,923 in 2019/20. (Chart 2)
The trend of increasing caesarean section rates has been seen across the world, although to varying extents in different regions and countries. Globally, the region with the highest caesarean section rate as at 2014 was Latin America and the Caribbean, with 40.5% of births delivered by caesarean section, followed by Northern America (32.3%), Oceania (31.1%), Europe (25%), and Africa (7.3%). Latin America and the Caribbean has also been the region with the largest absolute increase in caesarean section rates in recent years, with an absolute increase of 19.4% between 1990 and 2014. Asia, Oceania and Europe have had a similar absolute increases over the same time period of around 14-15%, while Northern America (10%) and Africa (4.5%) have had a more gradual increase in caesarean section rates.
As at 2014, UN-classified "more developed nations" had the highest caesarean section rates at 27.2%, followed by "less developed nations" (20.9%) and "least developed nations" (6%). Since 1990, the absolute increase in caesarean section rates has been highest in "less developed nations" at 14.6%, while "more developed nations" have seen an absolute increase of 12.7% and "least developed nations" of 4.2%.
Differences in cultural and economic context, demographic structure, general healthcare structure and maternal/midwife autonomy in delivery all contribute to the wide range in caesarean section rates seen internationally. However, even across countries for which similarities can be drawn in these respects, there still appears to be wide variation in the caesarean section rate. For example, in Australia/ New Zealand, the caesarean section rate increased from 23% to 32% between 1989 to 2012, whereas in Sweden it increased from 11% to 16% over a similar time-frame.
Mode of delivery differs markedly throughout Europe, with lower levels of caesarean births of around 16% to 17% in most Nordic countries and the Netherlands, and higher caesarean rates in Cyprus, Romania, Bulgaria, Poland, and Hungary, of around 40% or higher. Other countries with higher than European average caesarean rates, at around 35%, are Italy and Switzerland (Table 1).
| Global Region | Births by C-Section in 2014 (%) | Absolute increase in proportion of births delivered by C-Section from 1990 to 2014 (%) |
|---|---|---|
| Eastern Europe | 23.7 | +15.9 |
| Northern Europe | 22.4 | +11.3 |
| Southern Europe | 30.7 | +14.8 |
| Western Europe | 24.5 | +9.7 |
| Australia/New Zealand | 32.3 | +14.1 |
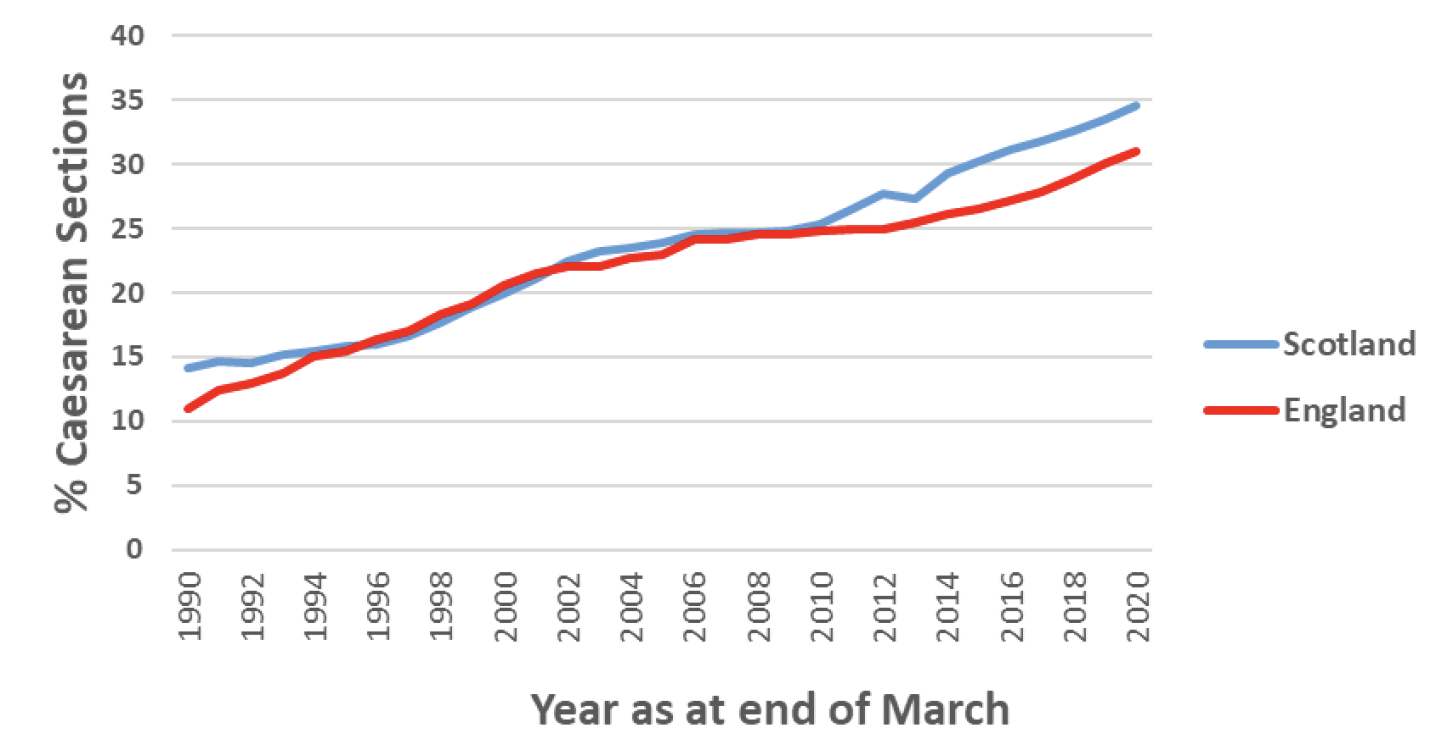
When comparing caesarean section rates in Britain with the rest of Europe and other more developed nations, Britain has relatively high caesarean section rates. For the time period reported in the global comparison above (2014), caesarean sections accounted for 29.3% of births in Scotland, 26.5% in England and 26.3% in Wales (Data not available for Northern Ireland). The rate of absolute increase seen in Scotland (15.1%) and England (14.1%) between 1990 and 2014 has also exceeded that seen in Europe (13.8%) and the more developed nations of the world (12.7%) (Data not available for Wales and Northern Ireland). Caesarean sections rates have continued to increase in the UK since 2014, with 2019/20 data showing 34.5% of deliveries by caesarean section in Scotland (up 5.2% from 2014) and 2019/20 data showing rates of 31% in England (up 4.7% from 2014) and 28% in Wales (up 1.7% from 2014).
As seen above there is wide variability in caesarean section rates internationally, and also some variation in caesarean section rates within Europe and the UK, with Scotland typically having slightly higher levels of caesarean sections than England and Wales. However, Scotland and England have had generally similar trends in the rate of increase in caesarean sections since 1990 (Chart 3).
*Live singleton births
Caesarean Section Rates by type, regions of Scotland and maternal characteristics
A year-by-year analysis of caesarean section rates by region and description of the variation between regions.
Rates of emergency versus elective caesarean sections - by board, by mothers age, by presentation, previous births, and other factors.
Rates of emergency versus elective caesarean sections
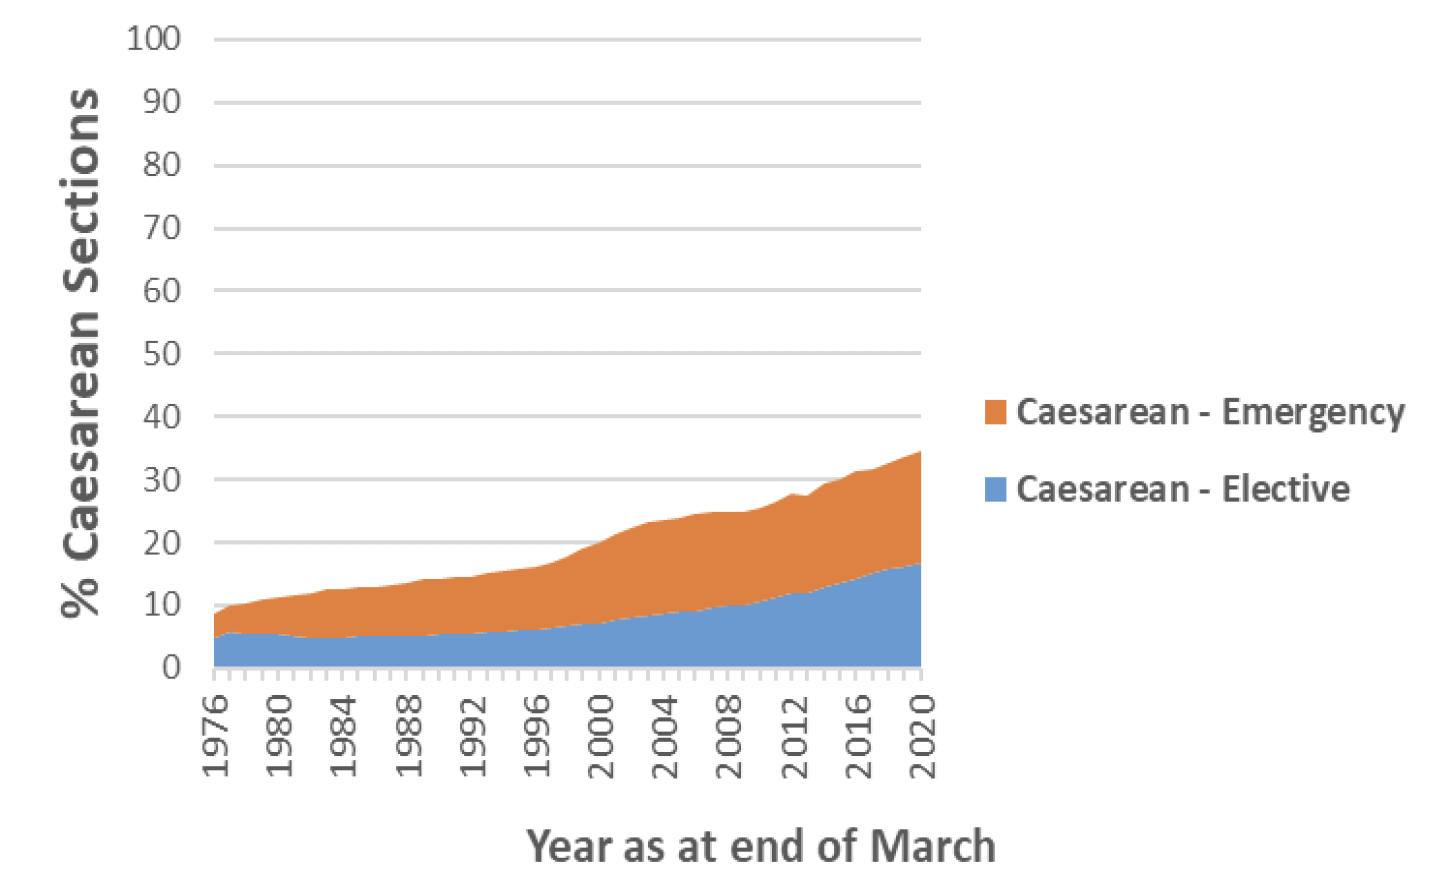
In Scotland in 2019/20 the percentage of live singleton babies delivered by caesarean section was 34.5% overall (16.7% elective, 17.8% emergency).
For singleton births in Scotland, the percentage of normal vaginal (spontaneous cephalic) deliveries has fallen steadily from 76% in 1975/76 to 53% in 2019/20. Other births in 2019/20 are accounted for as follows – 9% forceps, 3% vacuum, 0.1% vaginal breech.
The increasing rate in caesarean sections overall is accounted for by an increase in both elective and emergency caesarean sections, with elective sections increasing from 4% to 17% of all live singleton births and emergency increasing from 4% to 18% between 1975/76 and 2019/20 (Chart 4).
The data on rates of emergency versus elective caesarean sections, by mother's age, presentation, previous births, co-morbidity and other important factors are not currently published. Further analysis to understand if and how these factors have contributed to an increase in elective versus emergency caesarean section rates is therefore recommended.
While all health boards in Scotland have seen an increase in the number of caesarean sections taking place since 1990, some health boards have seen a more rapid increase than others. Different regions[a][b]of Scotland have seen broadly similar trends. Historically, caesarean section rates were similar in each region of Scotland, with the overall rate in 1997/98 at 18%, 17% and 17% in the West, North, and East respectively. Since then, the overall caesarean section rate has increased in each of these regions, but to a slightly larger extent initially in the West – and more recently in the North - and to a smaller extent in the East. In 2019/20 the overall caesarean section rate was 36%, 35% and 32% in the West, North, and East respectively (Chart 5).
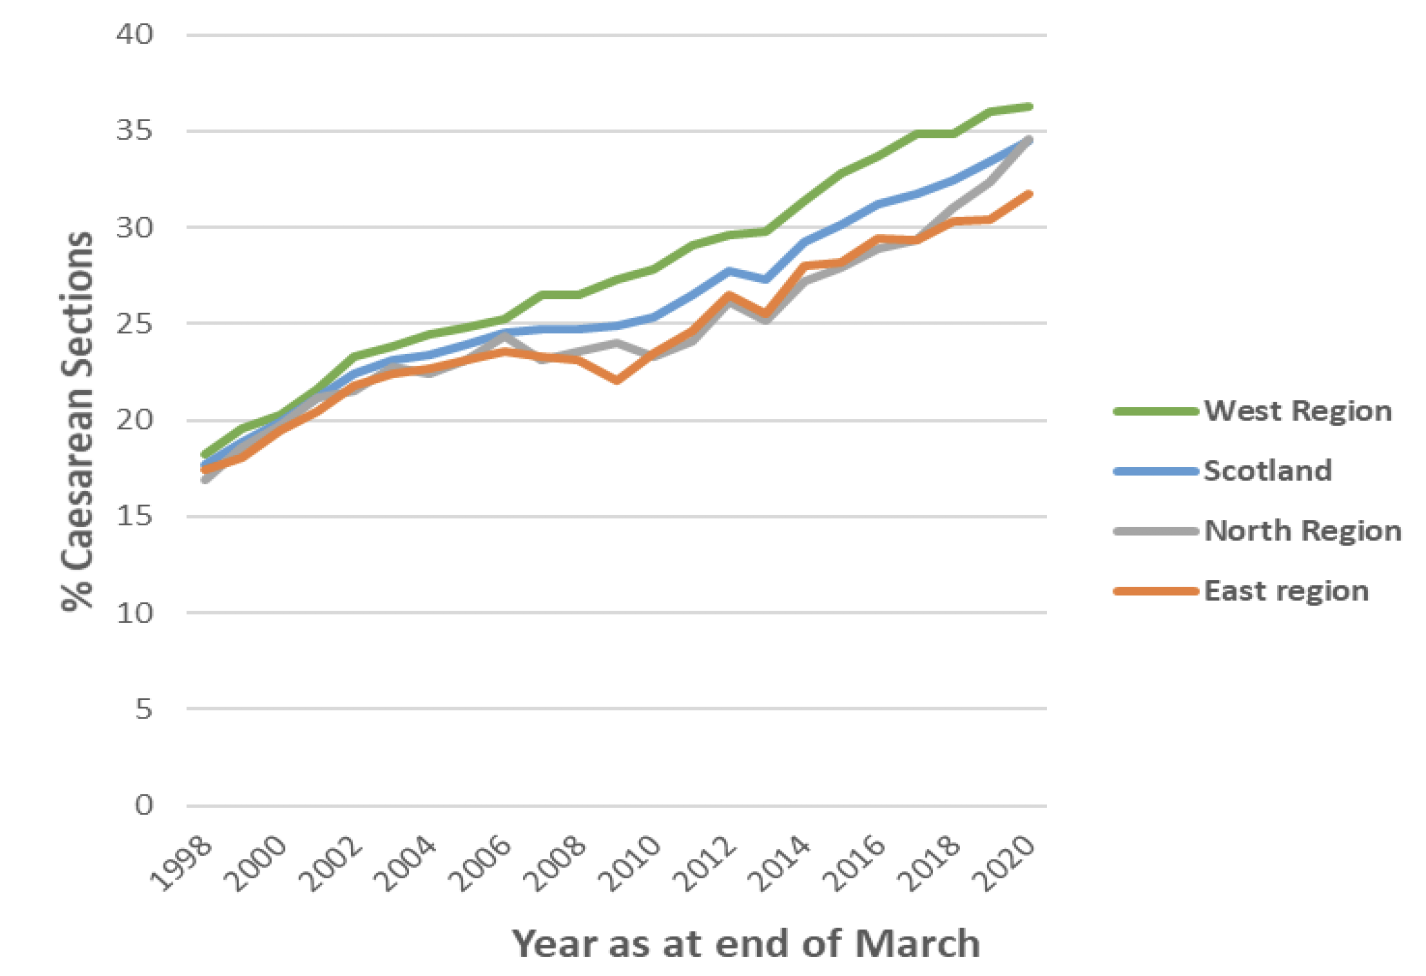
| Scottish Region | Births by caesarean section in 2019/20 (%) | Absolute increase in proportion of births delivered by caesarean section from 1997/98 to 2019/20 (%) |
|---|---|---|
| North Region | 35% | 18% |
| West Region | 36% | 18% |
| East Region | 32% | 14% |
| Scotland | 34% | 17% |
While regionally the caesarean section rates do not vary substantially, this is not the case when observing the rates across health board areas. All health boards in Scotland have seen an increase in caesarean sections between 1997/98 and 2019/20. There has, however, been wide variability in the extent of this increase between health boards. This has caused a further divergence in rates among boards. In 1997/98 all health boards had a caesarean section rate of between 12% and 20%, while in 2019/20 rates ranged from 27% to 42%.
It has previously been stated that these variations cannot be explained by case mix[12] (the characteristics of women giving birth) in each of the health board areas, however, given the increases seen in relevant risk factors such as rising maternal age and higher maternal BMI in the most recent years it is suggested that the case mix within each health board is examined further in future work using relevant unpublished data from SMR02 and other relevant sources of data.
Deprivation
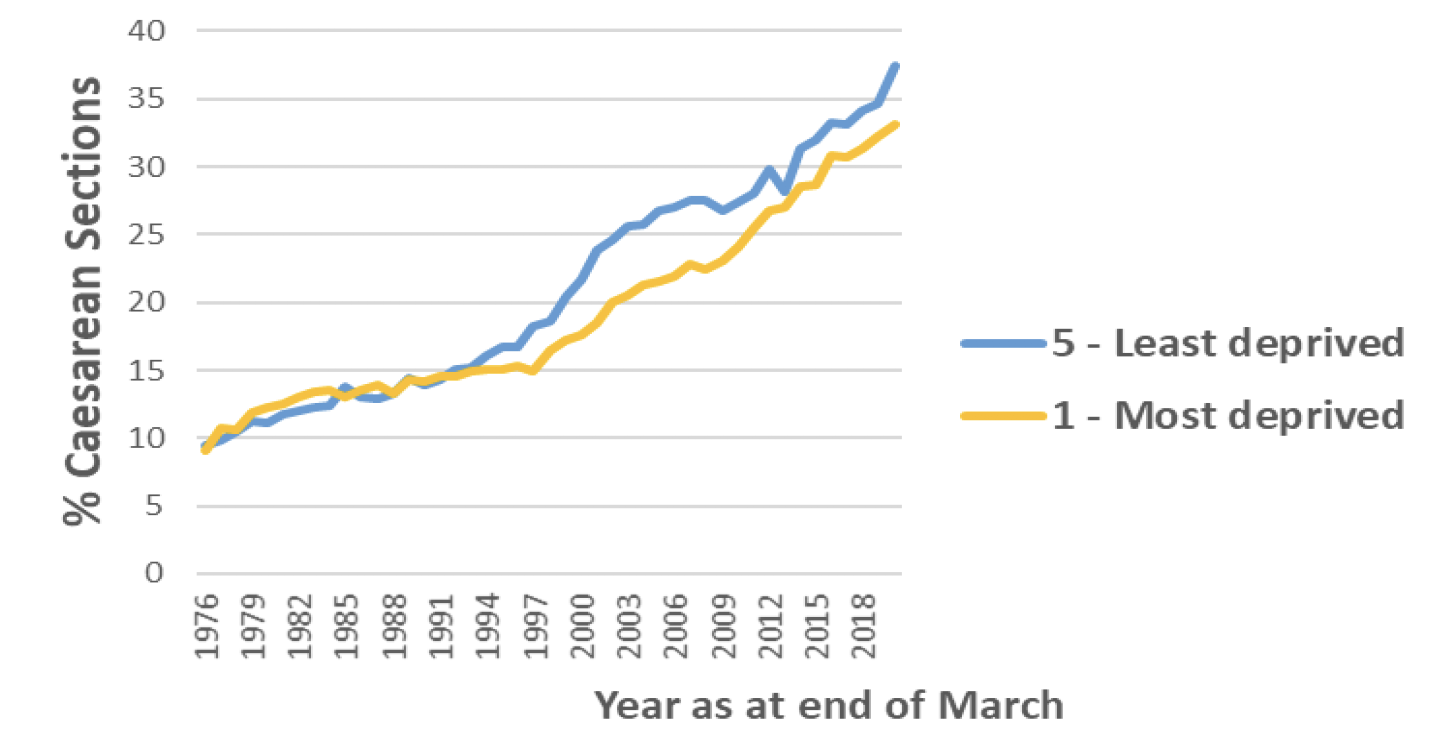
The increasing rate of caesarean sections between 1975/76 and 2019/20 has been seen across all deprivation quintiles at a similar rate, however there has been some divergence in the rates between the most deprived areas and least deprived areas. Mothers from the least deprived areas are now slightly more likely to have a caesarean section than those from the most deprived areas. In 1975/76 almost one in ten (9%) births from the most deprived areas (SIMD 1) were delivered by caesarean section, increasing to 33% in 2019/20. While the increase in the least deprived areas (SIMD 5) was from 10% to 38% over the same time period (Chart 6).
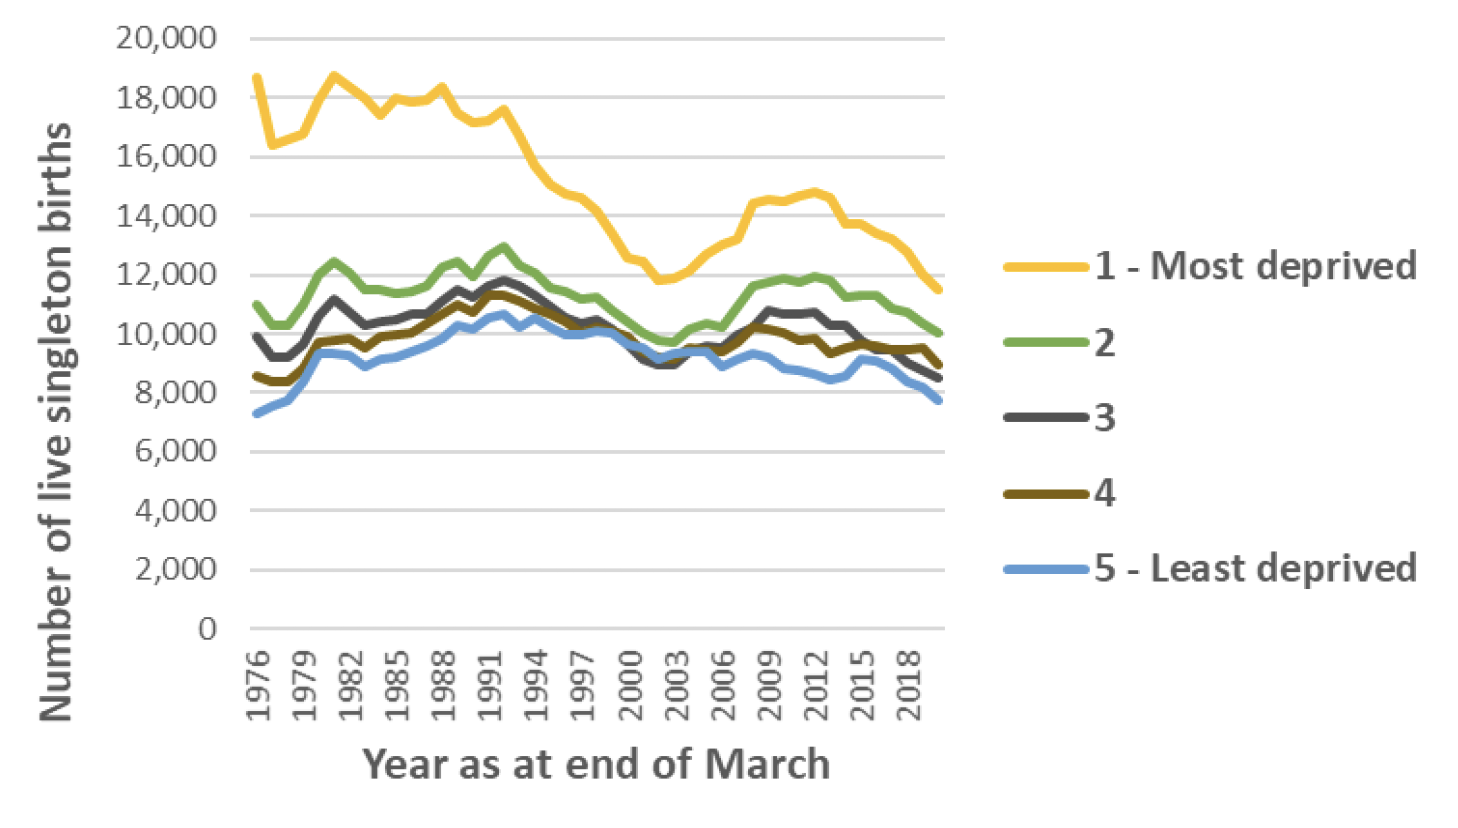
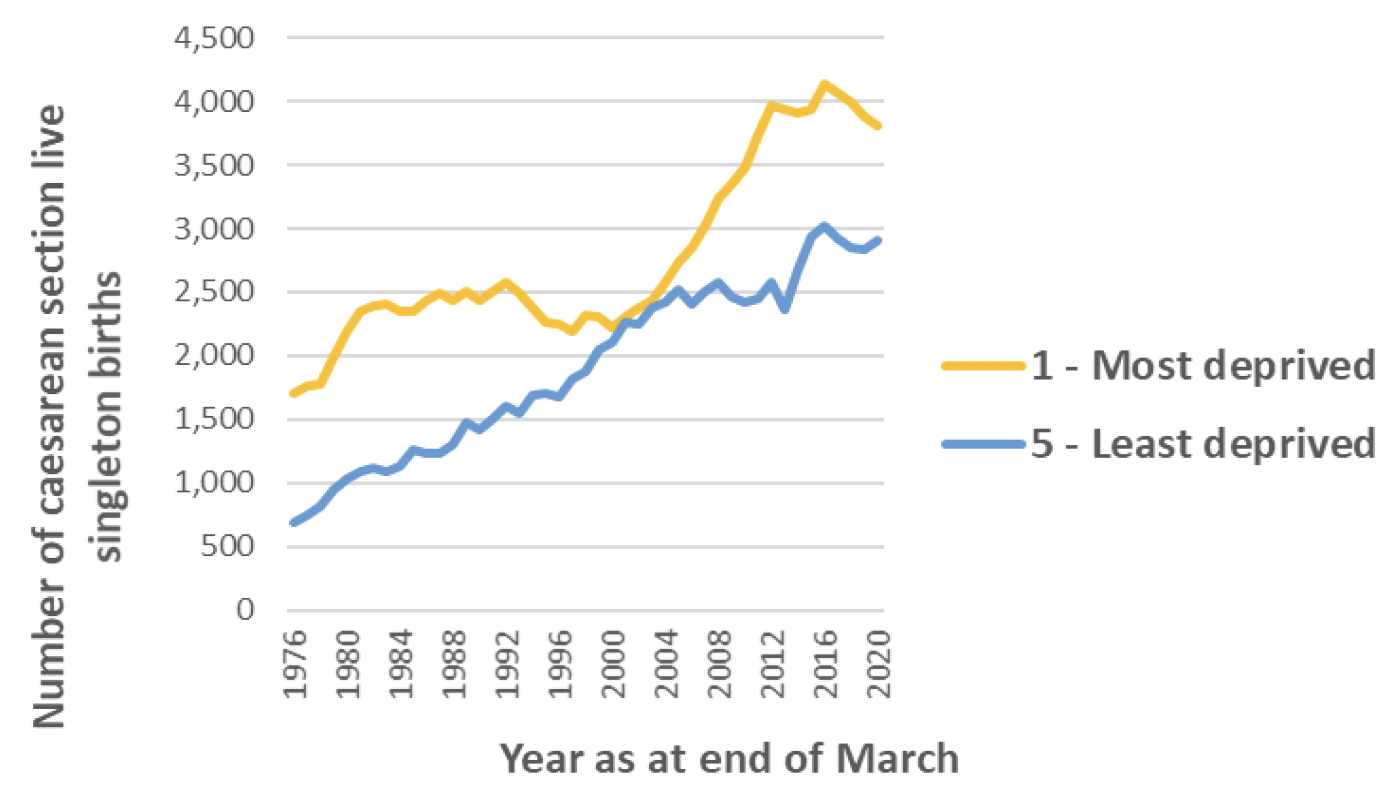
There was a larger/faster increase in caesarean section rates for those in the least deprived areas as compared to the most deprived between 1993 and 2003. Over the same period there was a drop in the number of births per year across all deprivation quintiles, however this drop was greater for the most deprived areas. Between 1993 and 2003 the births per year in the least deprived areas dropped from 10,209 to 9,314. Meanwhile in the most deprived areas the number of births per year dropped from 16,690 to 11,855. However as at 2019/20, SIMD 1 still accounts for the largest proportion of total births per year, and accounts for the highest share of caesarean sections in absolute terms (3812 in SIMD 1 in 2019/20 compared with 2907 in SIMD 5) (Chart 7)(Chart 8).
Previous studies from England have suggest that women from the least deprived areas were more likely to have an elective caesarean section than those from the most deprived areas.
Some variance by deprivation may be explained by increasing maternal age and rising BMI levels of pregnant women in Scotland. Studies have found that pregnant women in the most deprived areas were more likely to be overweight or obese, while advanced maternal age was more likely in the least deprived areas.
Maternal Age
There has been a steady increase in the average age of women giving birth in Scotland between 1975/76 and 2019/20, with a majority of women giving birth now over 30 years old. As shown in the table below.
| Age of Mother | 1975/76 | 2019/2020 |
|---|---|---|
| Under 20 years | 12.2% | 2.9% |
| 20-24 years | 33.6% | 13.4% |
| 25-29 years | 34.8% | 27.3% |
| 30-34 years | 13.5% | 33.3% |
| 35-39 years | 4.8% | 9% |
| Over 40 years | 1.2% | 4.1% |
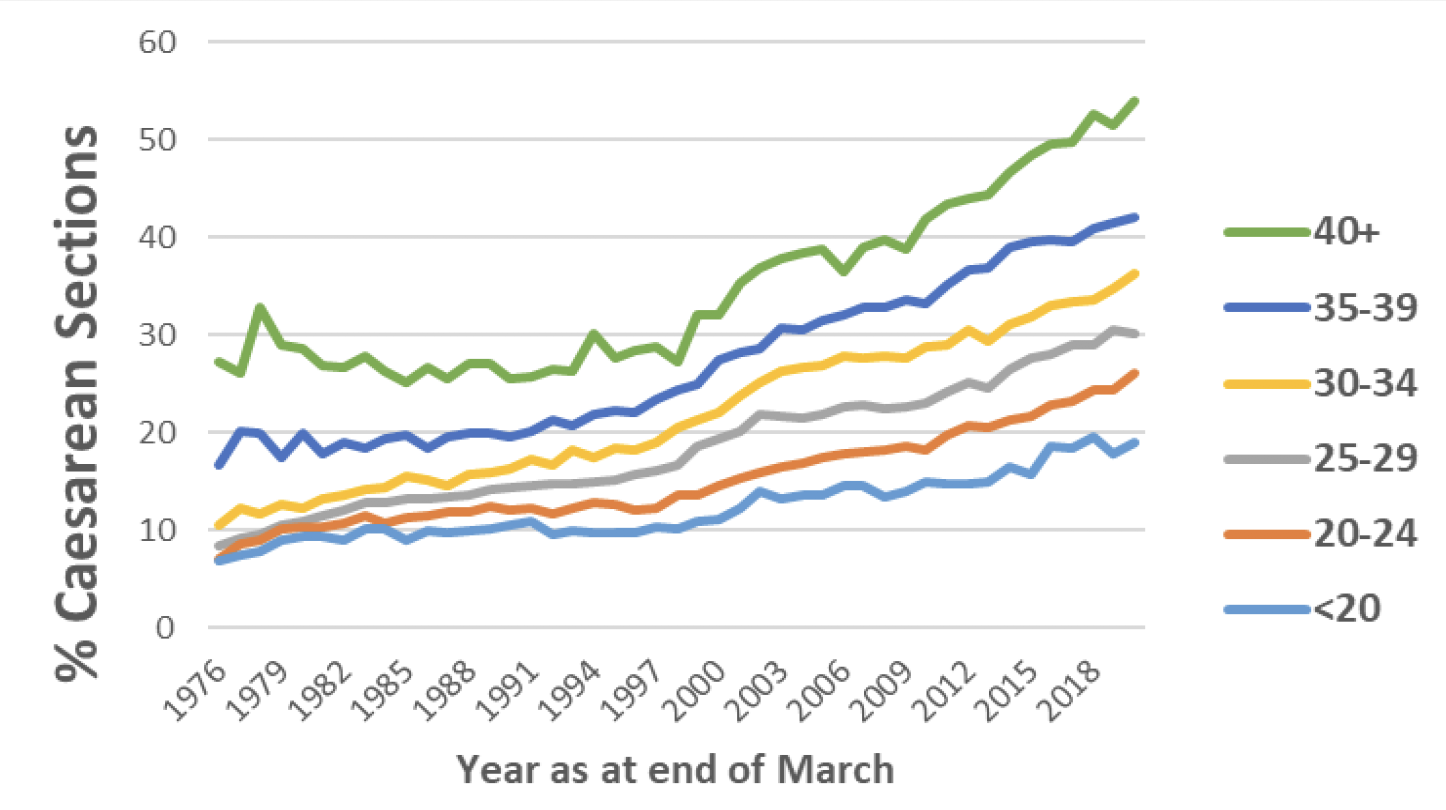
As shown in the chart below, older women giving birth in Scotland are more likely to have a caesarean section than younger women – in 2019/20 12.3% of women under the age of 20 gave birth by caesarean section, compared with 26.7% of women aged over 40. Although the caesarean section rate has increased for all age groups between 1975/76 and 2019/20, this trend is more pronounced in older age groups. The gap in caesarean section rates between under 20s and over 40s has increased from 19.9% to 35% between 1975/76 and 2019/20. (Chart 9).
The age of women having their first baby in Scotland has also been gradually increasing over the last three decades. In 2019/20 the proportion of first births to women aged 35 and over was 15% compared with 3.5% in 1990/91, 9% in 2000/01 and 13% in 2010/11.[18] This trend is also evident in Britain overall: 22% of first births in the year 2016/17 were to women aged 35 and over. Of all births for the year 2016/17 53% of all women giving birth were aged 30 or over.[19]
There is a range of risk factors and adverse outcomes for both mother and baby with increased maternal age, including placental abruption, placenta praevia, malpresentation, low birthweight, preterm and post–term delivery, and postpartum haemorrhage.[20] There is also an increased risk of still birth with rising maternal age and induction of labour is widely practiced as an intervention to reduce this risk.
A survey of UK obstetricians found that 37% of obstetricians offer induction of labour at term to women aged 40–44 years of age and 55% to those ≥ 45 years old.[21] Incidence of elective caesarean section are higher among women older than 40 years and some studies suggest that there is a lower tolerance of acceptance of elective caesarean without medical indication among this age group.[22]
Body Mass Index
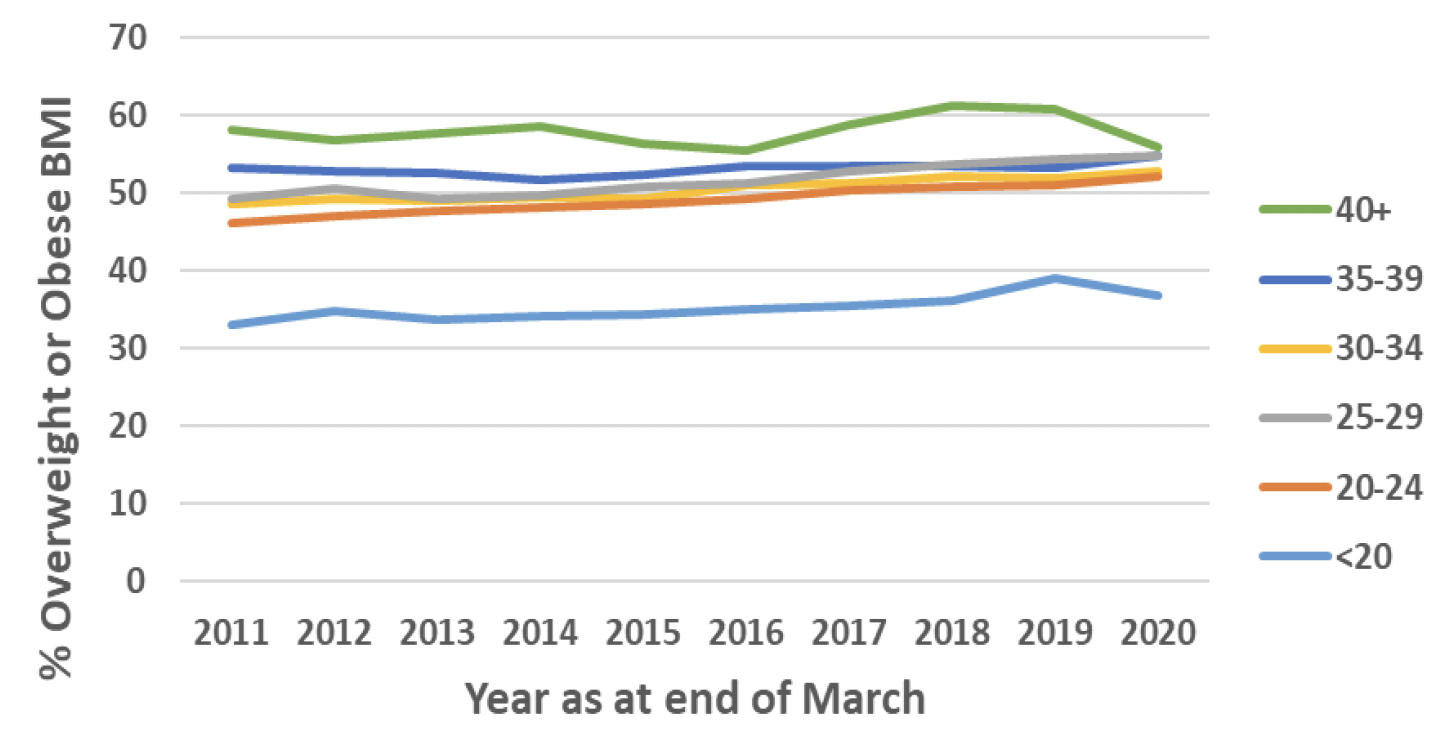
The Body Mass Index (BMI) of women giving birth in Scotland has generally increased between 2010/11 and 2019/20, with the proportion of women giving birth who are overweight or obese increasing from 48.5% to 53.3%. This increase appears to be greater in younger mothers, however older mothers are still slightly more likely to be obese or overweight than a normal weight. In 2010/11 46% of mothers giving birth under 30 years old were overweight or obese, increasing to 53% in 2019/20. Over the same time period the proportion of overweight or obese mothers aged 30 or older increased from 51% to 54%. (Chart 10).
Over four decades, the global rate of obesity has doubled to become one of the largest global public health challenges. The Euro-Perisat Perinatal Health Report found that in 2015 30-50% of women in contributing countries were overweight or obese.[23] For the year 2019/20 in Scotland, over half (53.3%) of pregnant women were overweight or obese at antenatal booking.[24] Several studies have reported that maternal obesity is associated with an increased risk of a number of serious adverse outcomes, including miscarriage, birth defects, thromboembolism, gestational diabetes, pre-eclampsia, dysfunctional labour, postpartum haemorrhage, wound infections, stillbirth and neonatal death.[25] Obesity is an independent risk factor for adverse obstetric outcome and is significantly associated with an increased caesarean delivery rate.[26]
Maternal mortality, stillbirth rates and neonatal morbidity
Rates of caesarean section alongside maternal mortality/morbidity and stillbirth/neonatal death rates and neonatal morbidity.
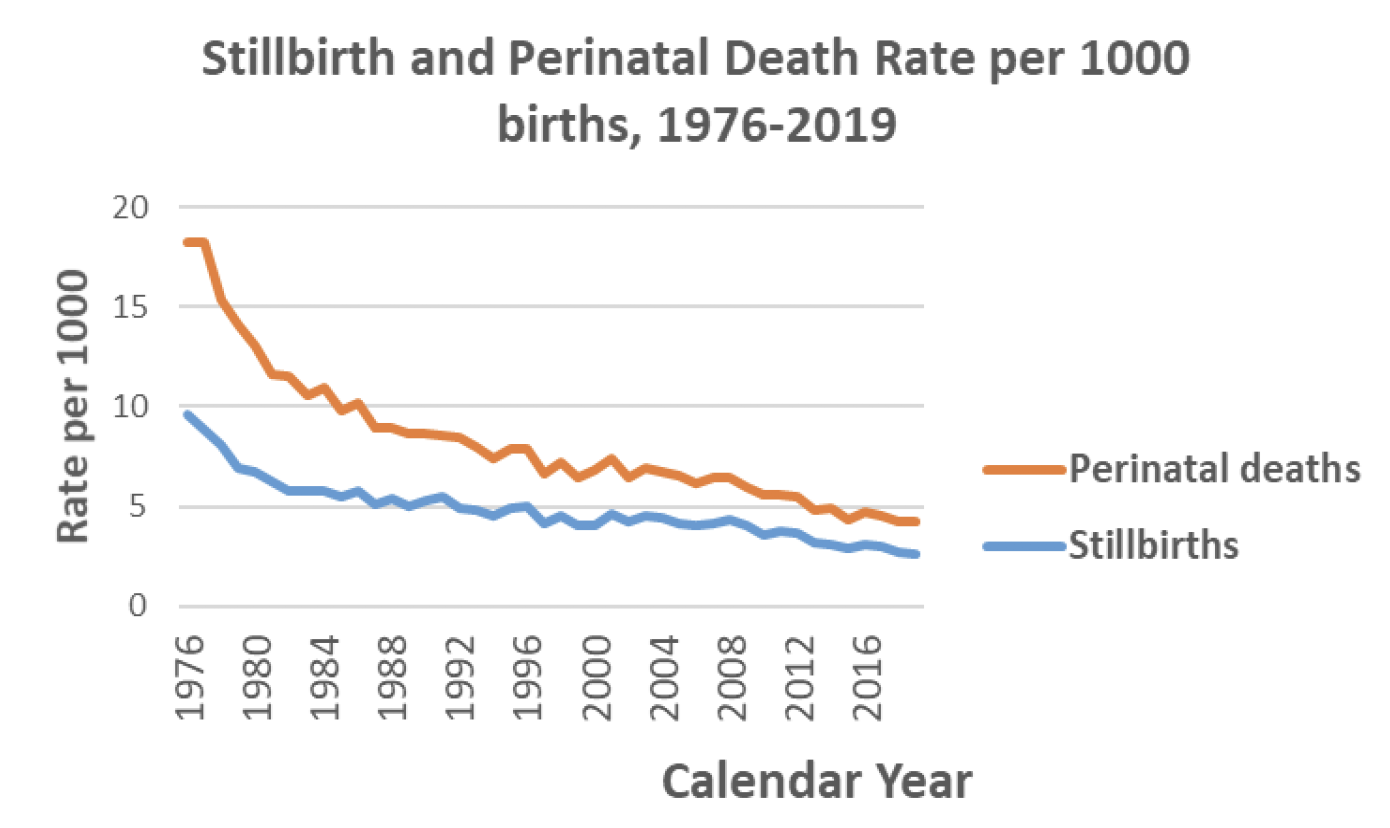
As shown in Chart 11, both stillbirth and perinatal death rates have fallen in Scotland between 1976 and 2019. In 1976, there were 9.6 stillbirths and 18.3 perinatal deaths per 1000 births respectively. These rates rapidly declined in the following decade and have more steadily declined in recent years to 2.6 stillbirths and 4.2 perinatal deaths per 1000 births in 2019. Although the rate of stillbirths and perinatal deaths continues to decline, the pace of decline has decreased. In the 10 years between 1976 and 1986 the rate of perinatal deaths per 1000 decreased from 18.3 to 10.2, whereas in the 10 years between 2009 and 2019, it decreased from 6.0 to 4.2. The rate of decrease of stillbirths and perinatal deaths in Scotland do not appear to correlate directly with the caesarean section rate in Scotland – during periods of accelerated increase in caesarean sections there does not appear to be a corresponding accelerated reduction in mortality (although this has not been subject to significance testing).
The World Health Organisation has concluded that caesarean section rates of 10-15% are associated with decreases in maternal, neonatal and infant mortality.[29] However, when they increase above 10-15%, rates of caesarean section are no longer associated with lower mortality rates.
Studies into maternal and pregnancy outcomes have continued to report a range of inequalities in the UK. Women from deprived areas are at higher risk of dying compared with women from less deprived areas.[30] Mortality rates also remain high for babies born to Black or Black British and Asian or Asian British women. Findings reported in the recent perinatal MBRRACE-UK report show that the perinatal mortality rate remains disproportionately high for these groups although the stillbirth rate for these groups has decreased. The report also indicated an over-representation of maternal deaths in women over the age of 35.[31]
The Word Health Organisation stated that, although caesarean sections are effective in saving maternal and infant lives, they increase the likelihood of long-term and short-term maternal and infant complication, such as neonatal respiratory distress, infection, asthma and obesity in children.[32] [33] Medically unnecessary caesarean section is a public health concern because of the excess morbidity compared to vaginal childbirth[34] such as greater complications in subsequent pregnancies[35],[36] and greater maternal mortality.[37] Evidence suggests that in the UK there was increased risk for admission to intensive care if pregnant women were of black ethnicity, of BMI >35 and had advanced maternal age.[38]
That said, it is important to note the recent findings of the Ockenden Report which found that caesarean section rates, at the NHS Trusts in England subject to the Ockenden review[c], were between 8 and 12%, consistently below the English average of 24%. The review found a culture of trying to keep caesarean section rates low because of a belief that this demonstrated good maternity care. But the review found that earlier decisions to use caesarean delivery would have avoided death and injury in many cases[39].
NICE Guidelines
Impact of changes to the NICE guidance in 2011 on caesarean section rates[40]
The NICE guidelines for caesarean section were updated on 23rd November 2011.
The following recommendations were added to the guidance:
- When a woman requests a caesarean section because she has anxiety about childbirth, offer referral to a healthcare professional with expertise in providing perinatal mental health support to help her address her anxiety in a supportive manner.
- For women requesting a caesarean section, if after discussion and offer of support (including perinatal mental health support for women with anxiety about childbirth), a vaginal birth is still not an acceptable option, offer a planned caesarean section.
- An obstetrician unwilling to perform a caesarean section should refer the woman to an obstetrician who will carry out the caesarean section.
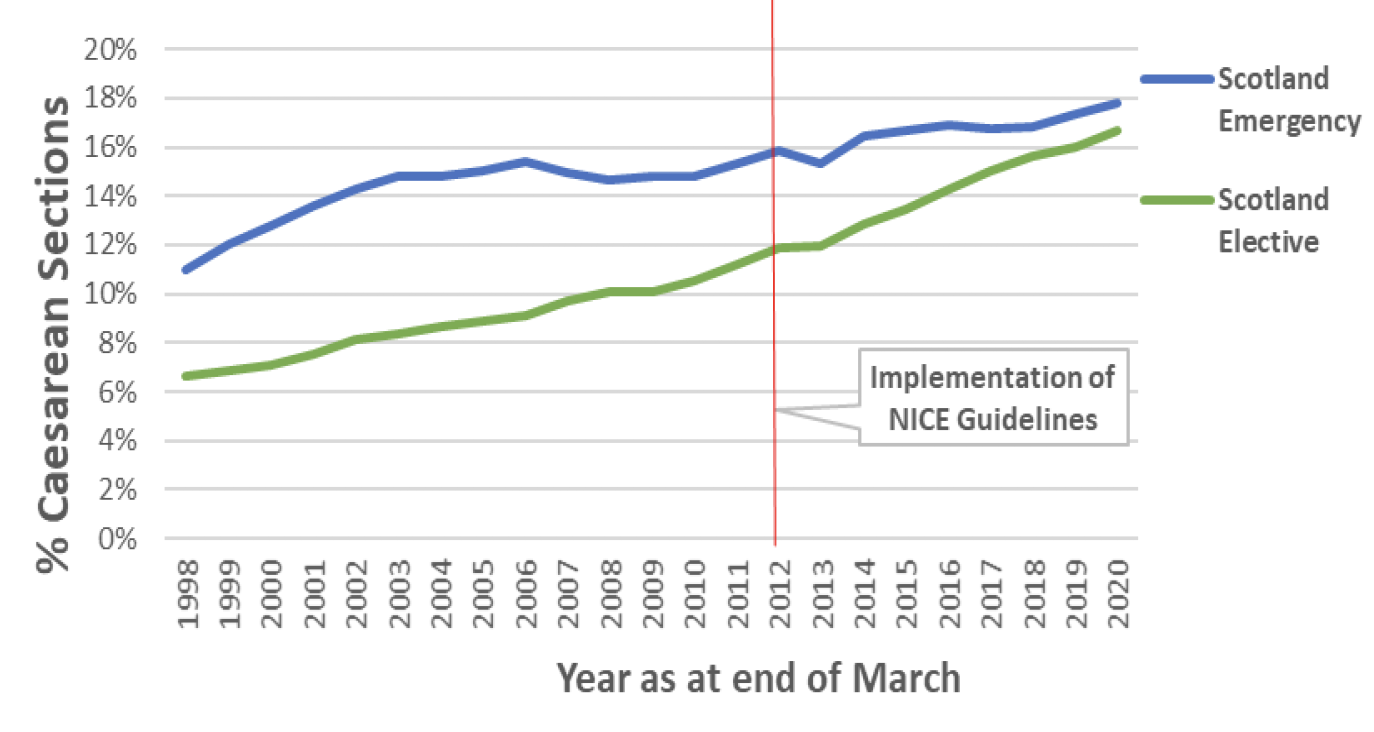
Since the update of NICE guidelines in 2011, the rates of both emergency and elective caesarean sections have continued to increase across Scotland. The gap between emergency and elective caesarean section rates has narrowed somewhat in this time, reflecting a continuing faster rate of increase of elective caesarean sections than for emergency sections. The rate of emergency caesarean sections has increased by 1.9 percentage points since 2011/2, whereas the rate of elective caesarean sections has increased by 4.8 percentage points. (Chart 12).
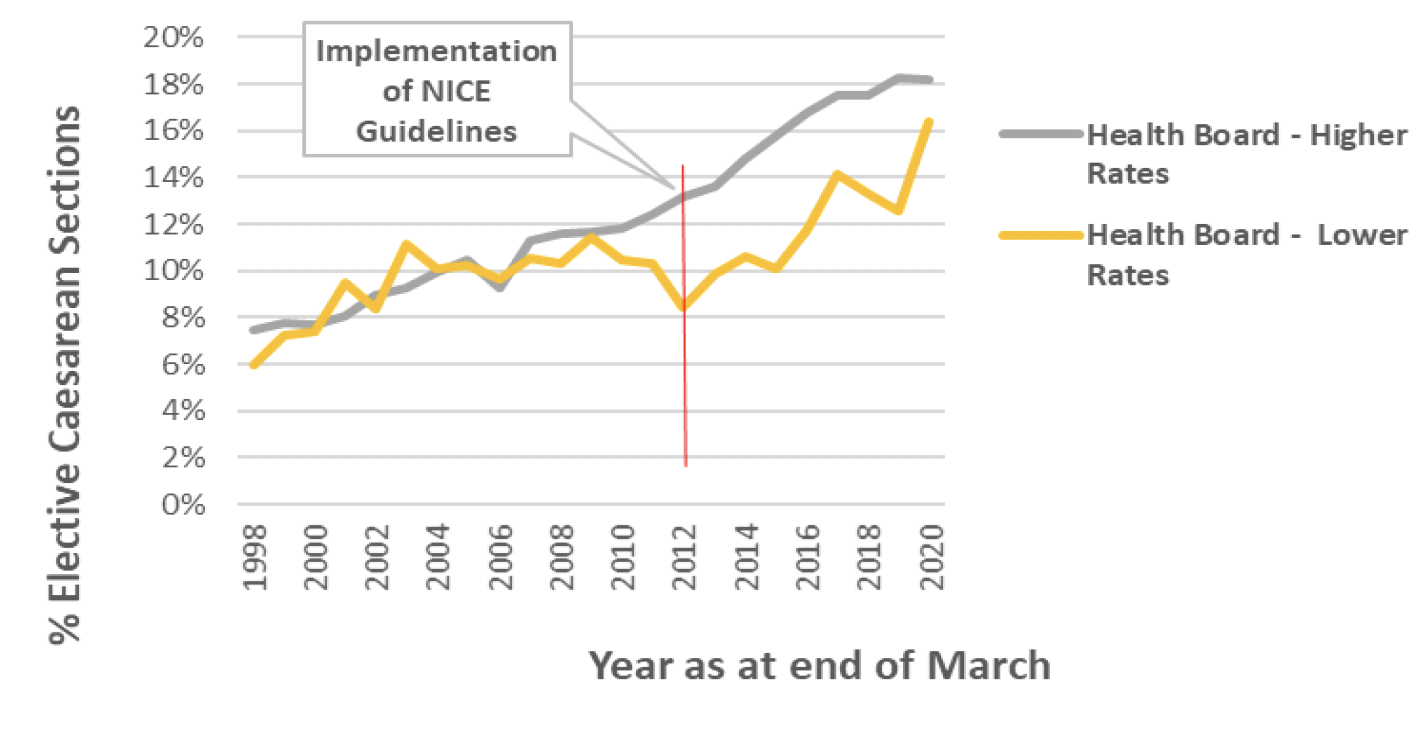
When comparing emergency and elective caesarean section rates in two health boards within mainland Scotland with the highest and lowest rates of caesarean section immediately prior to the introduction of the NICE guidelines they have shown different trends in emergency rates but similar trends in elective rates since the time of the update.
The health board with higher initial rates has seen a moderate increase in emergency caesarean section rates of 2.1 percentage points since 2011/12, while the health board with initially lower rates has seen a reduction of 2.4 percentage points (Chart 13).

For elective caesarean sections, the health board with initially higher rates has seen a large increase of 5.1 percentage points since 2011/12 while the health board with initially lower rates has also had a larger increase of 8 percentage points. (Chart 14). For the health board with initially higher rates, this increase continues a trend of increasing elective caesarean section rates since before the guidance was updated. Whereas, for the health board with initially lower rates it reverses the trend of declining elective caesarean section rates in the years immediately preceding the update.
There is some indication from preliminary analysis that experiences across Health Boards in Scotland have varied since the introduction of the update to the NICE guidelines. It is suggested that further exploration of the caesarean section rate at an individual board level is undertaken.
Studies internationally and in Scotland and the UK have explored the perceptions of various stakeholders, including maternity care providers (obstetricians and midwives), pregnant women, and the general public, on the involvement of women in making decisions on caesarean section as the mode of birth in uncomplicated pregnancies.
They have found the following:
- Gender differences were noted between male and female obstetricians in their support for caesarean section by maternal request (CSMRs).[44],[45] In Canada, male obstetricians (34%) were more likely than female obstetricians (16%) to agree to perform a caesarean section by maternal request (CSMR).[46] A similar difference was found in Italy, where 48.3% of male and 33.3% of female obstetricians would agree to perform a caesarean section upon request.[47]
- Experience also had a bearing on whether obstetricians were willing to perform a CSMR. Three studies reported that trainee obstetricians and obstetricians who had been qualified for less than 10 years were more likely to agree to a CSMR.[48],[49],[50]
- The majority of the studies reported that women wanted to have the freedom to choose their mode of birth, however 50–70% of pregnant women in the UK considered it the responsibility of obstetricians to decide whether a caesarean section was necessary for the safety of the mother or baby.[51]
- Four qualitative studies conducted in Scotland, the UK, Australia, and Argentina reported that pregnant women sought to make the decision together with their obstetricians, rather than on their own.[52],[53],[54],[55]
- In these studies women described themselves as being autonomous in their decision on mode of birth.[56],[57] Women who perceived that they had made an autonomous decision indicated higher levels of satisfaction with their birth.[58] However, statements made by women about the process of making a decision on their mode of birth, showed that the women had followed the advice of their obstetrician.[59] These women said that, based on the advice of their obstetrician, they had chosen to undergo a caesarean section because of the predictability and safety of the procedure for their baby and themselves, and that a vaginal birth involved unknown risks and unexpected outcomes. This indicated that even when women thought that they had made an autonomous decision, they had in fact followed the advice of their obstetrician. It was unclear whether the mode of birth was reflective of the women's preference prior to the consultation with their obstetrician or was more of a reflection of the preference and opinion of their obstetrician.
To better understand the rates of caesarean section in Scotland it will also be important to understand the staff mix within individual maternity units to understand if any of the factors indicated above are having an influence on the caesarean section rates.
Alongside this, it is important to consider other factors that have also changed both before and after the implementation of the (2011) NICE guidelines, including increases in obesity and maternal age. Furthermore, given that recent studies report low rates of section by maternal request among nulliparous women it is important that a holistic approach is taken to try to understand all factors that are contributing to the rise in caesarean sections.
- A survey conducted in the UK and Ireland found that 77% of obstetricians believed that maternal request was an important contributing factor to the national increase in caesarean sections. However, the same study found that most obstetricians reported receiving only a few requests.[60]
- A survey of 166 pregnant women, 31 midwives and 52 doctors within maternity units at two hospitals in the North East region of England found that the views of pregnant women and health professionals differ regarding requests for caesarean section. When asked if women should always be allowed to choose caesarean section in an uncomplicated pregnancy 2% of health professionals agreed compared with 20% of pregnant women. Further, when asked for the reasons women might request a caesarean section in an uncomplicated pregnancy, pregnant women were more likely than health professionals to feel that 'safer for the baby' was a reason (19% vs 3%). Health professionals were more likely than pregnant women to cite fear of injury as a reason for women requesting a caesarean section (30% vs 14%).[61]
- Evidence from Canada, the UK, Sweden and Australia indicates that 6–15% of women indicate a preference for caesarean section.[62],[63] Maternal requests for caesarean section highlight the role of risk narratives in shaping women's experiences during pregnancy and throughout the birth decision making process. Some studies suggest that perceived risks of urinary incontinence, vaginal prolapse and/or sexual dysfunction, are a factor for seeking a caesarean section, despite the fact that these are not clearly linked outcomes.[64],[65]
- The fear of pain associated with labour has been found by many studies to be a contributing factor of caesarean section by maternal request. Researchers in Norway conducted interviews and focus groups with women who had requested a caesarean section and found that fear of labour most commonly emerged as a result of a previous traumatic birth experience.[66] In 2001, repeat elective caesarean section was considered as the most significant factor influencing Scottish caesarean section rates.[67]
- The process of decision making regarding mode of birth can be complex as the process can be influenced by different and competing factors in a woman's life. A qualitative study of women in Scotland that aimed to explore the decision‐making process regarding mode of delivery for women who had previously given birth by caesarean section found that the decision evolved and changed throughout pregnancy. The women were mostly influenced by their past experience, their decision was strongly influenced by the possibility of an emergency caesarean if they opted for a vaginal birth after caesarean (VBAC), and were more likely to request a planned caesarean. Women who were unsure about their mode of delivery wished for more information from their consultant and midwife that was tailored to their personal situation.[68] Similar studies have found that women who have previously had a caesarean section valued the safety of their baby over their own but also wished to avoid a repeat emergency caesarean.[69]
Contact
Email: Justine.Menzies@gov.scot