Alcohol and Drug Partnerships: annual survey 2024 to 2025
This publication reports on responses to the annual survey of Alcohol and Drug Partnerships (ADPs) in Scotland for 2024/25. Its main aim is to evidence progress of the National Mission by providing information on the activity undertaken by ADPs.
Findings
1. Response rates
Responses were received from all 30 ADP areas in Scotland. At the time of publication, 29 ADPs had confirmed that responses were signed off at ADP level and 27 had confirmed that responses were signed off at the Integrated Joint Board (IJB) level. Some ADPs were unable to confirm ADP and IJB sign-off prior to publication of this report. Note that ADP areas vary considerably by size, population and demographics.
2. Cross cutting priority: Surveillance and data informed
Structures to inform surveillance and monitoring
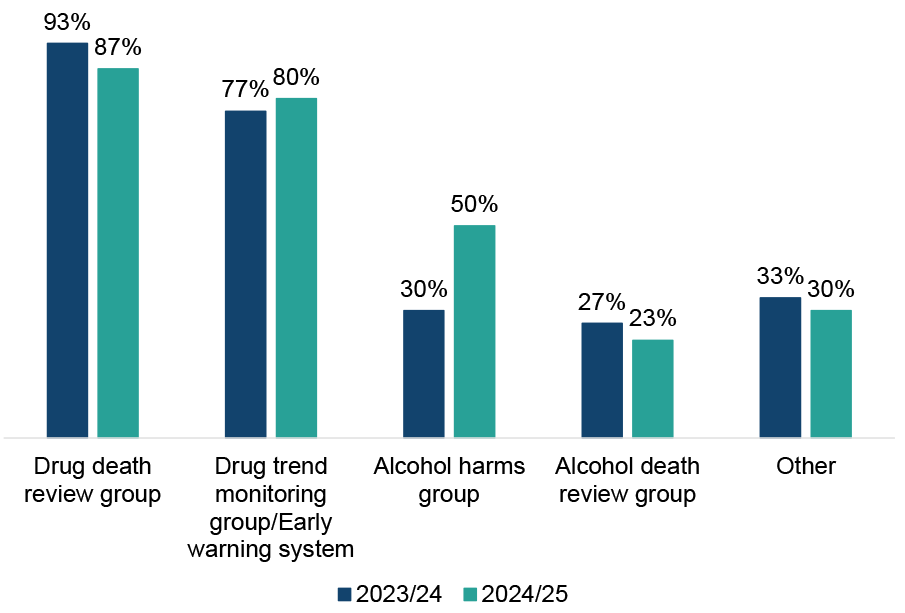
Most ADPs reported having groups or structures in place at an ADP level to inform surveillance and monitoring of alcohol and drug harms or deaths, shown in Figure 1. These groups or structures were more commonly reported to be in place for drug deaths and harms than for alcohol deaths and harms. This is consistent with findings from last year.
Most ADPs (87%) reported having a drug death review group (or equivalent) in place in 2024/25, a small decrease from 93% in 2023/24.[1] Eight in ten ADPs (80%) reported having a drug trend monitoring group or early warning system in place, similar to last year (77% of ADPs in 2023/24). Half of ADPs (50%) reported that they had alcohol harms groups in place in 2024/25, an increase from 30% in 2023/24. Just under a quarter of ADPs (23%) reported having an alcohol death review group, similar to last year (27% of ADPs in 2023/24).
Several ADPs reported having other groups or structures in place at an ADP level to inform surveillance and monitoring of alcohol and drug harms and deaths. These included combined drug and alcohol death review groups, multi-agency work, NHS board-level activity, and data analysis to understand their communities better.
Figure 1: Alcohol harms groups were more widely reported this year but death review and trend monitoring groups continue to be more common for drugs than alcohol
Percentage of ADPs who have groups or structures in place at an ADP level to inform surveillance and monitoring of alcohol and drug harms or deaths, 2023/24 and 2024/25
Around eight in ten ADPs (83%) reported that Chief Officers for Public Protection receive feedback from drug death reviews, similar to 2023/24 (80%). Of the ADPs that reported that Chief Officers for Public Protection did not receive feedback from drug death reviews, several reported that this was because the processes were under review, with the intention to incorporate national guidance published by Public Health Scotland to manage data sharing and partnership working. In some cases, reporting was provided to other individuals who were engaged with the ADP, such as Chief Operating Officers and Health and Social Care Partnership Directors, with reporting to the local Public Protection Committee when requested. In other cases, the Chief Officer for Public Protection was provided with overall trends in reporting rather than individual reviews.
ADPs were asked what local and national structures are in place for the monitoring and surveillance of alcohol and drugs harms and deaths, and how these had been used to inform local decision making in response to emerging threats, such as novel synthetics, in the past year. Rapid Action Drugs Alerts and Response (RADAR) was reported widely across ADPs for early warning and intelligence sharing, with the PHS Intelligence Team providing support in terms of surveillance data, trend analysis and support with strategic planning. The Welsh Emerging Drugs and Identification of Novel Substances (WEDINOS) service was also reported by ADPs as useful to provide information to inform harm reduction messaging.
Locally, ADPs highlighted drug death review groups and near-fatal overdose monitoring as mechanisms to support learning. Some areas highlighted multi-agency models including early warning systems and strategic groups around topics such as alcohol harms, drug trend monitoring and drug death prevention groups.
Many areas also hold regular huddles or briefings to share real-time intelligence and activate mechanisms such as Incident Management Teams or Problem Assessment Groups when clusters or emerging threats are identified. Lived and living experience panels are increasingly being used to provide frontline insights and shape trauma-informed, person-centred care.
ADPs reported that these local structures have enabled timely responses to emerging threats such as synthetic opioids, ketamine, nitazenes, and xylazine. They have informed harm reduction messaging, improved service pathways (including A&E referral systems and alcohol-specific death reviews), and supported the development of targeted interventions like naloxone distribution and stimulant user support.
Response to emerging threats
Eight in ten (80%) ADPs reported having made specific revisions to any protocols in the past year in response to emerging threats such as novel synthetics, trends in cocaine and new street benzodiazepines. ADPs outlined revisions which were most commonly related to novel synthetics such as nitazines. Such revisions included updates to surveillance and intelligence of substances and harms, as well as monitoring and dissemination of information from RADAR and local monitoring groups, including drug death reviews.
Many areas highlighted updated protocols to ensure adequate provision of naloxone and naloxone training, and the provision of drug testing strips. Additionally, several ADPs also highlighted updated protocols with regards to ketamine use, safe sleep, cocaine and crack use, including seizures and the implementation of prescribing guidance for benzodiazepines.
Routine engagement with commissioned services
ADPs reported a range of ways in which they routinely engage with commissioned services in their area. Commissioned services were reported to be routinely represented on ADP committees, strategic groups and subgroups, contributing to planning, delivery, and evaluation processes. Regular contact is reportedly maintained via email, phone and meetings (both in-person and online), with many ADPs reporting daily or weekly interactions. Contract monitoring was a core reported feature, typically conducted quarterly or annually, and includes written reports, performance reviews, and data submissions via systems such as Drug and Alcohol Information System (DAISy). ADPs reported that services are actively involved in training, learning events, and co-production activities, including the development of trauma-informed and rights-based practices.
Reported engagement also includes surveys, focus groups, experiential interviews, and lived experience panels. ADPs reported hosting networking events, stakeholder forums, and community activities to promote collaboration. ADPs reported that many services are integrated into wider systems of care and participate in thematic groups focused on recovery, prevention, and family support.
3. Cross cutting priority: Resilient and skilled workforce
Staffing resources
ADPs reported that they employed an average of 3.4 whole-time equivalent[2] (WTE) staffing resource routinely dedicated to their ADP support team as of 31 March 2025. This is similar to previous years (3.5 WTE in 2023/24 and 3.1 WTE in 2022/23). The WTE resource across all ADPs ranged from 1.3 WTE to 8.5 WTE, which is likely reflective of the differing sizes and needs of the geographical areas served. Furthermore, ADP support team structures and compositions vary - in some local areas, staff work across multiple different domains and there is no dedicated ADP support team. In these cases, an estimate of the WTE allocated to ADP specific areas was provided by the ADP.
Five ADPs reported vacancies in their ADP support team, ranging from 0.8 to 1.0 WTE. These included vacancies for ADP development officer, administrator, senior communications officer, and business manager. This was an average of 0.2 WTE vacancies per ADP nationally, a decrease from 0.4 in both 2023/24 and 2022/23.
Employee Wellbeing Initiatives
Most ADPs reported a range of initiatives aimed at improving employee wellbeing (volunteers as well as paid staff).[3] The most commonly reported employee wellbeing initiatives were promotion of information and support initiatives, and provision of training on issues including trauma awareness and crisis management (both 97% of ADPs). Most ADPs also reported provision of coaching and supervision for staff and volunteers (90% of ADPs), flexible working and provision of occupation health services (both at 87% of ADPs), and provision of counselling for staff and volunteers (80% of ADPs). The least commonly reported initiatives were use of disability passports (20% of ADPs), social and physical activities (43% of ADPs), and staff recognition schemes (47% of ADPs). ADPs also reported other activities aimed at improving employee wellbeing, such as additional training on specialist topics and wellbeing events and initiatives, with a focus on mental health.
4. Cross cutting priority: lived and living experience
Lived and living experience feedback and engagement
All ADPs reported having formal mechanisms in place at an ADP level to gather feedback from people with lived and/or living experience who use ADP-funded services. Engagement with recovery communities and experiential data collected as part of the Medication Assisted Treatment (MAT) programme were both reported to be in place by all ADPs. Feedback/complaints process and lived/living experience panels, forums and/or focus groups were also commonly reported to be in place (both 93% of ADPs).
In comparison to 2023/24, the most notable increase was observed in the use of questionnaires or surveys (83% of ADPs used them in 2024/25, up from 63% using them in 2023/24). Other mechanisms that ADPs reported as being in place to gather feedback from people with lived and living experience included engagement through other existing groups, structures or forums (e.g. strategy group, family steering group, peer support group, poverty and inequality group), attendance at events, and service user case studies.
ADPs were asked whether members of various groups with lived and/or living experience had participated in formal engagement mechanisms for gathering feedback. All ADPs reported that current or former employees or volunteers at the ADP or drug/alcohol services, women, and people currently accessing treatment or support for problem drug use had participated in formal feedback mechanisms. Participation of young people and people who are experiencing homelessness were the lowest of all groups, though still high percentages (both 77% of ADPs).
Lived and living experience participation
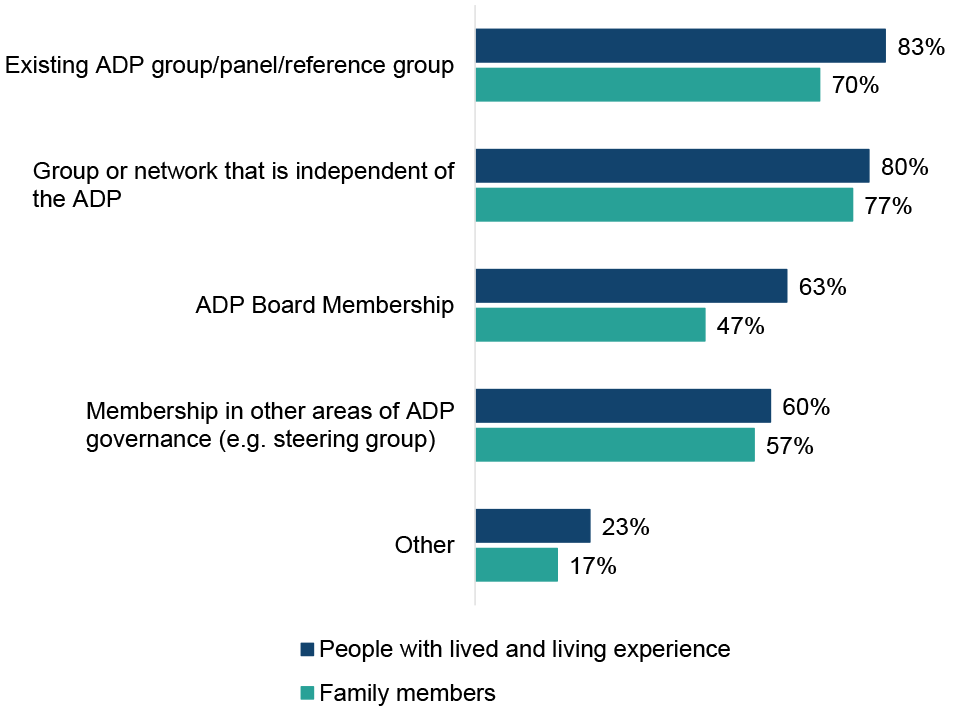
All ADPs reported at least one mechanism through which people with lived and living experience are able to participate in ADP decision-making (Figure 2). The most commonly reported mechanism was through an existing ADP group/panel/reference group (83%, in line with 2023/24), and 80% of ADPs reported that people with lived and living experience can participate in ADP decision making through a group or network that is independent of the ADP (2023/24: 70%). Around two thirds of ADP areas reported participation through ADP Board membership (63%, similar to 2023/24).
The least commonly reported mechanism for people with lived and living experience to participate in ADP decision making was through membership in other areas of ADP governance e.g. steering group (60%, down from 67% in 2023/24). Other reported routes for people with lived/living experience to participate in decision making included through surveys, engagement with commissioned services and partnerships, staff recruitment and events such as ADP development days and practitioner forums.
All ADPs reported at least one way in which family members are able to participate in ADP decision-making. The most commonly reported way was through a group or network independent of the ADP (77% of ADPs, up from 67% in 2023/24) followed by participating through an existing ADP group, panel or reference group (70% of ADPs, similar to 2023/24). The least commonly reported way in which ADPs reported family members can participate in ADP decision-making was through ADP Board membership (47% of ADPs, slightly up from 43% in 2023/24).
Figure 2: Mechanisms for participation in ADP decision-making were more commonly reported for people with lived and living experience than for family members
Percentage of ADPs that report people with lived/living experience and family members are able to participate in ADP decision making through different mechanisms
ADPs also reported what mechanisms were in place within their ADP to ensure that services they fund involve people with lived/living experience and/or family members in decision-making, e.g. the delivery of the service. The majority of ADPs noted that this was in place through asking about it in reporting (77% of ADPs, in line with 2023/24) and almost three quarters (73% of ADPs, up from 67% in 2023/24) said this was stipulated in their contracts. Other mechanisms included this being a prerequisite in their commissioning requirements and involvement in quality improvement and risk management work.
5. Cross cutting priority: Stigma reduction
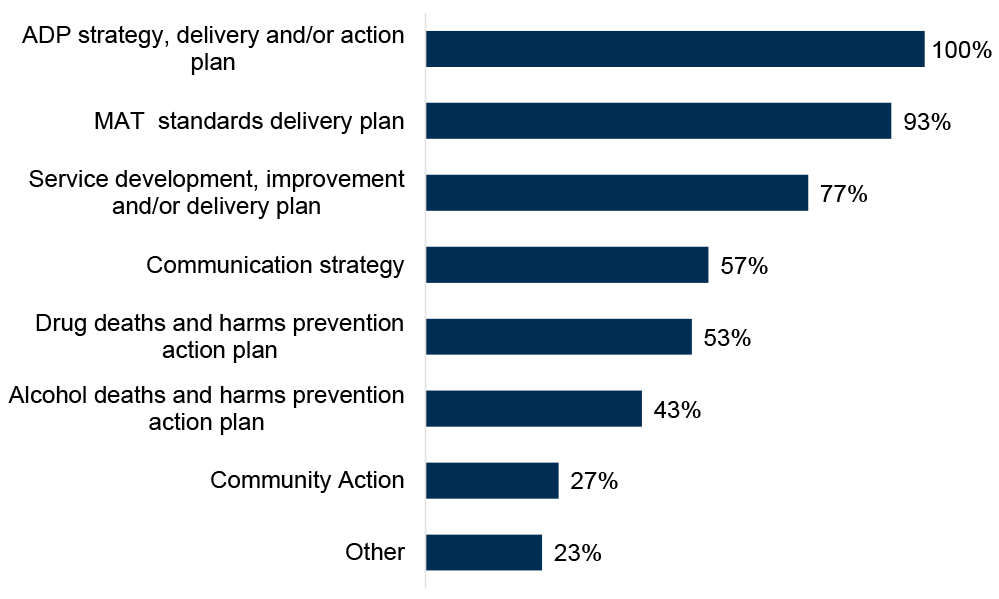
ADPs were asked within which written strategies or policies they consider stigma reduction for people who use substances and/or their families (Figure 3). All ADPs reported considering stigma reduction within their ADP strategy, delivery, and/or action plan (up from 93% of ADPs in 2023/24), and just over nine in ten ADPs (93%) reported including stigma reduction in their MAT standards delivery plan (up from 83% in 2023/24). Three quarters (77%) of ADPs reported that they consider stigma reduction in their service development, improvement and/or delivery plan (similar level to 2023/24).
There were also increases in the percentage of ADPs who reported that they considered stigma reduction in their communication strategy (57% of ADPs, up from 40% in 2023/24), drug deaths and harms prevention action plan (53% of ADPs, up from 33% in 2023/24), and in their alcohol deaths and harms prevention action plan (43% of ADPs, up from 27% in 2023/24).
Just over a quarter of ADPs (27%) reported considering stigma reduction in their community action plan (in line with 2023/24). Other ways in which ADPs reported considering stigma reduction within their written strategies or policies included via their Human Rights-Based Approach plan, Protecting People strategies, and Charter of Rights implementation toolkit.
Figure 3: All ADPs reported including stigma reduction within their ADP strategy, delivery, and/or action plan
Percentage of ADPs that reported considering stigma reduction for people who use substances and/or their families in their written policies or strategies
ADPs highlighted a range of ways in which work is underway to reduce stigma for people who use substances and/or their families. Common themes relate to the implementation of Charters of Rights and the active involvement of people with lived and living experience in steering groups, co-producing strategies, and training.
Many ADPs reported prioritisation of training and workshops for staff and partners to challenge stigma, alongside community engagement initiatives such as recovery cafés, drop-in hubs, and public events that normalise conversations around substance use.
Guidance on language was noted as important and the promotion of person-first, non-judgmental language was also reported. Several areas highlighted toolkits and communication resources, including media guidelines and stigma awareness packs, to support consistent practice. Targeted work with schools and young people, as well as family-inclusive approaches, demonstrates a focus on early intervention and holistic support. Some areas reported the use of surveys and experiential data to inform ongoing improvements.
6. Outcome 1: Fewer people develop problem substance use
Information provision
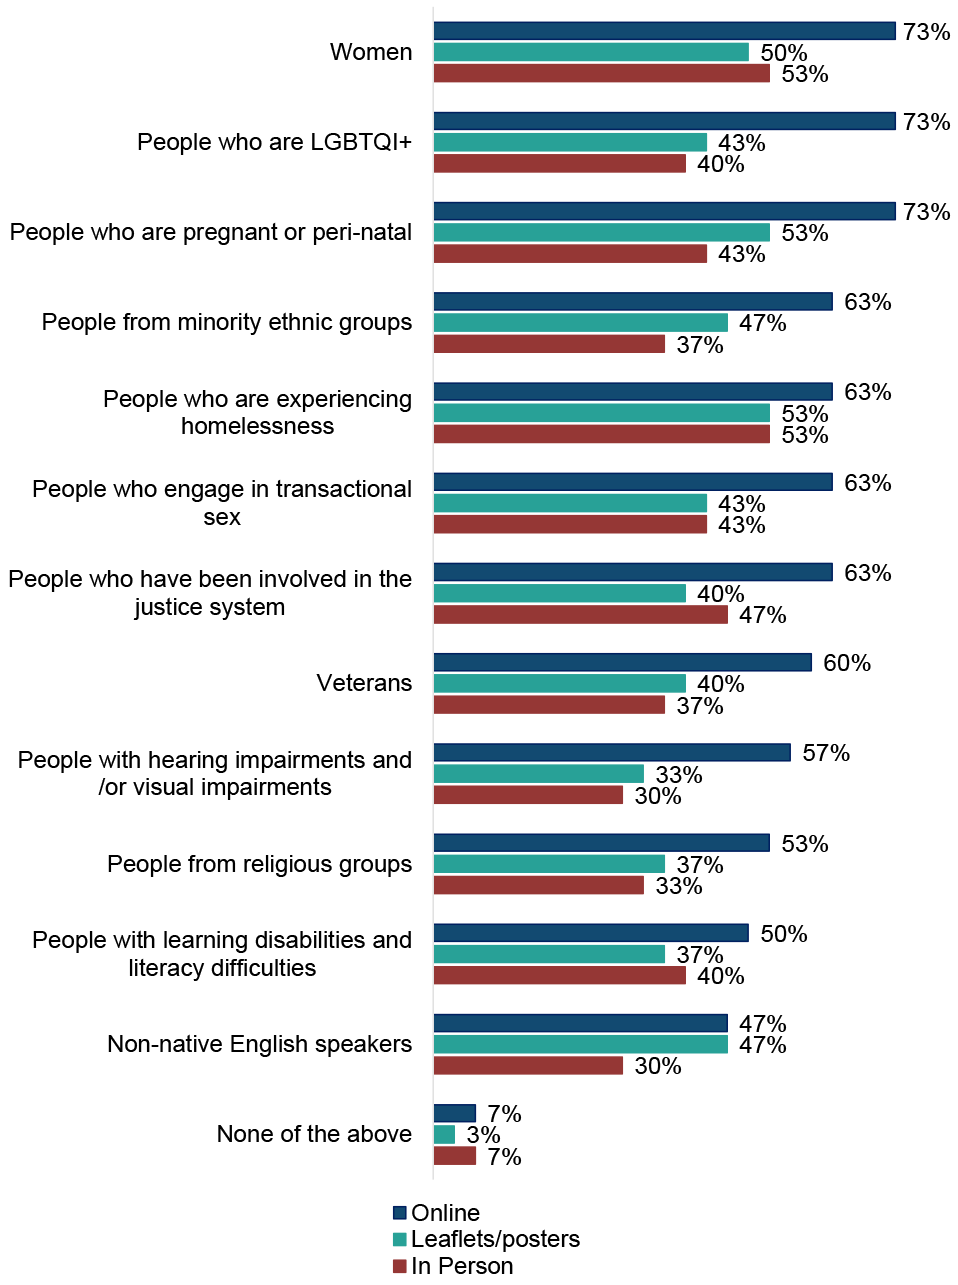
ADPs were asked how information on local treatment and support services is made available to different audiences at an ADP level[4] (shown in Figure 4). Across all groups, ADPs primarily used online approaches to communicate information, such as websites, social media and apps. In line with last year, most ADPs appeared to focus on one or two key modes of communication. Seven ADPs used all three methods for sharing information across all audience groups.
In 2024/25, the groups most widely targeted across the different communication methods were women, people who are experiencing homelessness, and people who are pregnant or peri natal. Groups least targeted through different mechanisms were non-native English speakers, people with learning disabilities and literacy difficulties, people from religious groups, and people with hearing and/or visual impairments. There was little variation in how information was targeted across the different audience groups, with online methods most common for all groups, and in person methods least common. These findings were broadly similar to those reported in the 2023/24 survey.
Figure 4: Online methods remain the most common way information on local treatment and support services is provided at an ADP level
Ways in which information on local treatment and support services is made available to different audiences at an ADP level
Prevention activities
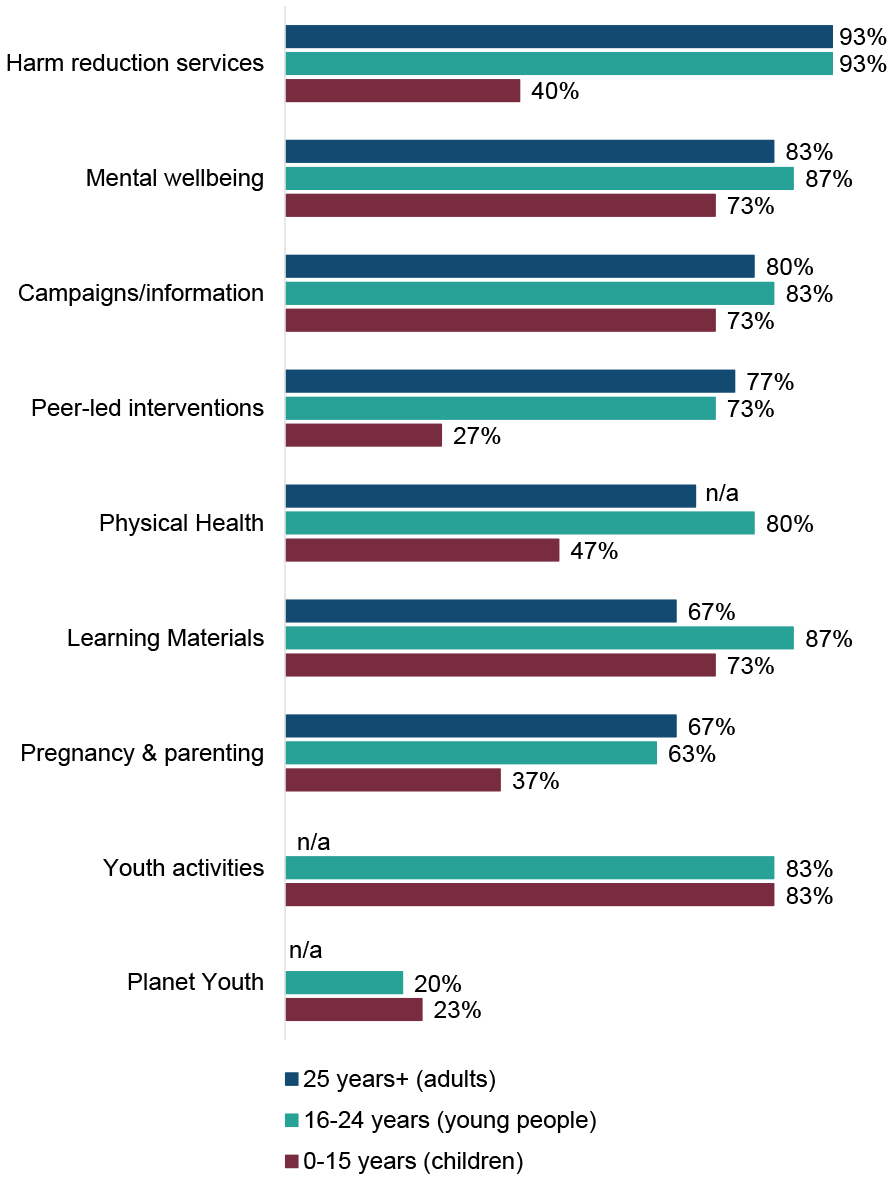
ADPs reported that they funded or supported[5] a range of education and prevention activities for different age groups, shown in Figure 5.
- Adults: the most common education or prevention activity reported was harm reduction services (93% of ADPs, similar to 2023/24), followed by mental wellbeing (83% of ADPs, similar to 2023/24) and campaigns/information (80% of ADPs, similar to 2023/24). Least common were learning materials (67% of ADPs, similar to 2023/24) and pregnancy & parenting (67% of ADPs, in line with 2023/24).
- Young people: the most common education or prevention activity reported was harm reduction services (93% of ADPs, similar to 2023/24), followed by learning materials (87% of ADPs, similar to 2023/24), mental wellbeing (87% of ADPs, similar to 2023/24), campaigns/information (83% of ADPs, in line with 2023/24) and youth activities (83% of ADPs, up from 73% in 2023/24). Least common was Planet Youth (20% of ADPs, similar to 2023/24). Note that Planet Youth is a pilot project, with six ADP areas[6] currently taking part in it.
- Children: the most commonly funded or supported education or prevention activity was youth activities (83% of ADPs, up from 77% in 2023/24), while Planet Youth (23% of ADPs, similar to 2023/24) and peer-led interventions (27% of ADPs, in line with 2023/24) were least common. A notable rise was seen in the proportion of ADPs reporting funding or supporting education or prevention campaigns/information for children (73% of ADPs, up from 57% in 2023/24).
Figure 5: A wide variety of education or prevention activities were funded or supported by ADPs
Education or prevention activities funded or supported by ADPs by age group[7]
7. Outcome 2: Risk is reduced for people who use substances
Harm reduction initiatives
ADPs were asked to report on the availability of four key harm reduction initiatives in their area: naloxone supply, Hepatitis C testing, injecting equipment provision (IEP) and wound care, shown in Figure 6.
Overall, supply of naloxone was reported to be most widely available, while injecting equipment provision was least widely available. Drug services and mobile/outreach services were reported to be providing most initiatives in most areas. These findings are consistent with those from previous years.
- Supply of naloxone: Supplies of naloxone were available in drug services in all ADP areas, followed by mobile/outreach services (93% of ADP areas), and community pharmacies and family support services (both 83% of ADP areas). Supplies of naloxone were least commonly reported to be available in sexual health services (30% of ADP areas) and general practices (33% of ADP areas). For most settings, the number of ADP areas reporting availability of naloxone was either similar to or had increased slightly from last year with notable increases in ADPs reporting supply of naloxone in women’s services (53% of ADP areas, up from 37% in 2023/24), family support services (83% of ADP areas, up from 63% in 2023/24). However, there were decreases in ADP areas reporting supply of naloxone via peer-led initiatives (73% of ADP areas, down from 83% in 2023/24).
- Hepatitis C testing: Hepatitis C testing was provided in drug services in 93% of ADP areas, in mobile/outreach services in 80% of ADP areas, and in sexual health services in 77% of ADP areas. It was least commonly available in young people’s services (7% of ADP areas) and family support services (13% of ADP areas). The most notable changes compared with last year were an increase in ADPs reporting Hepatitis C testing being offered in mental health services (30% of ADP areas, up from 23% in 2023/24), community pharmacies (40% of ADP areas, up from 33% in 2023/24) and hospitals (63% of ADPs, up from 53% in 2023/24), and a decrease in ADPs reporting Hepatitis C testing being offered in family support services (13%, down from 23% in 2023/24), justice services and peer-led initiatives (both 20% of ADP areas, both down from 27% in 2023/24).
- Injection Equipment Provision (IEP): Almost all ADPs reported providing IEP in drug services and in community pharmacies (both 97% of ADP areas), and nine in ten (90%) ADP areas reported IEP provision in mobile/outreach services. IEP was least commonly available in young people’s services and general practices (both 7% of ADP areas). There were both increases and decreases in the number of ADPs reporting availability of IEP in particular settings in their area compared to last year. The largest percentage increase was in the availability of IEP in women’s services (17% of ADP areas, up from 10% in 2023/24) while the largest percentage decrease was in the availability of IEP in family support services (10% of ADP areas, down from 17% in 2023/24).
- Wound Care: Almost all ADPs reported wound care was available in drug services (97% of ADP areas), followed by hospitals (83% of ADP areas) and general practices (80% of ADP areas). It was least commonly available in family support services and young people’s services (both at 7% of ADP areas). There were both increases and decreases in ADPs reporting availability of wound care in specific settings compared with last year, with the greatest percentage increases being in women support services (17% of ADP areas, up from 10% in 2023/24) and sexual health services (20% of ADP areas, up from 13% in 2023/24). The greatest percentage decrease was in the availability of wound care in family support services (7% of ADP areas, down from 13% in 2023/24).
ADPs reported a wide range of changes to the delivery of harm reduction initiatives across different settings. Several ADPs reported expansion of harm reduction initiatives by increasing service reach and integrating interventions into new settings. Examples included the implementation of additional harm reduction sites, mobile outreach teams, and community drop-ins to improve access, particularly in rural areas.
Several ADPs noted that they had embedded harm reduction within MAT services, in line with MAT Standard 4, and introduced enhanced interventions such as wound care, blood-borne virus (BBV) testing – in some areas there was expansion of the WAND model (incentivised engagement with a structured intervention providing Wound care, Assessment of injecting risk, Naloxone, and Dry Blood Spot Testing). Community pharmacies were reported to have played a growing role in distributing injecting equipment and take-home naloxone.
Changes to settings in which harm reduction initiatives had been delivered in the past year were reportedly driven by a mix of factors including service redesign, building restructures, responses to emerging drug trends such as nitazenes, and increased demand for harm reduction to cater to users of cocaine and crack.
Funding shifts also influenced delivery, with some areas losing peer naloxone champions while others invested in new harm reduction posts and outreach capacity. Innovations such as harm reduction cafés, prison-based peer engagement, and safer drug consumption facilities were also highlighted.
| Type of Service | Supply of naloxone | Hepatitis C testing | IEP | Wound care |
|---|---|---|---|---|
| Drug services | 100% | 93% | 97% | 97% |
| Mobile/outreach services | 93% | 80% | 90% | 67% |
| Community pharmacies | 83% | 40% | 97% | 43% |
| Family support services | 83% | 13% | 10% | 7% |
| Homelessness services | 77% | 40% | 37% | 27% |
| Peer-led initiatives | 73% | 20% | 30% | 10% |
| Justice services | 73% | 20% | 17% | 13% |
| Prison | 70% | 60% | 20% | 53% |
| Hospitals | 70% | 63% | 17% | 83% |
| Women support services | 53% | 20% | 17% | 17% |
| Young people's services | 47% | 7% | 7% | 7% |
| Mental health services | 43% | 30% | 17% | 20% |
| General practices | 33% | 70% | 7% | 80% |
| Sexual health services | 30% | 77% | 20% | 20% |
|
% of ADPs where initiative is available in each setting |
0% | 25% | 50% | 100% |
Demand for harm reduction interventions
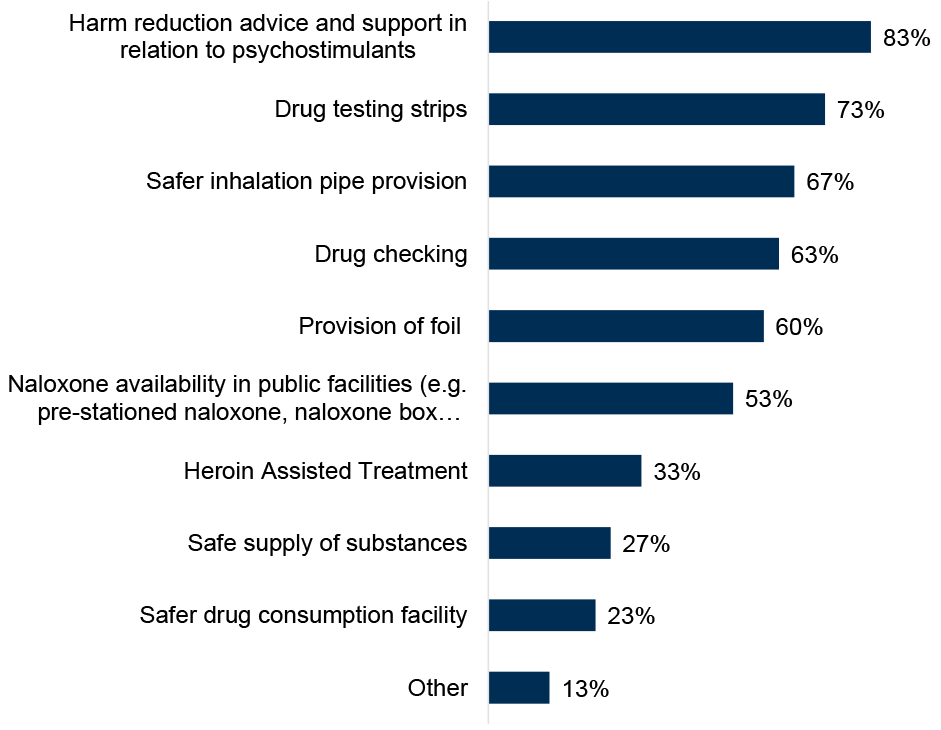
ADPs were asked which harm reduction interventions there was currently a demand for in their area, either where the intervention is not currently provided or where demand exceeds current supply,[8] shown in Figure 7. The highest reported demand was for harm reduction advice and support in relation to psychostimulants (83% of ADPs, new option in the 2024/25 survey) and drug testing strips (73% of ADPs, a notable increase from 50% in 2023/34). The lowest reported demand was for safer drug consumption facilities (23% of ADPs, similar to 2023/24), and safe supply of substances (27% of ADPs, similar to 2023/24). In addition to the specific harm reduction initiatives listed in the survey, ADPs also reported current demand for ketamine harm reduction, trauma-informed psychological support and safer snorting equipment. [9]
Figure 7: Demand was most frequently reported for harm reduction advice and support in relation to psychostimulants, and drug testing strips
Percentage of ADPs reporting a current demand for specific harm reduction interventions
In general, ADPs noted that demand for harm reduction initiatives was generally reported by service staff, third sector partners and service users, including through MAT standards experiential engagement and within specific programmes such as the WAND (Wound care, Assessment of injecting risk, Naloxone, and Dry Blood Spot Testing model) initiative in Glasgow. However, several said that it is challenging to quantify demand. ADPs highlighted that changing drug trends away from opioids and towards psychostimulants, particularly cocaine, were associated with changing demand for harm reduction services to cater to this. ADPs highlighted the increased risk of synthetics (particularly nitazenes) and associated demand for rapid drug testing. Legal barriers to distributing safer inhalation devices were also noted.
Almost all ADPs (93%) reported they had an adequate supply of naloxone to meet general needs. One ADP reported they do not have an adequate supply to meet general needs, and one ADP was unsure. Within the context of a more toxic and unpredictable drug supply which may require higher doses of naloxone to be administered, ADPs were also asked if they had an adequate supply of naloxone to meet demand if a significant incident were to occur. Seven in ten ADPs (73%) reported they had an adequate supply within this context and two in ten ADPs (23%) reported they were unsure. One ADP reported that they do not have an adequate supply for this scenario.
8. Outcome 3: People most at risk have access to treatment and recovery
Near-fatal overdose pathways
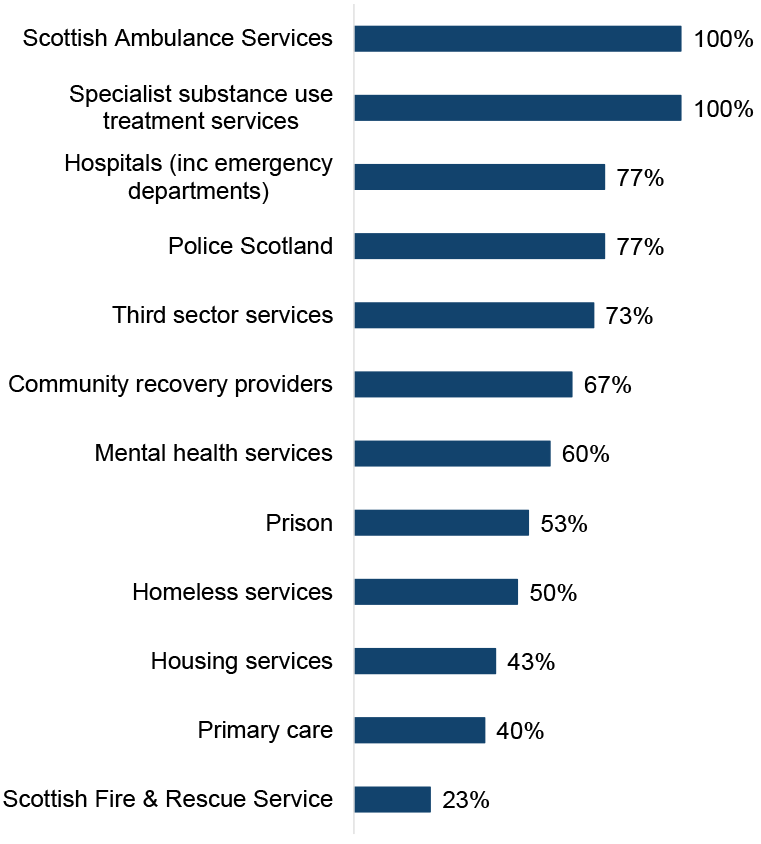
All ADPs reported having documented pathways through both the Scottish Ambulance Service and specialist substance use treatment services for people who have experienced a near-fatal overdose (NFO) to be identified and offered support, shown in Figure 8.
NFO pathways were also commonly reported to be in place through hospitals (77% of ADPs, similar to 2023/24), Police Scotland (77%, up from 67% in 2023/24) and third sector substance use services (73%, similar to 2023/24). Two thirds of ADPs (67%) reported having documented NFO pathways in place through community recovery providers (slight increase on 60% in 2023/24) and six in ten ADPs (60%) reported having NFO pathways in place through mental health services (up from 43% in 2023/34).
ADPs least commonly reported having NFO pathways in place through the Scottish Fire and Rescue Service (23%, up from 17% in 2023/24), primary care (40%, up from 23% in 2023/24), housing services (43%, up from 27% in 2023/24) and homeless services (50%, up from 37% in 2023/24).
ADPs identified areas where NFO pathways were in development, including in hospitals (20% of ADP areas, similar to 2023/24), housing services (17% of ADP areas, in line with 2023/24), homeless services (13% of ADP areas, in line with 2023/24), mental health services (13% of ADP areas, down from 20% in 2023/24), and third sector services (10% of ADP areas, up from 3% in 2023/24). Other responses included pathways in development through criminal justice services and unscheduled care.
Some ADPs indicated that an NFO pathway was both in place and in development due to work to improve or review existing pathways.
Figure 8: All ADPs reported having documented near fatal overdose pathways with the Scottish Ambulance Service and specialist substance use services
Percentage of ADPs with documented NFO pathways in place
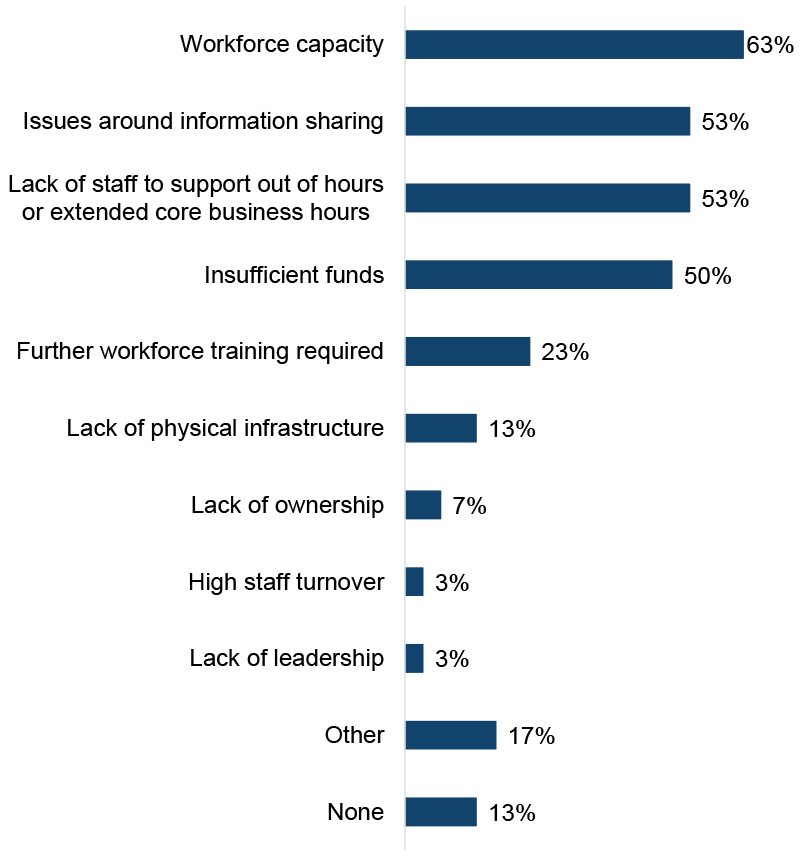
ADPs were asked what barriers to implementing NFO pathways[10] exist in their area, as shown in Figure 9. The most commonly reported barriers were workforce capacity (63% of ADP areas, up from 50% in 2023/24), issues around information sharing (53% of ADP areas, in line with 2023/24), lack of out-of-hours staff (53% of ADP areas, not asked in 2023/24) and insufficient funds (50% of ADP areas, in line with 2023/24).
The least commonly reported barriers were lack of leadership (3% of ADPs compared with none in 2023/24) and high staff turnover (3% of ADP areas, not asked in 2023/24 survey). There was a decrease in reporting of barriers around further workforce training requirements (23% of ADP areas, down from 37% in 2023/24) and lack of ownership (7% of ADP areas, down from 13% in 2023/24). Other reported barriers to NFO pathway implementation included geographical challenges and infrastructure to support out-of-hours working.
The percentage of ADP areas reporting no barriers to implementing NFO pathways remained unchanged from last year’s survey (13%).
Figure 9: Key barriers to NFO pathway implementation were limited workforce capacity, issues around information sharing, and lack of out-of-hours staff
Percentage of ADPs reporting barriers to implementing NFO pathways
Justice partnerships
ADPs were asked in what ways they have worked with justice partners[11] at strategic, operational and service levels. Overall, there has generally been an increase in the number of ADPs reporting that they have worked with justice partners at all levels since last year’s survey.
- Strategic level: Working with justice partners was most widely reported at a strategic level, and the number of ADPs reporting each activity had either increased, or was similar to, last year’s level. All ADPs had justice organisations represented on the ADP and representation on local Community Justice Partnerships. Around nine in ten ADPs reported that justice partners contributed to strategic planning (93%, slight increase from 87% in 2023/24). Around nine in ten ADPs also reported that they coordinated activities between justice, health or social care partners (90%, similar to 2023/24). Around eight in ten ADPs reported providing advice and guidance (83% of ADPs, similar to 2023/24) and data sharing (also 83%, up from 67% in 2023/24). Other ways ADPs reported working with justice partners at a strategic level included collaborative working, MAT implementation in justice settings, lived/living experience involvement and analytical support.
- Operational level: At an operational level, there was generally an increase in ADPs reporting that they have worked with justice partners. Nearly nine in ten (87%) of ADPs reported that they had worked with justice partners to raise awareness about community-based treatment options (up from 70% in 2023/24) and the same number (87%) reported supporting staff training on drug or alcohol related issues (up from 77% in 2023/24). Almost eight in ten ADPs (77%) reported working with justice partners on activities to support implementation of MAT standards (a new option in the 2024/25 survey) and just over a quarter (27%) reported that they had provided funding or staff for a specialist court (in line with 2023/24). Other ways ADPs reported working with justice partners at an operational level included shared training, naloxone training for criminal justice staff, development of a peer worker programme, and funding of support workers.
- Service level: Funding or supporting services for people transitioning out of custody was the activity most widely reported (83% of ADPs, up from 73% in 2023/24), followed by funding or supporting services in police custody suites (77% of ADPs, up from 67% in 2023/24), and funding or supporting services specifically for Drug Treatment and Testing Orders[12] (77% of ADPs, up from 53% in 2023/24). Seven in ten (73%) ADPs reported that they funded or supported services specifically for people serving Community Payback Orders with a Drug or Alcohol Treatment Requirement (up from 57% in 2023/24) and half of ADPs (50%, similar to 2023/24) reported funding or supporting services in prisons or young offenders’ institutions. A third of ADPs (33%) reported that they funded or supported navigators for people in the justice system who use drugs (similar to 2023/24). Other ways ADPs reported working with justice partners at a service level included funding or support for recovery communities, peer support provision and independent advocacy.
Activities within the justice system
ADPs supported a range of activities at different stages of engagement with the justice system, shown in Figure 10.[13] In line with last year’s survey, activities were most widely supported upon release from prison, and least widely supported at the court stage. The percentage of ADPs supporting activities mostly increased or was broadly similar to 2023/24 at the pre-arrest, in police custody, in prison and upon release stages and decreased slightly for activities at the in-court stage.
- Pre-arrest: the most commonly reported activity supported by ADPs was harm reduction including naloxone, and referral to drug and alcohol treatment services (both 60% of ADPs, broadly similar to 2023/24), while health education and life skills were least common (37% of ADPs, in line with 2023/24). The activities with the largest increases in ADPs reporting support at the pre-arrest stage were advocacy or navigators (43% of ADPs, up from 30% in 2023/24), medically supervised detoxification (43% of ADPs, up from 30% in 2023/24) and alcohol interventions (53% of ADPs, up from 40% in 2023/24).
- In police custody: the most commonly reported activity was referral to drug and alcohol treatment services (87% of ADPs, broadly similar to 2023/24), while recovery activities were least commonly reported (20% of ADPs, down from 30% in 2023/24). The activity with the largest increase in ADPs reporting support at the in police custody stage was medically supervised detoxification (33% of ADPs, up from 23% in 2023/24).
- In courts: ADPs reported the lowest level of support for activities at the in court stage compared to all other stages. The most commonly reported activity was referral to drug and alcohol treatment services (50% of ADPs, slight increase from 43% in 2023/24). Health education and life skills (13%, similar to 2023/24), medically supervised detoxification (13%, in line with 2023/24), and staff training (13%, slight decrease from 20%) were the least commonly reported activities at this stage. The activity with the largest increase in ADPs reporting support at this stage was alcohol interventions (40% of ADPs, up from 30% in 2023/24).
- In prison: referral to drug and alcohol treatment services (80% of ADPs, up from 67% in 2023/24) was the most commonly reported activity supported by ADPs at this stage. Advocacy or navigators (33% of ADPs, down from 43% in 2023/24) and staff training (33% of ADPs, similar to 2023/24) were the activities least commonly supported.
- Upon release: ADPs reported the highest level of support for activities at the release stage compared to all other stages. All ADPs reported supporting referrals to drug and alcohol treatment services (up from 90% in 2023/24). Staff training was least often reported, but still relatively common (57% of ADPs, in line with 2023/24). Drug and alcohol use and treatment needs screening, saw the largest increase at this stage compared to last year’s survey (73% of ADPs, up from 60% in 2023/24).
| Activity | Pre-arrest[14] | In police custody[15] | In courts[16] | In prison[17] | Upon release[18] |
|---|---|---|---|---|---|
| Referrals to drug and alcohol treatment services | 60% | 87% | 50% | 80% | 100% |
| Harm reduction including naloxone | 60% | 73% | 33% | 60% | 87% |
| Opioid Substitution Therapy | 47% | 50% | 17% | 63% | 83% |
| Recovery (e.g. café, community) | 50% | 20% | 17% | 53% | 77% |
| Alcohol interventions | 53% | 60% | 40% | 50% | 73% |
| Drug and alcohol use and treatment needs screening | 47% | 60% | 30% | 50% | 73% |
| Psychological and mental health based interventions | 43% | 47% | 17% | 50% | 70% |
| Psychological and mental health screening | 43% | 50% | 17% | 53% | 70% |
| Medically supervised detoxification | 43% | 33% | 13% | 43% | 67% |
| Advocacy or navigators | 43% | 43% | 17% | 33% | 63% |
| Health education & life skills | 37% | 23% | 13% | 40% | 63% |
| Staff training | 43% | 37% | 13% | 33% | 57% |
| % of ADPs where activity is available at each stage | 0% | 25% | 50% | 100% |
|---|
Support for people involved in the justice system
ADPs were asked what barriers to accessing support were in their area (if any) for people involved in the justice system. The most commonly reported barrier was lack of services tailored specifically to people who are on Community Payback Orders, Drug Treatment and Testing Orders, Supervised Release Orders and other community orders (30% of ADPs), while the least commonly reported barrier was services with entry requirements which exclude people on Community Payback Orders, Drug Treatment and Testing Orders, Supervised Release Orders and other community orders (7% of ADPs).[19]
Around two in ten ADPs reported that services with entry requirements which exclude people convicted of specific offences such as arson (23%), lack of accessibility to mainstream alcohol and drug services and support services (20%), and lack of specific pathways for people who are involved in the justice system (17%) were barriers to accessing support for this group. One in ten ADPs (10%) reported that lack of support for people who are involved in the justice system after receiving treatment was a barrier.
Other barriers reported included housing issues, restrictions around multi-agency public protection arrangements, geographical challenges, and lack of availability of services in court. A quarter of ADPs (23%) reported that there were no barriers to accessing support in their area for people who are involved in the justice system.
ADPs were also asked what types of residential services are available in their area which can be accessed by people who are subject to Community Payback Orders, Drug Treatment and Testing Orders, Supervised Release Orders and other community orders to access support. Seven in ten ADPs (70%) reported that mainstream residential rehabilitation services (i.e. those open to anyone) were available in their area. Four in ten ADPs (43%) reported that mainstream stabilisation/crisis services were available in their area. Residential services specifically targeted at people in the justice system (such as Turnaround), and mainstream residential services other than rehabilitation (e.g. recovery housing) were each reportedly available in a third of ADP areas (33%). Some ADPs noted that there were no residential rehabilitation facilities in their ADP area.
Drug and alcohol testing services
ADPs were asked whether they had drugs and alcohol testing services in their ADP area for people going through the justice system on an order or license. Overall, testing services for drugs were around twice as common as testing services for alcohol (80% of ADPs compared to 43%, respectively). Just over one in ten ADPs (13%) reported that they do not have these services in their ADP area.
ADPs were asked who provides testing services for drugs and/or alcohol. For both alcohol and drugs, testing was most commonly reported to be provided by NHS addiction services (alcohol: 60% of ADP areas, drugs: 77% of ADP areas). Some ADPs reported local testing arrangements including through the justice service such as through Drug Testing and Treatment Order teams and justice social work staff. Private provider testing services were around twice as common for drug testing (13% of ADP areas) than alcohol testing (7% of ADP areas).
ADPs were asked what methods were used for drugs and/or alcohol testing. Urine and spit tests were the primary methods reportedly used for drug testing (reported by 73% and 60% of ADP areas respectively). Alcohol testing reportedly uses a more varied approach. Handheld devices were the most commonly reported alcohol testing method (40% of ADP areas), followed by urine tests (37% of ADP areas) and spit tests (27% of ADP areas). No ADPs reported using electronic monitoring or patches for drug or alcohol testing. Other methods reported were the use of oral swabs, especially for drug testing, and breathalysers for alcohol testing.
Note that the survey questions regarding who provides drug and alcohol testing services, and the methods employed, did not clarify whether this referred specifically to testing for individuals within the justice system or to testing more broadly. Consequently, there may be variation in how ADPs interpreted these questions.
9. Outcome 4: People receive high quality treatment and recovery services
Screening options for alcohol harms
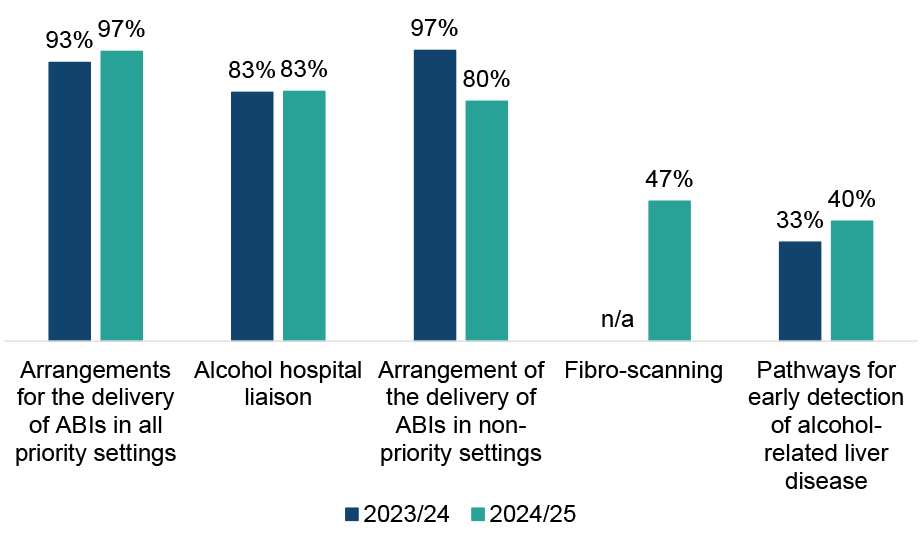
All ADPs reported having at least one screening option in place in their ADP area to address alcohol harms (Figure 11). Nearly all ADP areas (97%) had arrangements for the delivery of alcohol brief interventions (ABIs[20]) in priority settings, similar to 2023/24. Fewer ADPs reported having arrangements in place for the delivery of ABIs in non-priority settings compared with last year (80% of ADP areas, down from 97% in 2023/24). Almost half of ADPs (47%) reported having fibro scanning in place in their area (new option in this year’s survey).
Pathways for early detection of alcohol-related liver disease were least commonly reported (40% of ADP areas, up from 33% in 2023/24). Other alcohol harm screening options included use of the Alcohol Use Disorders Identification Test tool, use of a severity of alcohol dependence questionnaire and substance misuse liaison nurses.
Figure 11: Arrangements are most common for delivering ABIs in priority and non-priority settings, and for alcohol hospital liaison; however, reported provision for delivery of ABIs in non-priority settings has declined
Percentage of ADPs with screening options to address alcohol harms in place
Treatment options for alcohol harms
A range of treatment options to address alcohol harms were reported to be in place in all ADP areas, similar to 2023/24. All ADPs reported residential rehabilitation, psychosocial counselling, community-based alcohol detox (including at home), and access to alcohol medication (e.g. Antabuse, Acamprase, etc.) were in place. The least common treatment options were alcohol-related cognitive testing e.g. for alcohol-related brain damage (80% of ADP areas, in line with 2023/24) and alcohol hospital liaison (80% of ADP areas, down from 93% in 2023/24). Other responses included use of alcohol diaries, mobile outreach vans and referrals to in-patient alcohol detox in other areas where beds are not available within the ADP area.
Residential rehabilitation
All ADPs reported a range of barriers to residential rehabilitation. The most commonly reported barrier was availability of stabilisation/crisis services (70% of ADPs, similar to 2023/24), followed by availability of detox services (63% of ADPs, up from 53% in 2023/24). Around half of ADPs reported barriers around insufficient base funding (53% of ADPs, a notable reduction from 77% of ADPs in 2023/34), lack of bed capacity within ADP area (53% of ADPs, similar to 2023/24), geographic distance (47% of ADPs, new option for 2024/25 survey) and waiting times (47% of ADPs, slight decrease from 53% in 2023/24).
The least commonly reported barriers were difficulty identifying those who will benefit (13% of ADPs, similar to 2023/24), and lack of awareness of residential rehabilitation amongst referrers (13% of ADPs, a new response option added in 2024/25).
Fewer ADPs reported that lack of specialist providers was a barrier compared to last year (33% of ADPs, down from 57% in 2023/24). Other responses included some providers requiring restrictions on the level of medication clients were taking upon entry, lack of integrated pre- and post-care services, a lack of facilities specialising in working with people with complex trauma, and restrictions around how funding can be used.
ADPs reported a range of actions being taken to overcome barriers to residential rehabilitation. In relation to pathways, several ADPs highlighted work with Healthcare Improvement Scotland to review and improve local residential rehabilitation pathways, with some implementing action plans and oversight groups to monitor and improve access. Additionally, some ADPs reported use of resources to better inform service users and families, and others highlighted changes in criteria to enable easier access to residential rehabilitation.
Amongst ADPs who highlighted funding challenges as a barrier to residential rehabilitation, some reported use of additional funding, such as the Additional Placement Fund, to support placements. Others reported exploring external funding for pre-post rehab support.
A number of ADPs reported actions targeting improvement of pre-and post rehab support, such as the implementation of specific roles and services to support individuals, as well as training for staff. ADPs highlighted the role of review groups including lived and living experience input. Engagement with residential rehabilitation providers to improve coordination and communication was also highlighted.
Around six in ten ADPs (57%) reported having made revisions or updates to their pathways to residential rehabilitation in the last year. There was wide variation in the types of revisions made, which included: changes to pathways offered, such the expansion of referral sources and services offered, including those pre- and post-rehab; work to align with the National Framework; independent evaluation of residential rehabilitation pathways and subsequent implementation of recommendations; and updates to standard operation procedures to clarify roles and responsibilities.
ADPs were asked if there were any specific groups in their ADP area who do not have their needs met by the current residential rehabilitation provision (for reasons such as lack of appropriate models of care, inadequate capacity, location of services or any other factors). Fewer than a third of ADPs reported that any of the specific groups listed do not have their needs met by the current residential rehabilitation provision.
The specific groups ADPs most commonly reported to not have their needs met by the current provision were people with child dependents (30% of ADPs) and people with co-occurring mental health problems (27% of ADPs). Other groups identified included young people (under 18s), people from minority ethnic communities, non-native English speakers, veterans and people who do not live in an ADP area with a residential rehabilitation facility (particularly those living in island communities). Some ADPs noted that they have planned work targeted towards better understanding the needs of specific groups and identifying barriers.
MAT standards
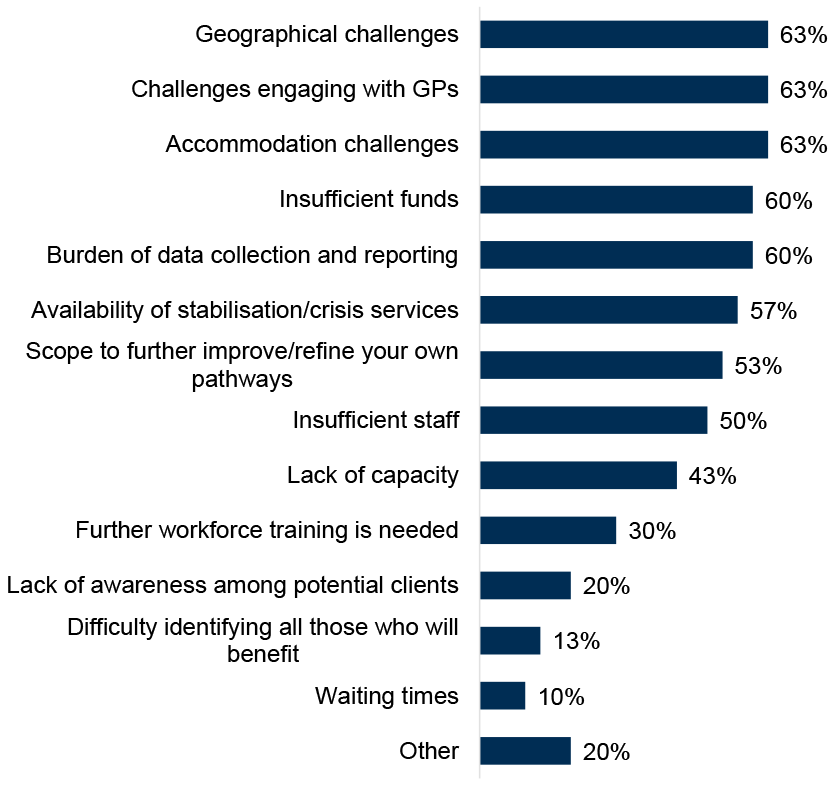
All ADPs reported barriers to implementing the Medication Assisted Treatment (MAT) standards existing in their area (Figure 12). Geographical challenges, challenges engaging with GPs, and accommodation challenges (e.g. appropriate physical spaces, premises etc.) were the most commonly reported barriers (all at 63% of ADPs and similar to 2023/24 where data is available). Scope to further improve/refine their own pathways (53% of ADPs, up from 40% in 2023/24) and availability of stabilisation/crisis services (57% of ADPs, up from 47% 2023/24) were both more commonly reported barriers compared to last year. Fewer ADPs reported waiting times (10% of ADPs, down from 20% in 2023/24), insufficient funding (60% of ADPs, down from 70% in 2023/24), or lack of capacity (43% of ADPs, down from 53% in 2023/24) as barriers compared to last year’s survey. Other barriers highlighted included challenges in capacity for psychological staff and training, the challenges of long-term service provision for non-recurring funding streams, and lack of advocacy.
Figure 12: Challenges around accommodation, geography and engaging with GPs were most frequently cited barriers to implementing the MAT standards
Percentage of ADPs that identified barriers to implementing MAT in their area
ADPs reported addressing implementation barriers to MAT through service redesign, such as introducing mobile prescribing, integrating care with primary and third-sector services, and establishing community hubs. To improve access, many are enhancing outreach efforts, providing transport support, and increasing public awareness through campaigns and drop-in services.
Workforce challenges are reportedly being tackled with targeted recruitment, temporary staffing, and dedicated roles to support MAT delivery. Collaboration across health, social care, and third-sector partners is a key strategy, with the aim of streamlining referral pathways and improving service coordination.
Several ADPs highlighted quality improvement work supported by experiential data collection, with collaboration across some areas ensuring consistency in data reporting for the same health board. Some areas reported realigning budgets to address financial constraints. Infrastructure improvements, such as creating more accessible service locations, are also being pursued to enhance engagement and reduce stigma.
Substances
ADPs were asked to rank which substances are the highest priority in their area for treatment and support, other than opioids. A number of ADPs reported that it was not possible to meaningfully rank the priority of substances. Where ADPs did provide a priority ranking, alcohol, polydrug use, and cocaine and other stimulants were most commonly reported as higher priority, while cannabis/cannabinoids were most commonly ranked as lowest priority. A range of priority rankings were reported by ADPs for treatment and support for ketamine and pregabalin/gabapentin, while street benzodiazepines were typically reported as mid-level priority. ADPs also mentioned treatment and support for use of nitazenes is a priority.
Services for young people
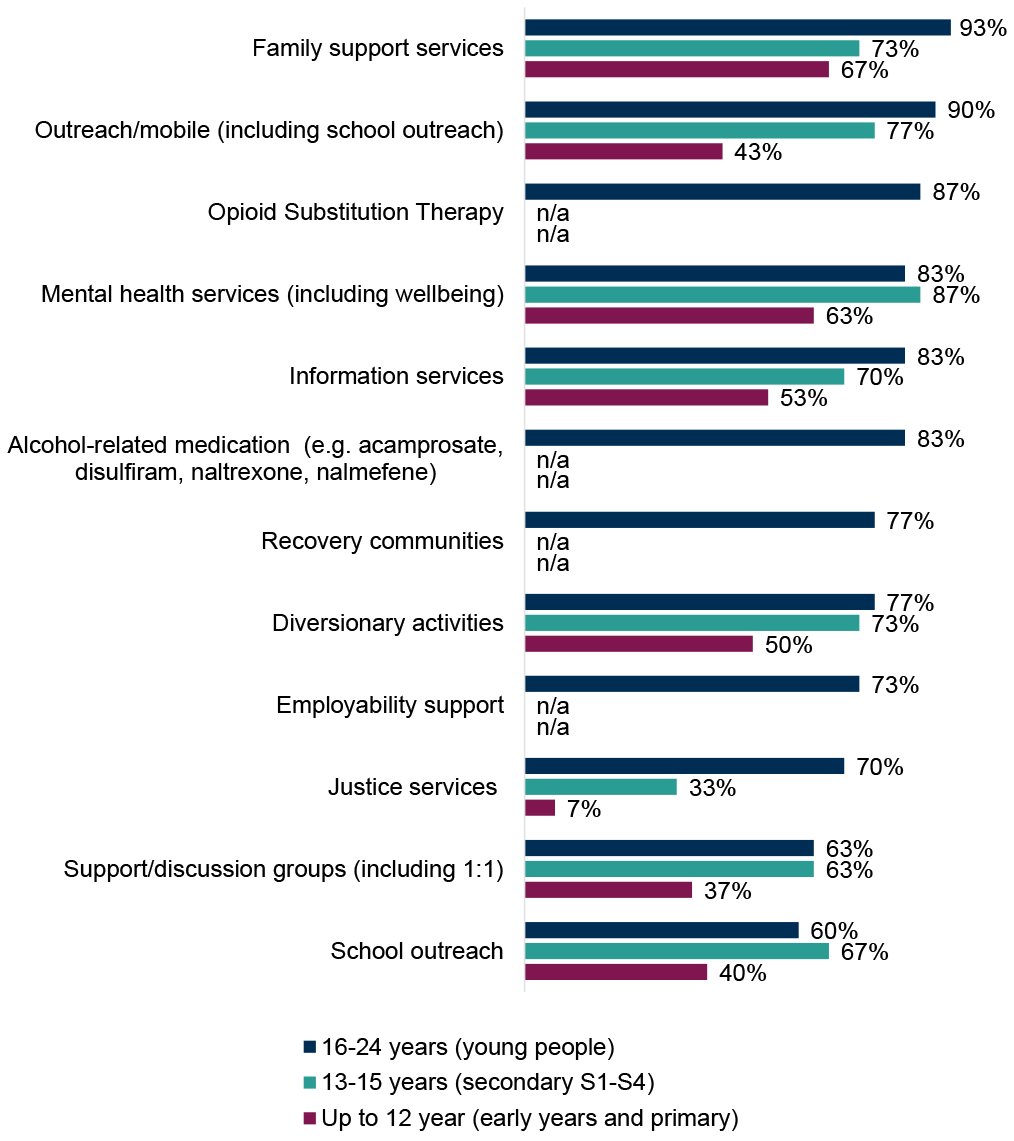
ADPs reported a range of treatment and support services in place specifically for children and young people using alcohol and/or drugs, where different types of support varied by age group (Figure 13). Overall, the widest variety of services were reported to be available for young people (16-24 years old), with the smallest range provided for early years and primary age (up to 12 years old), similar to 2023/24. Combined across all age groups, family support services, mental health services (including wellbeing), outreach/mobile, information services and diversionary activities were the most commonly provided services.
- Young people (16-24 years): the most commonly reported services were family support services (93% of ADP areas, similar to 2023/24), followed by outreach/mobile services (90% of ADP areas, up from 77% in 2023/24) and OST (87% of ADP areas, similar to 2023/24). There was an increase in ADPs reporting provision of school outreach (60% of ADPs, up from 50% in 2023/24), mental health services (83% of ADPs, up from 73% in 2023/24) and information services (also 83% of ADPs, up from 73% in 2023/24) for this age group compared with last year. Reported provision of employability support decreased (73% of ADPs, down from 87% in 2023/24). School outreach (60% of ADP areas, up from 50% in 2023/24) and support/discussion groups including 1:1 (63% of ADPs, down slightly from 70% in 2023/24) were the least common services reported for this age group.
- Secondary S1-S4 (13-15 years): for secondary school age children using alcohol and/or drugs, provision of mental health services (87% of ADPs, up from 70% in 2023/24) and outreach/mobile services (77% of ADPs, up from 60% in 2023/24) were most commonly reported and had both increased since last year. Justice services were the least commonly reported service for this age group (33% of ADPs, down from 40% in 2023/24).
- Early years and primary (up to 12 years): provision of family support services (67% of ADPs, similar to 2023/24) and mental health services (63% of ADPs, up from 50% in 2023/24) were most commonly reported. The least commonly reported service for this age group was justice services (7% of ADPs, in line with 2023/24). The number of ADPs reporting provision of information services (53% of ADPs, up from 43% in 2023/24) and outreach/mobile services (43% of ADPs, up from 30% in 2023/24) for this age group both saw a rise in 2024/25.
Other responses included children and young people being supported by a range of services including prevention and early intervention services, psychological interventions, psychoeducational approaches, Children and Adolescent Mental Health Services (CAMHS), social work, and homeless accommodation outreach. Some ADPs reported they had no specific services in place for some age groups, and a gap for 16/17-year-olds in relation to Opioid Substitution Therapy.
Figure 13: ADPs reported a range of treatment and support services in place specifically for children and young people using alcohol and/or drugs
Percentage of ADPs where treatment and support services are in place specifically for children and young people using drugs and/or alcohol.[21]
10. Outcome 5: Quality of life is improved by addressing multiple disadvantages
Services for specific groups
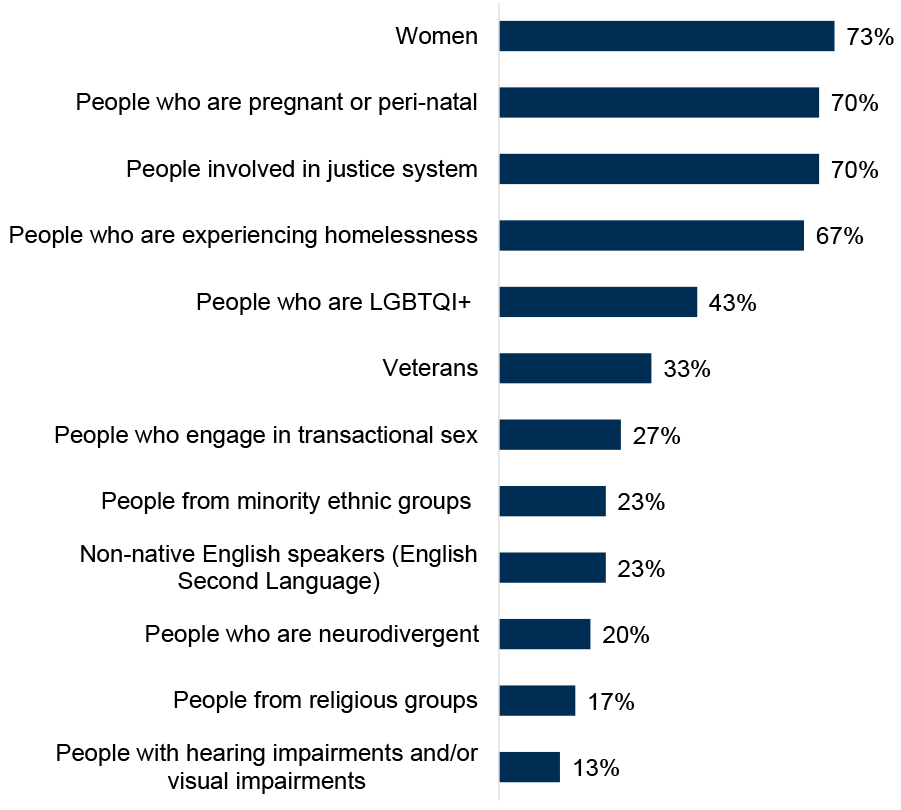
ADPs reported having specific treatment and support services for a range of groups, shown in Figure 14. Overall, the number of ADPs reporting that they have specific services in place for the specific groups listed in the survey had generally increased from, or was broadly in line with, last year.
Around three quarters of ADPs reported that there were specific services in place in their ADP area for women (73% of ADPs, in line with 2023/24). Seven in ten ADPs reported having specific services in place for people involved in the justice system (70% of ADPs, new option for 2024/25 survey) and people who are pregnant or peri-natal (70% of ADP areas, up from 60% in 2023/24).
There was an increase compared with last year in ADPs reporting specific services for veterans (33% of ADPs, up from 23% in 2023/24). Specific services were least commonly reported to be in place for people with hearing and/or visual impairments (13% of ADPs, similar to 2023/24) and people from religious groups (17% of ADP areas, similar to 2023/24). Some ADPs noted that the size or geography of their ADP did not allow them to offer a full range of services but that groups would be supported in line with individual needs.
Figure 14: Specific treatment and support services were most commonly in place for women, people involved in the justice system, people who are pregnant or perinatal and people experiencing homelessness
Percentage of ADPs with treatment and support services in place for specific groups
Mental health
Eight in ten ADPs (83%, slight reduction from 87% in 2023/24) reported that they had formal joint working protocols in place to support people with co-occurring substance use and mental health diagnoses to receive mental health care. Several ADPs who reported that they did not have a formal protocol in place highlighted that this is currently in development.
For those with protocols in place, many of these were delivered as part of MAT standard 9 (“All people with co-occurring drug use and mental health difficulties can receive mental health care at the point of MAT delivery”) improvement work. Several ADPs reported having Standard Operating Procedures in place to guide collaboration between mental health and substance use services. In some areas, services are co-located or have integrated teams with staff trained across both domains. Many areas also noted shared guidance documents and joint care planning processes.
All ADP areas reported having some arrangements in place for people who present at substance use services with mental health problems for which they do not have a diagnosis. Pathways for referral to mental health services or other multidisciplinary teams were most commonly reported (93% of ADP areas, up from 80% in 2023/24), followed by professional mental health staff within services (90% of ADP areas, down slightly from 97% in 2023/24). Dual diagnosis teams were least commonly reported (10% of ADP areas, down from 17% in 2023/24). Other arrangements included joint work with Psychiatry of Old Age service and advanced nurse practitioners to support pathway development and care planning.
Other support services
ADPs reported a variety of approaches to work with support services not directly linked to substance use (e.g. welfare advice, housing support, etc.) to address multiple disadvantages. In 2024/25, all ADPs reported working with these services through partnership working (2023/24: 97% of ADP areas).
Almost all ADPs reported working with other support services via representation on strategic groups or topic-specific sub-groups (97% of ADP areas, in line with 2023/24), and almost nine in ten ADPs (87%, similar to 2023/24) worked with other services through their representation on the ADP board. Seven in ten ADPs areas (70%, up from 60% in 2023/24) worked with support services not directly linked to substance use via provision of funding. Other responses included independent advocacy, training opportunities, and working with local authorities to develop plans to address the needs of people at risk of homelessness.
Trauma-informed approaches
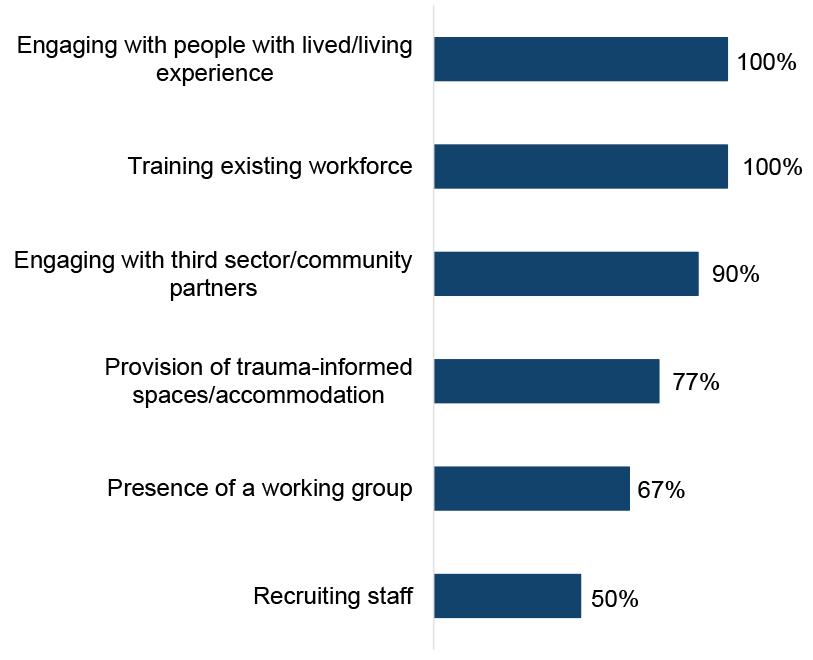
ADPs reported a range of activities which have been undertaken in ADP-funded or supported[22] services to implement a trauma-informed approach (Figure 15) with most activities increasing on the level reported by ADPs in last year’s survey. All ADPs reported that services were engaging with people with lived/living experience (up from 93% in 2023/24) and training the existing workforce (also up slightly from 93% in 2023/24). Nine in ten reported that services were engaging with third sector/community partners (90% of ADP areas, similar to 2023/24).
Recruiting staff was the least commonly reported activity (50% of ADP areas) and there has been a reduction in ADPs reporting this activity each year since 2022/23 (83% in 2022/23, 63% in 2023/24 and 50% in 2024/25). Provision of trauma-informed spaces/accommodation increased most notably to 77% of ADP areas (up from 63% in 2023/24).
Other responses included ongoing work to develop trauma-informed spaces, work to implement a Culture of Kindness, trauma walkthrough activities and use of a wellbeing survey.
Figure 15: All ADPs reported that services were engaging with people with lived/living experience and training the existing workforce to implement a trauma informed approach
Proportion of ADPs in which activities have been undertaken to implement a trauma-informed approach in services funded or supported by ADPs
Independent advocacy
Just over nine in ten ADPs (93%) reported that they have a specific referral pathway for people to access independent advocacy, in line with 2023/24. Nearly seven in ten (67%) were commissioned directly by the ADP, a reduction from eight in ten (79%) in 2023/24.
11. Outcome 6: Children, families and communities affected by substance use are supported
Services for children and young people affected by a parent or carer’s substance use
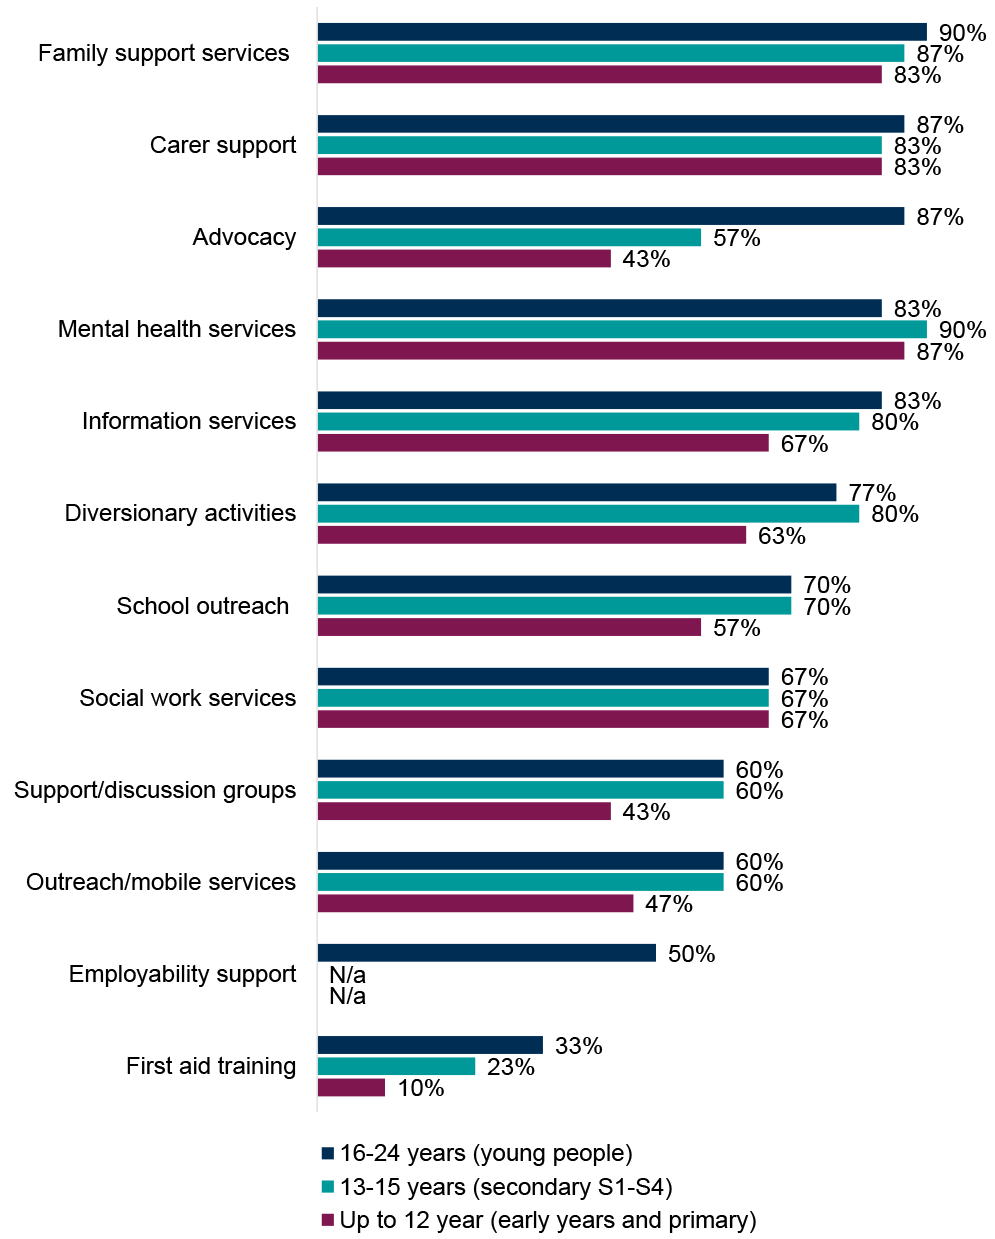
ADPs reported a range of treatment and support services in place for children and young people who are affected by a parent or carer’s substance use (Figure 16). The most commonly provided services across age categories were mental health services, family support services, and carer support. First aid training was the least commonly reported service across all age groups. The widest range of services were on offer to young people (16-24 years), followed by secondary S1-S4 (13-15 years) and then early years and primary (up to 12 years).
- Early years and primary (up to 12 years): the most commonly reported services in place for children in this age group affected by a parent or carer’s substance use were mental health services (87% of ADP areas, a notable increase from 60% in 2023/24), followed by carer support and family support services (both 83% of ADP areas and in line with 2023/24). There were notable changes reported in availability of outreach/mobile services (47% of ADP areas, up from 27% in 2023/24) and support/discussion groups (43% of ADP areas, up from 33% in 2023/24) for this age group.
- Secondary S1-S4 (13-15 years): mental health services were also the most commonly reported service for secondary age children affected by a parent or carer’s substance use (90% of ADP areas, up from 73% in 2023/24), followed by family support services (87% of ADP areas, slight increase on 83% in 2023/24) and carer support (83% of ADP areas, slight decrease from 90% in 2023/24). There was a notable increase in ADP areas reporting provision of outreach/mobile services for this age group (60% of ADP area, up from 47% in 2023/24). Other reported services included the Routes Project.[23]
- Young people (16-24 years): the majority of ADPs reported a wide range of services for young people affected by a parent or carer’s substance use. Family support services (90% of ADP areas, similar to 2023/24), carer support (87% of ADP areas, in line with 2023/24), and advocacy (87% of ADP areas, new option in 2024/25 survey) were most commonly reported. There was an increase in ADPs reporting provision of mental health services for this age group (83% of ADPs, up from 73% in 2023/24). There were decreases in ADPs reporting provision of employability support (50% of ADP areas, down from 73% in 2023/24) and diversionary activities (77% of ADP areas, down from 87% in 2023/24). Other responses included the Routes Project and a service taking a whole-family approach looking at family inclusive practice.
Figure 16: Mental health services, family support services, and carer support were the most commonly provided treatment and support services in place for children and young people affected by a parent or carer’s substance use
Percentage of ADPs with treatment or support services in place for children and young people affected by a parent or carer’s substance use
Services for adults affected by another person’s substance use
ADPs reported a range of support services in place for adults affected by another person’s substance use. Naloxone training was available in all ADP areas (increase of one ADP area compared to 2023/24). Most ADPs reported having advocacy services (93% of ADP areas, up from 83% in 2023/24), support groups (93% of ADP areas, similar to 2023/24), commissioned services (87% of ADP areas, slightly down from 93% in 2023/24), and one to one support (87% of ADP areas, slight increase from 80% in 2023/24) in place. There was a notable increase in ADP areas reporting having mental health services in place for adults affected by another person’s substance use (63% of ADP areas, up from 43% in 2023/24). The least commonly reported services for adults affected by another person’s substance use were training (60% of ADP areas, slight decrease from 67% in 2023/24) and counselling (60% of ADP areas, in line with 2023/24). Other support services reported included family support services provided by Scottish Families Affected by Drugs (SFAD), and recovery communities.
Whole Family Approach & Family Inclusive Practice[24]
More than nine in ten ADPs (93%) have an agreed set of activities and priorities with local partners to implement the Holistic Whole Family Approach Framework in their ADP area. This is a notable increase from 77% in 2023/24.
ADPs reported a range of activities and priorities for implementation of the Holistic Whole Family Approach Framework in 2024/25. These included:
- Partnership Working: many ADPs reported that they have established or are strengthening partnerships with local services, including social work, education, health, and third sector organisations. This includes jointly funded roles in some areas.
- Commissioned services: several ADPs reported commissioning services specifically to deliver whole family support (e.g. SFAD, Aberlour, Children 1st).
- Training and capacity building: Family Inclusive Practice training was widely mentioned, often delivered by SFAD or other partners.
- Targeted support: activities include support for kinship carers, fathers, young people, and families affected by parental substance use.
- Community engagement and needs assessment: some ADPs are conducting needs assessments, community sessions, or lived experience mapping to inform future priorities.
ADPs were asked when they most recently conducted an audit or needs assessment of the support currently available in their area for children, young people and adults affected by a family member’s substance use. Just under one in five ADPs (17%) did so in 2024/25, just over a quarter (27%) in 2023/24 and just under one in five (17%) in 2022/23. Under one in five ADPs (17%) had not conducted an audit or needs assessment of the support currently available in their area for children, young people and adults affected by a family member’s substance use within the past 5 years. Around a quarter (27%) of ADPs reported that they had plans to undertake one in 2025/26.
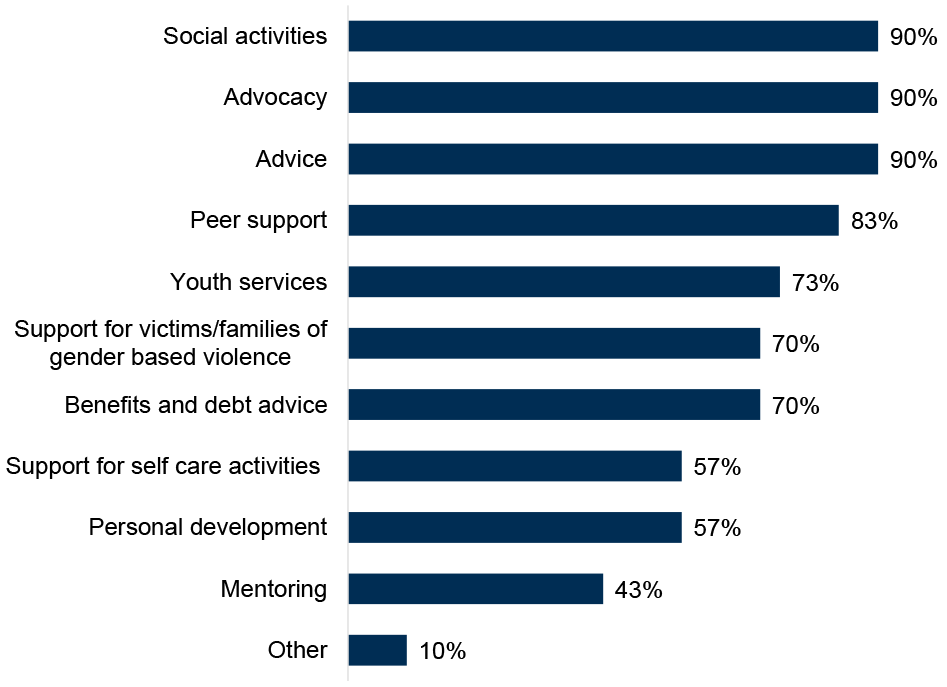
ADPs reported a range of services in place to support a Family Inclusive Practice or Whole Family Approach for people with family members both in and not in treatment (Figure 17).
Advice, advocacy and social activities were most common (all 90% of ADP areas), while mentoring was least common (43% of ADP areas). Other responses included parenting support and programmes such as Parents Under Stress, volunteering, and drop-in facilities.
Figure 17: Advocacy, advice and social activities are the most widely available services supporting a Family Inclusive Practice or a Whole Family Approach
Percentage of ADPs with services in place for supporting Family Inclusive Practice or a Whole Family Approach for people with family members both in and not in treatment
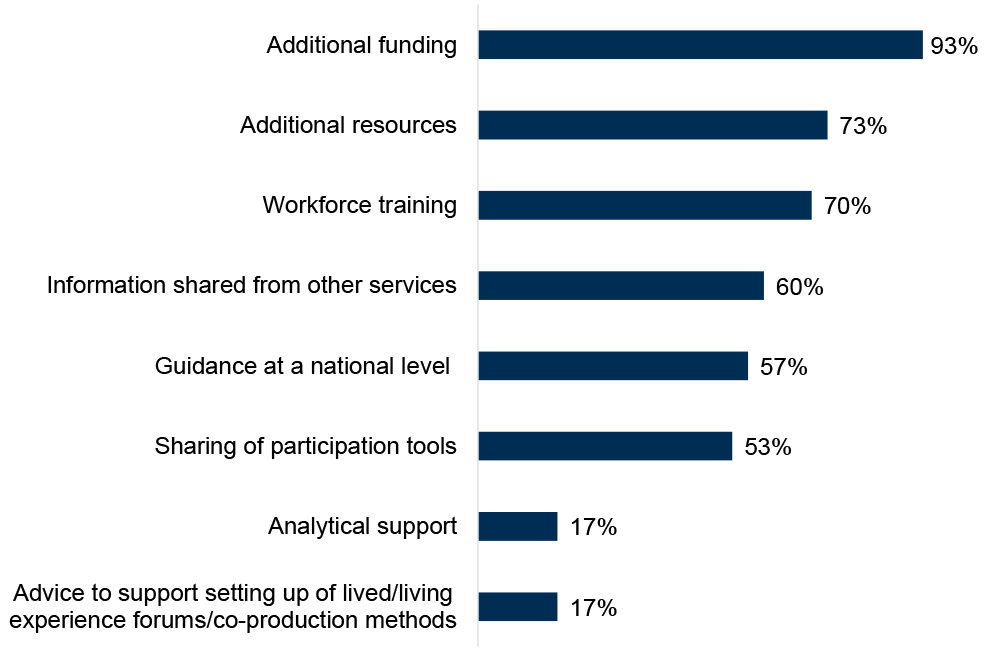
ADPs reported having a variety of support that would be helpful to facilitate the implementation of a Family Inclusive Practice or a Whole Family Approach (Figure 18). Just over nine in ten ADPs (93%) reported that additional funding would be helpful, followed by additional resources (73% of ADPs) and workforce training (70% of ADPs). Least commonly reported support that would be helpful were analytical support and advice to support setting up of lived and living experience forums/co-production methods (both 17% of ADPs). Specific analytical support needs identified included access to family-specific data and data to understand needs across large semi-rural areas.
Other support ADPs identified that would be helpful to facilitate the implementation of a Family Inclusive Practice or a Whole Family Approach included work at a national level to support ADPs and Children’s Partnerships to work better together, support to address the additional challenges faced in rural areas, provision of workforce training and practical tools and guidance from Scottish Families Affected by Alcohol & Drugs (SFAD), and recurring funding based on outcomes and not activities.
Figure 18: ADPs highlighted additional funding, additional resources and workforce training as most helpful to facilitate implementation of a Family Inclusive Practice or a Whole Family Approach
Percentage of ADPs reporting support options as helpful to facilitate the implementation of a Family Inclusive Practice or a Whole Family Approach
ADPs were asked to report on what mechanisms are in place within their area to ensure that services adopt a Family Inclusive Practice. Around half of ADPs (53% of ADPs) reported this was asked about in their reporting or that it was a prerequisite for their commissioning (47% of ADPs). Four in ten ADPs (40%) reported that regular training was provided to services to support adoption of Family Inclusive Practice or a Whole Family Approach. Just over one in ten ADPs (13%) reported that they had no mechanisms in place within their ADP areas to ensure that services adopt a Family Inclusive Practice or a Whole Family Approach, but several ADPs did note that these are under development.
ADPs reported a range of ways they worked with the Children’s Services Planning Partnership (CSPP) in their area. Having CSPP representation on the ADP was most commonly reported (80% of ADPs), followed by knowledge sharing (70% of ADPs) and ADP representation on CSPP (63% of ADPs). Pooled funding, co-location of services (both at 20% of ADPs) and coordinated lived/living experience co-production approaches (23% of ADPs) were least commonly reported. One ADP reported that they do not currently work with the CSSP in their area but that they are currently exploring ways to work more effectively in partnership.
12. Financial management
ADPs were asked several new questions related to financial management. Where possible, the available data and analysis have been included here. However, there were limitations in the quality and completeness of some of this data (including inconsistent interpretation of questions). Some ADPs also noted concerns about the potential commercial sensitivity of some financial/cost data. Therefore, analysis of some of these questions has been excluded from this report.
ADPs were asked how often they provide financial reports for their ADP area. Around three quarters (73%) of ADPs provide these quarterly while just over a quarter (27%) provide them monthly. Just under a quarter of ADPs (23%) provide financial reports for their ADP area annually. Other frequencies included bi-monthly and six-monthly. Note that some ADPs reported providing financial reports for their area at multiple frequencies (as such, percentages add up to more than 100%).
Most ADPs provide financial reporting to the ADP Chair (83% of ADPs), the IJB/IA Chief Financial Officer (80% of ADPs) and the IJB/IA Chief Officer (73% of ADPs). Other stakeholders provided with financial reporting by some ADPs include their Community Care Partnership Board, operational heads of service and service managers, local Health and Social Care Partnership managers, and various other ADP governance and management groups.
Three in ten ADPs (30%) reported they had a dedicated finance officer or team within the ADP, with a further three in ten ADPs (30%) reporting that their finances are managed externally. Just over one in ten ADPs (13%) reported that their ADP coordinator undertakes financial management as part of their role. Some ADPs noted that financial management of the ADP is undertaken or supported by their NHS Board, Health and Social Care Partnership or local authority.
ADPs generally reported using a range of financial systems to manage finances in their area including E-Financials, Boxi and Excel spreadsheets.