Tackling child poverty delivery plan 2022-2026 - annex 2: child poverty evaluation strategy - updated
This annex to Best Start, Bright Futures: the second tackling child poverty delivery plan 2022 to 2026 sets out the updated evaluation approach to tackling child poverty.
Evidence Based Approach To Tackling Child Poverty
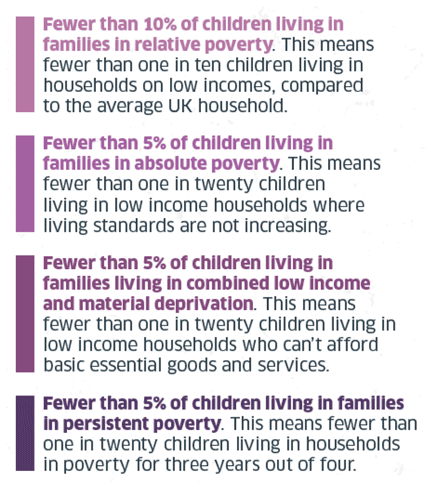
The Child Poverty (Scotland) Act 2017 ('the Act'): requires the Scottish Government and its partners to meet, by 2030, the four ambitious targets set out in the Act:
In order to meet these targets, the Scottish Government is required to produce three delivery plans in the period to 2030, setting out action to deliver progress against the targets. The first delivery plan was published in 2018, this report accompanies the second delivery plan in 2022 and the final one will be published in 2026. Annual progress reports, describing the measures taken and the effect of those measures on progress towards meeting the child poverty targets are also required.[1]
To measure progress towards the targets, a theory of change was established based on two key concepts: the drivers of poverty and the approach to identifying those family types at higher risk poverty.
Drivers of poverty
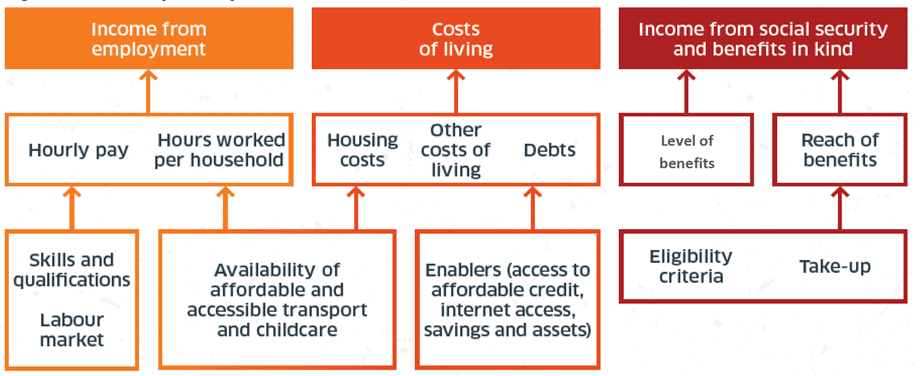
Three drivers which can lead to measureable improvement in income for low income households were identified; increasing income from employment, reducing costs of living, and increasing income from social security and benefits in kind.
Our experience and consideration of the evidence have shown that this driver approach is appropriate and working. As a result we will continue this approach for the second delivery plan. However, one lesson from the first delivery plan is the importance of looking across the drivers to ensure there is balance, for example between the impacts of policies to increase income from employment and the impact of policies to increase income from social security payments. This is necessary to ensure that longer term, unintended or negative outcomes are minimised for children in poverty and their families.
Priority families
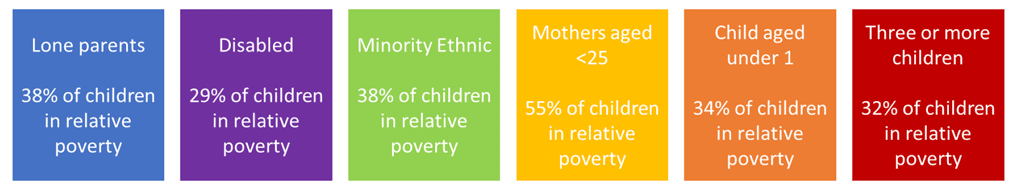
The second concept is the priority families. The priority family concept arose from analysis to see if we could better understand who was most impacted by poverty. This was important to help identify system barriers and blockages and to develop and tailor appropriate policies for different family types. The six identified priority groups, which are at a higher than average risk of poverty, comprise around 90% of all children in poverty.
Experience during the first plan period and further examination of statistics shows that these priority families continue to be at a higher risk of poverty.
However there is also a need for more nuanced consideration of the significant intersectionality within the groups, so it is often helpful to think of them as a lens rather than a discrete group. Families with experience of multiple disadvantage are often among those deepest in poverty and who face particularly challenging journeys to get out. Most of these families will also fall into at least one of our priority family groups. This matters to child poverty because the barriers they face and the support they need will be significant and highly specific.
Contact
Email: TCPU@gov.scot