Hearings in Scottish courts - ethnicity of individuals: analysis
This occasional paper presents new experimental analysis based on the Scottish Courts and Tribunals Service’s management information, on the ethnicity of individuals who were proceeded against and sentenced from April 2016 to February 2023.
Part of
3 Analysis and Discussion
In this section we provide information on prosecution, convictions, sentence outcome and sentence length by ethnic group. The journey through the Scottish justice system differs in a qualitative way for White Scottish/White Other British people in comparison to people of other ethnic groups, because the demographics of Scotland mean that the majority of people working in justice system agencies are White Scottish/White Other British people. Therefore, where it is useful for statistical testing to compare against a reference group, we have used the White Scottish/White Other British group for this purpose.
The statistical methods that are used in this analysis include the Chi-squared goodness fit test, logistic regression and Poisson regression. For more detail on these methods see the technical annex.
3.1 Prosecutions
The courts hearings dataset includes every individual who has been proceeded against on at least one case registered between April 2016 and February 2023. This analysis seeks to identify whether, between different ethnic groups, differences exist in the number of individuals proceeded against. However, the analysis does not identify the underlying factors beneath any observed differences. These may include differences in levels of crime among different groups, and differences in interactions with the justice system. Criminality is related to age and socio-economic status [4], among other factors not considered in this analysis. Furthermore, we do not have access to information on ethnicity among people arrested, and so if there were differences in the number of individuals prosecuted between ethnic groups, we cannot say at what stage these differences arose.
Population information applied in the analysis comes from the 2011 Census [1], and from the 2019 Scottish Survey Core Questions (SSCQ) [1].
The latest definitive information on the population of people from different ethnic groups in Scotland is from over ten years ago, in the 2011 Census. The proportion of the population in various ethnic groups is likely to have changed since 2011, with Walsh et al. [4] suggesting the population of non-white people could double between 2011 and 2031. It is therefore difficult to make accurate up to date comparisons between people who appeared in court between 2016 and 2023 and the general population.
Bearing this in mind, using the 2011 census data, Figure 3 shows some differences between accused individuals and the general population at that time. The proportion of White Scottish/White Other British people among prosecuted individuals is lower than in the general population, whilst for all other ethnic groups, the proportion is higher for the accused population than for the general population in 2011. These differences are statistically significant, but might not be wholly accurate as the Scotland population data is from 2011, and the court data applied is the hearings information from between 2016 and 2023.
In addition, since the ethnicity information in the courts data is generally identified by police officers rather than by the individual, there are potentially identification or recording errors that may be a factor. This is particularly likely to affect smaller ethnicity groups since if there is a misclassification of an individual in a small group as belonging to a larger group (or the other way around), this will make up a larger proportion of the small group than the large group.
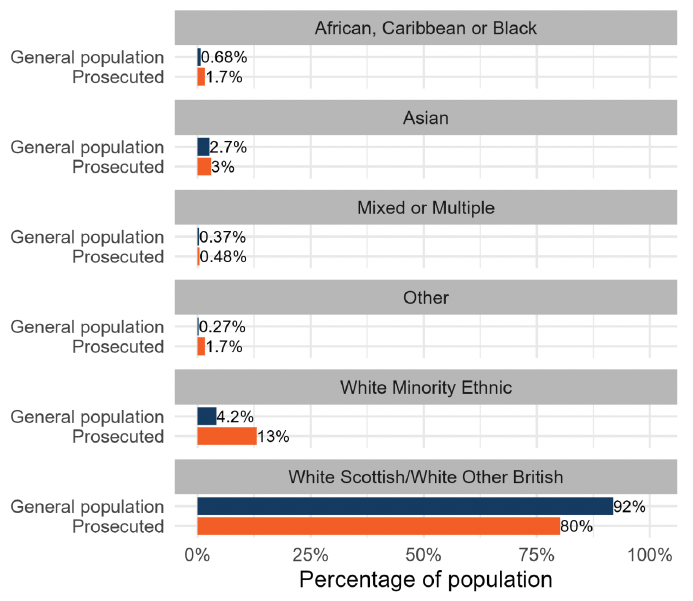
Table 4 shows the extent of change in minority ethnic populations from the 2011 census that would be needed for the differences shown in Figure 3 to not be significant from the White Scottish/White Other British group. The number of people in the general population in the African, Caribbean or Black group, Other ethnic group, and White Minority Ethnic group would need to have grown by 2.7 times (170% increase) and 6.9 times (590% increase) and 3.5 times (250% increase) respectively since the 2011 census, for the observation that they account for a higher proportion of the accused to not be statistically significant.
| Ethnic group |
Adjustment |
|---|---|
| African, Caribbean or Black |
2.7 |
| Asian |
1.2 |
| Mixed or multiple ethnic groups |
1.4 |
| Other ethnic group |
6.9 |
| White Minority Ethnic |
3.5 |
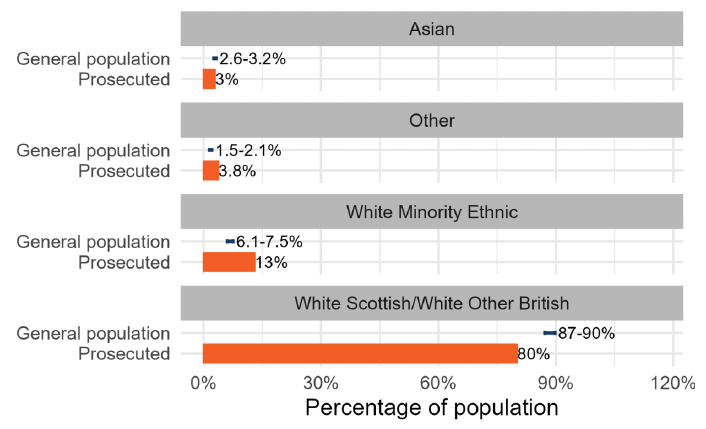
The Scottish Surveys Core Questions (SSCQ) from 2019 provides a more recent estimate of population by ethnic group, but with less precision than the census. Due to the small number of people sampled, only the "White Scottish/White Other British", "White Minority Ethnic" and "Asian" groups were published in full, with the other groups combined into "All other ethnic groups". Based on this sample, since 2011, the proportion of the population in the "Asian" group has grown by 1 to 1.2 times (0-20%), which suggests there is no evidence that Asian people are overrepresented among people prosecuted. The proportion of the population in the "All other ethnicity" group (that is, not in the White Scottish/White Other British, White Minority Ethnic or Asian groups) has grown by 1.1 to 1.6 times (10-60%), which is insufficient to explain the differences in figure 3, while the White Minority Ethnic group has grown by 1.5 to 1.8 times (50-80%), which is also not enough to explain the differences in figure 3.
Figure 4 compares the number of prosecuted individuals with the general population using SSCQ population estimates. This matches the evidence from table 4 that the number of people from the "Asian" group that were involved in court hearings between April 2016 and February 2023 was approximately in proportion to the composition of the general population, but that there were apparent differences in other groups. The White Scottish/White Other British group is under-represented among individuals proceeded against in comparison to the 2019 estimate of the general population, while people in the White Minority Ethnic group and all other ethnic groups combined are over-represented.
Furthermore, while 92% of the general population was White Scottish/White Other British at the time of the 2011 Census, this included 97% of the population aged 55 and above. Among people 54 and younger, less than 90% identified as White Scottish/White Other British. This is important as, in 2020-21, 61% of convictions were for people aged between 21 and 40, and only 13% of convictions were for those aged 51 and over. Therefore, minority ethnic groups make up a larger proportion of the age range that is more likely to be found guilty of crimes.
Overall, the age of the general population data from the census, the small sample sizes in the SSCQ, and concerns about the accuracy of the data about accused individuals, all reduce our ability to draw firm conclusions about differences between the ethnicities of accused individuals and the general population. There does appear to be evidence that White Minority Ethnic individuals make up a higher proportion of those proceeded against than would be expected purely from the proportion in the general population. There are also apparent differences for people within the African, Black or Caribbean, Mixed or multiple ethnicity, and Other groups, though it is not clear which or how many of these groups show a difference. A more precise comparison should be possible once the 2022 Census results are available.
3.2 Convictions
The likelihood of an individual being convicted depends on a number of factors, including the type of case or offence, the evidence available, the potential for the accused to plead guilty and a complex set of processes involving many different justice organisations.
The proportion of cases resulting in a conviction is determined by comparing court data on hearings and disposals from April 2017 to February 2023. For the purposes of this analysis, if an individual is found guilty for at least one charge they are treated as being convicted, and if they are acquitted of all charges they are treated as acquitted. This analysis does not consider differences in the number of charges on which people are convicted.
Problems with the data, including the need to link the two datasets, mean it is difficult to be precise regarding the number of convictions and acquittals. For this analysis, three different approaches to processing the data were applied and the results below present the range of outcomes for the three approaches, from the lowest to the highest.
This part of the analysis seeks to identify any difference in how likely an individual is to be convicted depending on ethnicity, but it does not identify the underlying factors beneath any differences.
Figure 5 shows the range of possible conviction proportions by ethnicity between April 2017 and February 2023.
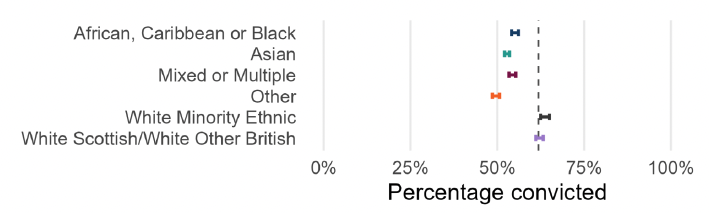
As figure 6 shows, the comparative odds of conviction for each minority ethnic group were significantly lower than for the White Scottish/White Other British group, except for the White Minority Ethnic group. This is a statistically significant result (with 95% confidence), as the confidence intervals do not straddle the line where conviction would be equally likely as for the White Scottish/White Other British group. Therefore, out of cases completed in court, the analysis suggests that White Scottish/White Other British and White ethnic minority people were more likely to be convicted than any other ethnic group.
3.3 Sentencing outcomes
For those convicted of a crime, the type of sentence that they are given is dependent on a number of factors including the:
- Convicted individual's behaviour between being charged and the case being completed (e.g., attending court, meeting bail conditions),
- Type and severity of crime,
- Convicted individual's criminal record,
- Availability of certain sentences (e.g., Community Payback Orders may require capacity in a specific programme),
- Whether the convicted individual plead guilty, and if so, at what stage of the trial,
- Various processes conducted by organisations involved in progressing cases through the courts.
This analysis includes the following four types of sentences:
- custody (imprisonment, including life sentences and orders for lifelong restriction),
- community sentences (including community payback orders),
- monetary sentences like fines, and
- other sentences.
This part of the analysis seeks to identify any difference in sentencing outcomes depending on ethnicity and on crime type, but it does not identify any other underlying factors beneath any differences.
All sentences are included for each charge on which an individual was convicted. Therefore, there can be multiple sentences of the same type given to an individual on a single case, and multiple different sentence types given to an individual on a single case. It should be noted that due to the analysis being based on sentences issued at charge level in Scottish criminal courts the number of sentences can look higher than they would for sentences data at person level.
Figure 7 shows the percentage breakdown of sentencing outcomes by ethnic group, for individuals that were convicted of charges.
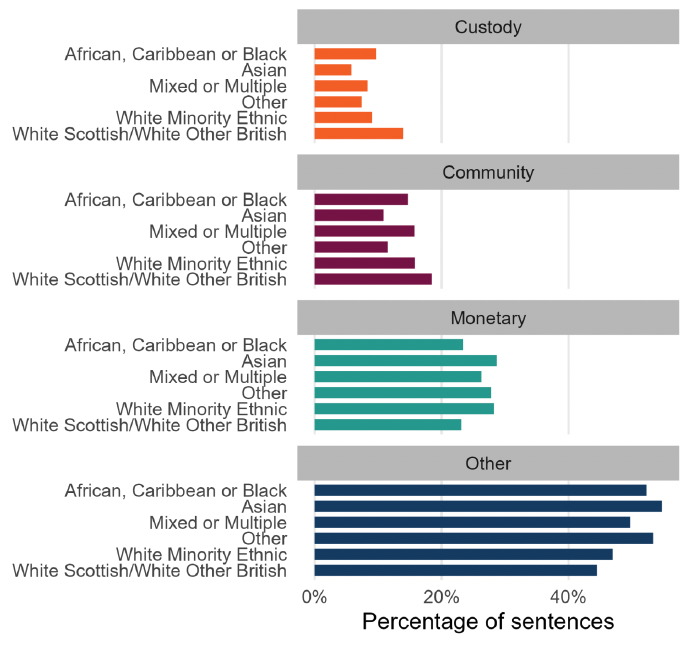
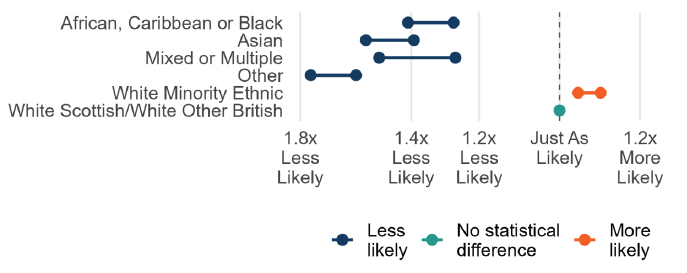
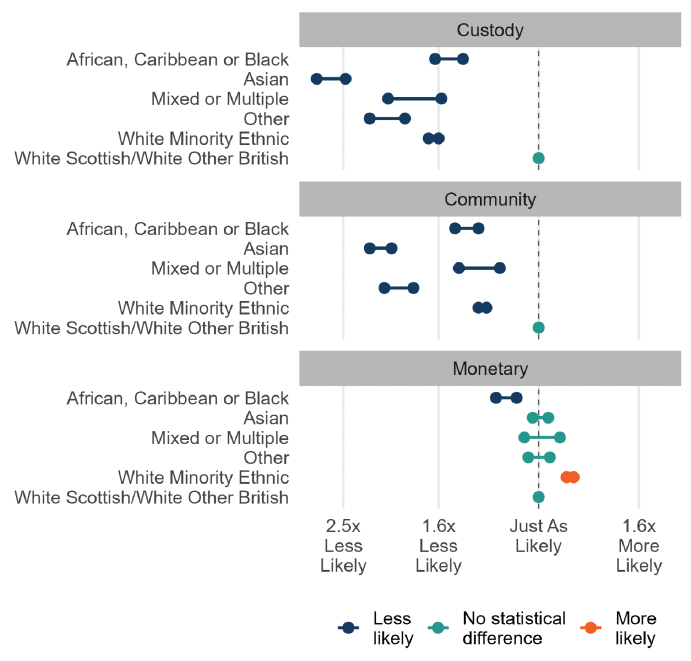
Figure 8 shows that, all minority ethnic groups were comparatively less likely than the White Scottish/White Other British group to receive a custodial (prison) sentence. Of those that didn't receive a prison sentence, people in the minority ethnic groups were less likely than White Scottish/White Other British people to receive a Community sentence. For those that did not receive a custodial or community sentence, African, Caribbean or Black people, were less likely to receive a Monetary sentence and White Minority Ethnic people were more likely to receive a Monetary sentence (with other groups showing no statistical difference from the White Scottish/White Other British group).
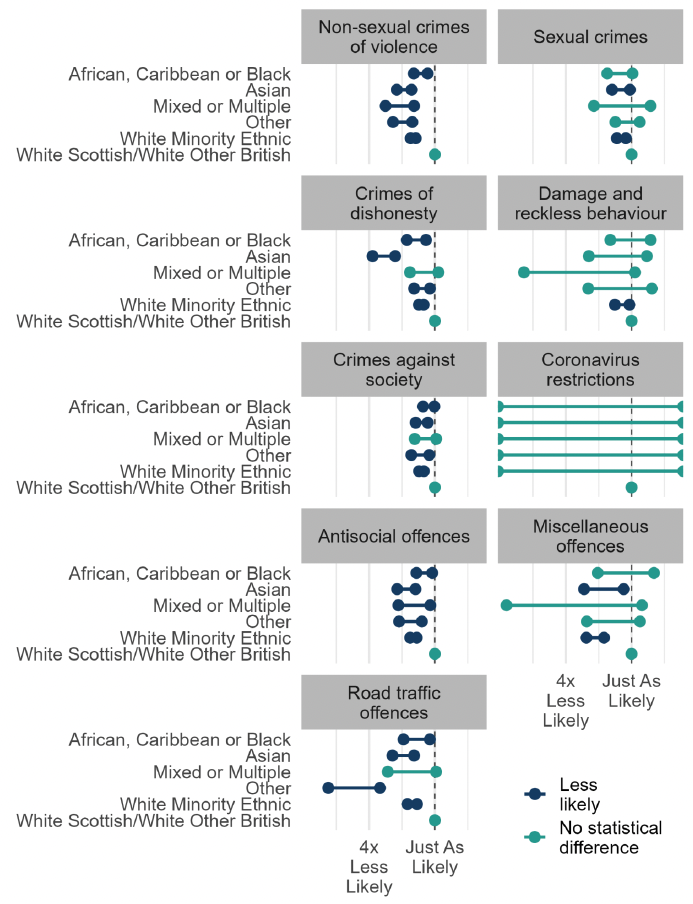
It is useful to look at a breakdown of imprisonment likelihood by crime type, as shown in Figure 9. For some crime types, there is insufficient data for many of the results to be statistically significant. Where there is no statistical difference and the error bars are narrow, it suggests that there is little difference in sentence outcomes for that ethnic group in comparison with White Scottish/White Other British people, for that crime. But when the error bars are wide, it means that there is insufficient data, and it is not possible to draw meaningful conclusions.
For combinations where there is a statistical difference, these differences all show lower likelihoods of prison sentences for minority ethnic groups in comparison to the White Scottish/White Other British group. It is possible that some or all of this difference may be explained by different severities of crime within the crime group that we cannot account for.
3.4 Custodial sentence length
For those sentenced to prison, the length of sentence they are given depends on a number of factors including:
- Type and severity of crime,
- Convicted individual's behaviour during the trial (e.g., attending court, meeting bail conditions),
- Convicted individual's criminal record,
- Whether the convicted individual pleads guilty, and if so, at what stage of the trial,
- The various processes conducted by organisations involved in progressing cases through the courts.
Custodial sentence length is determined from court data on disposals from April 2017 to February 2023. This part of the analysis seeks to identify any differences in the duration of the mean sentence length by ethnicity, but it does not identify the underlying factors behind any differences. In this analysis, prison sentences for Coronavirus restrictions have been removed due to their small numbers.
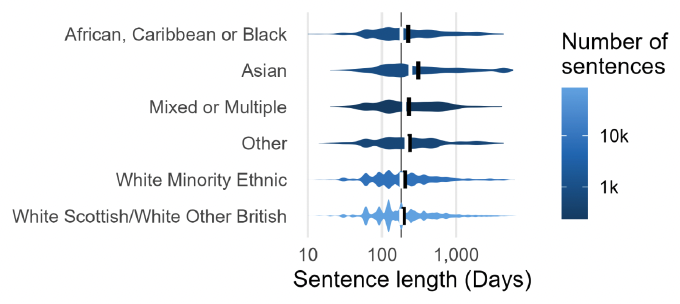
Figure 10 shows the distributions of sentence length for each ethnic group. For each ethnic group, the vertical thickness of the area indicates the proportion of sentences that are approximately that long. For example, all the areas are thicker at 100 days than at 1,000 days, indicating that there are a higher proportion of sentences of around 100 days than 1,000 days, for all ethnic groups.
The steep peaks and troughs for the White Scottish/White Other British group are due to sentence lengths being set by weeks, months and years. So, for example, a sentence of 52 weeks (one year) is much more likely than a sentence of 50 weeks or 54 weeks. This shows up better for the White Scottish/White Other British and White Minority Ethnic groups due to higher numbers of sentences. The other charts are smoothed out due to insufficient numbers of sentences to pick up on this pattern. The overall number of sentences is indicated by colour.
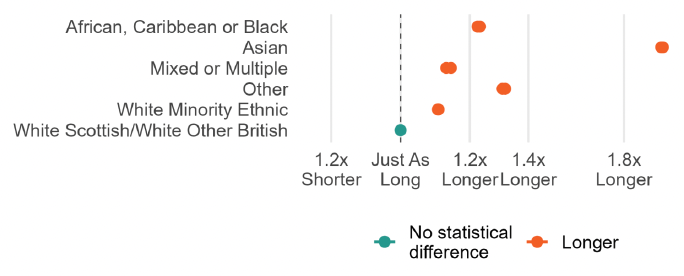
The mean length of sentence for all minority groups are longer than for the White Scottish/White Other British group, with statistical significance in all cases, as shown in Figure 11. In particular, those in the Asian grouping received on average around two times as long sentences as White Scottish/White Other British individuals. As before, some differences are explained by differences in crime types, as more severe crimes tend to receive longer sentences.
As figure 12 shows, the differences in sentence lengths between ethnic groups are reduced when looking at each crime type. Some large differences remain, and for most combinations of crime type and ethnic group, the sentence lengths are on average longer than for the White Scottish/White Other British reference group.
For crimes against society, all minority ethnic groups received, on average, longer sentence lengths than the White Scottish/White Other British group. This was relatively small, though still statistically significant, for the White Minority Ethnic group. For all other ethnic groups, prison sentences for this crime group were, on average, comparatively 1.5 to 2 times longer.
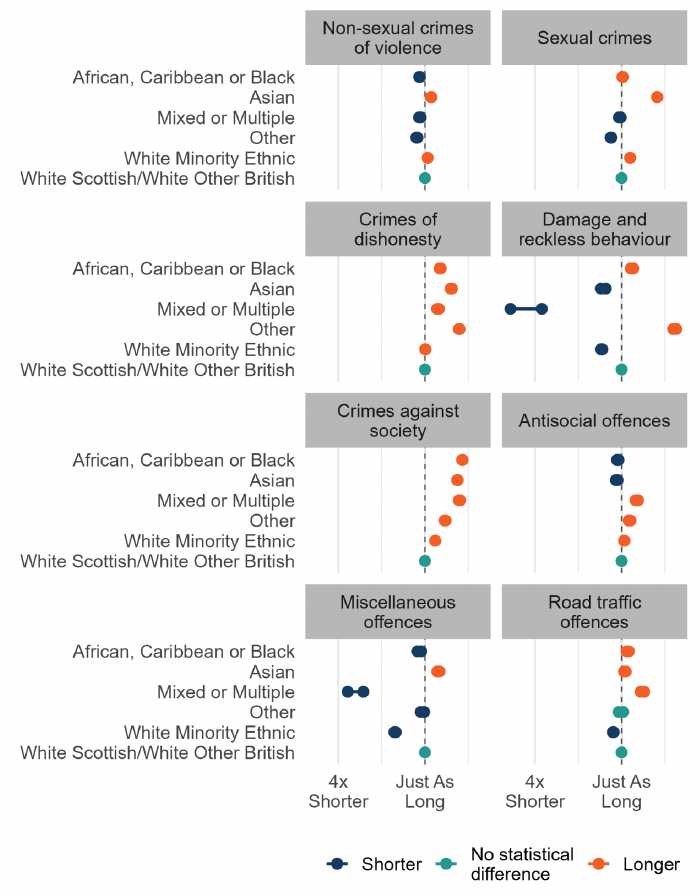
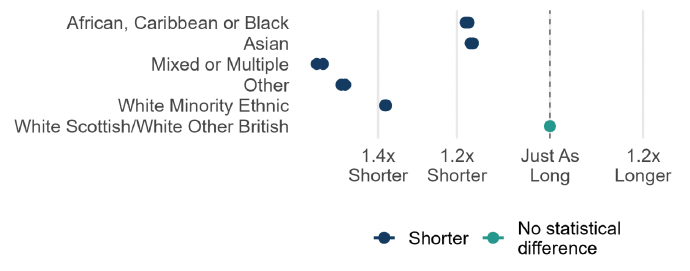
Figure 8 in section 3.3 showed that people from minority ethnic groups were overall less likely to receive a custodial sentence, if convicted, than White Scottish/White Other British people. This could have an influence on the differences seen in figures 11 and 12, because replacing a non-custodial sentence for an individual with a custodial sentence of below average length will reduce the average sentence length.
We can examine this effect by including all convictions, and treating a non-custodial sentence as a length of 0 days. Figure 13 shows that in this case, sentence lengths are significantly shorter for all minority ethnic groups than the White group. Therefore, overall, convicted White Scottish/White Other British people are likely to be sentenced to more time in prison than people in minority ethnic groups.
Contact
Email: Justice_Analysts@gov.scot