Scottish Income Tax: distributional analysis 2023-24
A note on the distributional impact of the Scottish Government’s Income Tax policy for 2023 to 2024.
Income Tax: Impacts on Income Levels and Equality: Office of the Chief Economic Adviser
- This note sets out the distributional impact of the Scottish Government’s Income Tax policy choices announced in the 2023-24 Budget.
- The analysis considers the impact of the Income Tax policy changes both on individual taxpayers and households across the income distribution. Income Tax is levied on an individual basis in the UK, so the household analysis also takes into account the number of people in the household, its composition, and interactions with the wider (UK and Scottish) tax and benefit system.
- The analysis also considers impacts by age and gender, where data allows.
Impact on taxpayers
- 39% of Scottish adults (1.8 million individuals) do not pay Income Tax and so are not affected by the policy changes (as their income is below the UK-wide Personal Allowance).
- The take home pay of taxpayers in the top decile of income is expected to fall most, by £1,527 (1.6% of their gross income). The policy changes are therefore highly progressive.
- The take home pay of taxpayers earning less than the median wage (£26,900) is expected to fall by a modest amount - by up to £3 per year, on average.
- The policy has no effect on the lowest earning taxpayers (those earning up to £14,732).
Impact on households
- The household level results broadly mirror the findings at taxpayer level.
- The top decile is expected to see the largest decrease in their net income, both in cash terms (£1,546) and as a proportion of their net income (1.7%). This confirms that the policy changes are highly progressive.
- Although all household deciles will see a reduction in their net income, on average, the impact is modest for the lowest 10% at £5 per year (0.05% of their income). This is because there are fewer taxpayers in the lower-income deciles.
- The policy will result in a small reduction in inequality (the Gini coefficient will fall 0.31 percentage points).
Impact by Age and Gender
- The majority of Scottish taxpayers (71%) are aged between 25 and 64 years as (i) many young adults are still in full-time education or training and are therefore unlikely to earn enough to pay Income Tax and (ii) those who are of pension age (65+) may have incomes that fall below the UK-wide Personal Allowance of £12,570.
- For many taxpayers, average earnings tend to peak in middle age. Taxpayers aged between 45-54 will therefore be impacted disproportionately, contributing 27% of the extra revenue raised from this year’s tax policy.
- Since men tend to have higher incomes than women and are more prominent amongst top earners, they will be impacted disproportionately by the policy, contributing 74% of the extra revenue raised.
Conclusion
- This analysis shows that the policy decisions taken at this Budget are highly progressive, with the highest earning taxpayers and households seeing the largest change in the amount of tax paid. These tax revenues are used to invest in and maintain our vital public services.
Introduction
The analysis considers the impact of the Income Tax policy changes announced in the 2023-24 Budget on both individual taxpayers and households across the income distribution. It is important to consider both these perspectives, as although Income Tax is levied on an individual basis in the UK, household composition matters to fully assess the equality implications of the policy. For example, this is because a high income taxpayer might be the main family earner, supporting a partner and/or children. For example, there are around 16,000 households (0.5%) with a sole earner and dependent children.
- The analysis covers the following policy choices announced at this budget[1]:
- Reducing the Top Rate threshold from £150,000 to £125,140
- Maintaining the Higher Rate threshold at £43,662
- Maintaining the Basic Rate band at £13,118
- Maintaining the Starter Rate band at £2,162
- Increasing the Higher Rate of tax to 42 pence
- Increasing the Top Rate of tax to 47 pence
The analysis considers the impacts of these policy choices on taxpayers and households in 2023-24, compared to a situation where all thresholds, except the Top Rate threshold, had increased in line with inflation in 2023-24. Overall, and on this basis, we estimate that the policy could provide £519 million for investment in public services. This approach is different from the policy costing, and the baseline, used by the Scottish Fiscal Commission (SFC) whose official forecasts underpin the Scottish Budget.
Key facts about Scottish taxpayers in 2023-24
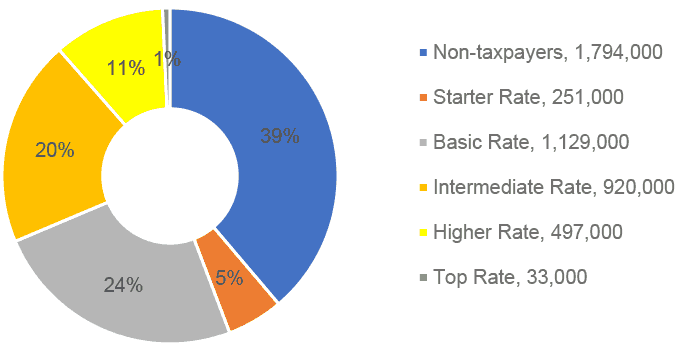
We estimate that there will be around 4.6 million adults living in Scotland in 2023-24 of which 2.8 million (61%) pay Scottish Income Tax. This means that a significant proportion, around 39%, or 1.8 million adults, will not pay Income Tax because their income is less than the UK-wide Personal Allowance of £12,570. This may be because either they are in work but earn below this level, or they do not work, they are in full-time education, have full-time caring responsibilities or are retired and their income is below that threshold for example.
As illustrated in Chart 1, around 50% of Scottish adults will pay either the Starter Rate (19p), Basic Rate (20p), or the Intermediate Rate (21p) of Income Tax in 2023-24. While Starter Rate taxpayers earning up to £14,732 will not be impacted by this year’s policy changes, those in the Basic and Intermediate Rate bands will only see a modest impact on tax paid of up to £15 per annum.
Only 11% of Scottish adults will pay the Higher Rate (42p), and 0.7% of the Scottish adults pay the Top Rate (47p). Despite this, these individuals are estimated to account for 65% of the total Income Tax take in 2023-24 which highlights the reliance of receipts from top earners.
Source: Scottish Government Analysis based on SFC forecasts
Table 1 shows the estimated income distribution of Scottish taxpayers for 2023-24, split into quarters. For example, someone earning between the UK-wide Personal Allowance (£12,570) and £18,700 would be among the lowest earning 25% of taxpayers in Scotland.
| Taxpayer Income | Annual income of less than |
|---|---|
| 75% | £40,300 |
| 50% (Median Income) | £26,900 |
| 25% | £18,700 |
Box 1: Threshold freezes and ‘fiscal drag’
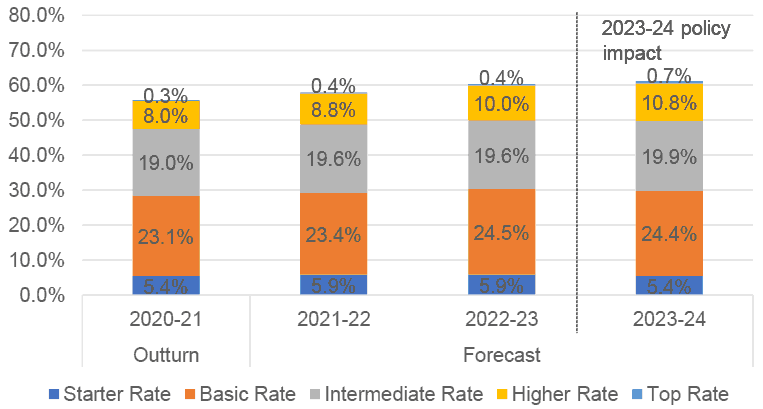
The Scottish Fiscal Commission (SFC) forecasts average nominal earnings to grow by 4.1% in 2023-24. Freezes and reductions to Income Tax thresholds announced in this year’s Budget therefore mean that more people are being pulled into higher tax bands while the tax burden on existing taxpayers is increased. Likewise, the UK Government's decision to freeze the UK-wide Personal Allowance will mean some individuals will pay Income Tax for the first time. This effect is also known as ‘fiscal drag’.
This is illustrated in Chart 2 below which shows how the proportion of Scottish adults in each tax band is expected to change over time. While 8% of adults paid the Higher Rate in 2020-21, this figure is expected to increase to 11% by 2023-24. For example, the reduction in the Top Rate threshold means that an extra 12,000 taxpayers will pay the Top Rate of Income Tax for the first time.
Distributional analysis
People’s living standards are affected both by the performance of the Scottish economy and by the direct impact of government decisions, including on tax and public spending. Our analysis, which is consistent with the SFC’s published forecasts for the Scottish economy and Income Tax, shows the effect of this year’s Income Tax policy decisions on taxpayers in 2023-24, compared to a counterfactual scenario where all thresholds – bar the Top Rate threshold – increased in line with inflation (see Annex for full details).[2]
This analysis is done on a static basis and does not include behavioural effects. It also presents only some of the factors which will drive taxpayers’ income and living standards and, importantly, does not take into account the impact of other government policies or spending decisions on the wider Scottish economy, such as changes to the National Living Wage.
Impact across different levels of taxpayer income
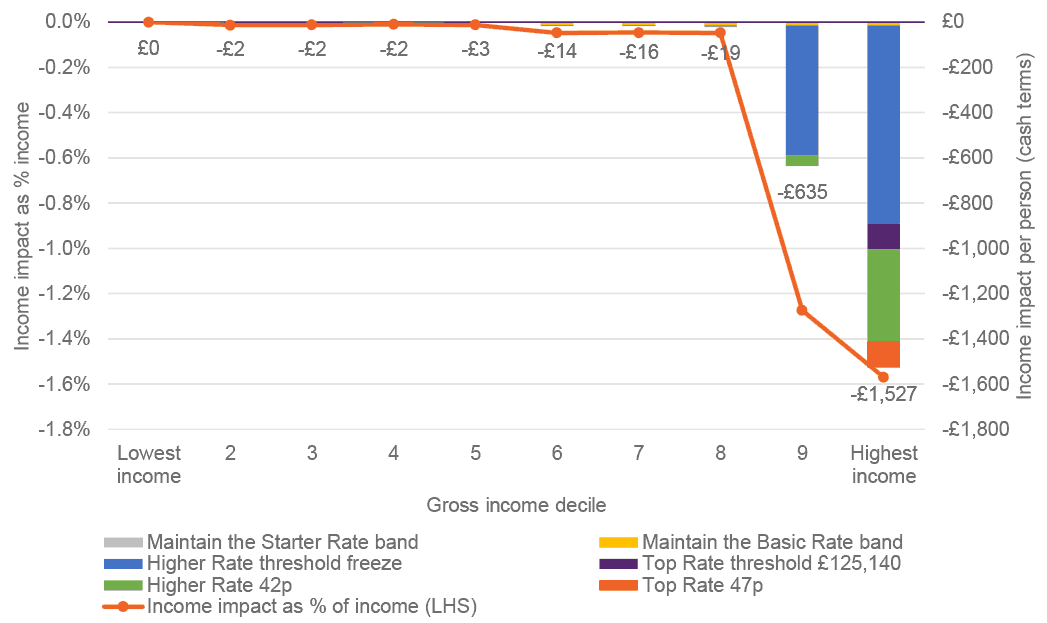
Chart 3 presents the impacts of this year’s policy on Scottish taxpayers by income decile. This approach divides the taxpayer population into ten equal groups, with decile 1 representing the 10% of taxpayers with the lowest income and decile 10 the 10% of taxpayers with the highest income.
It shows that this year’s policy decisions have been highly progressive as those with the greatest ability to pay (income decile 9 and 10) are expected to see the largest decrease in their take home pay, both in cash terms and relative to their gross income. This is because the tax changes – in particular the 1p increase in the Higher and Top Rate and the reduction in the Top Rate threshold for the very higher earners (over £125,140) - are targeted at the upper end of the income distribution.
Source: Scottish Government Analysis based on SFC forecasts
Despite this, most taxpayers will see a change in their take home pay. However, the change is modest for those earning less than the median wage (£26,900) as they pay only up to £3 per year more in tax on average (or 6 pence per week), equivalent to 0.01% of their gross income. The lowest earning 9% of taxpayers (earning up to £14,732) will not be affected by the policy.
The highest earning 10% of Scottish taxpayers will see the largest decrease in their take home pay, both in cash terms (£1,527) and relative to their gross income (1.6%).
Chart 3 also breaks down the impact of the different components of the policy package. On average, taxpayers in the top decile (earning above £57,100) will see the largest impact on their take home pay from the Higher Rate threshold freeze.
However, it is important to remember that the analysis shows average effects on taxpayers within each income decile, but there will be variation around this average. Generally speaking, rate changes are more progressive than threshold changes as the impact increases in line with income. For example, taxpayers earning £1 million – who will also fall into the top decile - would see their take home pay fall by £11,830, predominantly driven by the 1p increase in the Top Rate.
Impact across different levels of household income
This section extends the taxpayer analysis by looking at the impact of the policy changes across the household distribution and different types of households. As the household model does not include behavioural responses to tax policy, all the analysis below is on a static basis.
As noted above, Income Tax is levied on an individual basis in the UK so this type of analysis also takes into account the number of people in the household, its composition, and interactions with the wider (UK and Scottish) tax and benefit system which partly operates on a benefit unit basis. For example, this approach also accounts for the fact that some high income earners may be the main family earner, supporting a partner and/or children. Our analysis finds there are around 16,000 households with a sole earner and dependent children. There are also around 98,000 households entitled to Universal Credit and paying Income Tax some of which will not be impacted by the tax measures. Finally, it also includes individuals who do not currently pay tax and hence are not directly affected by this year’s Income Tax measures.
Therefore, the income deciles in this approach are different from those above, as they cover the impacts on the whole adult population, grouped by households, rather than just taxpayers. Moreover, the income measure used in the analysis is equivalised net household income after housing costs to account for the differences in a household's size and composition.
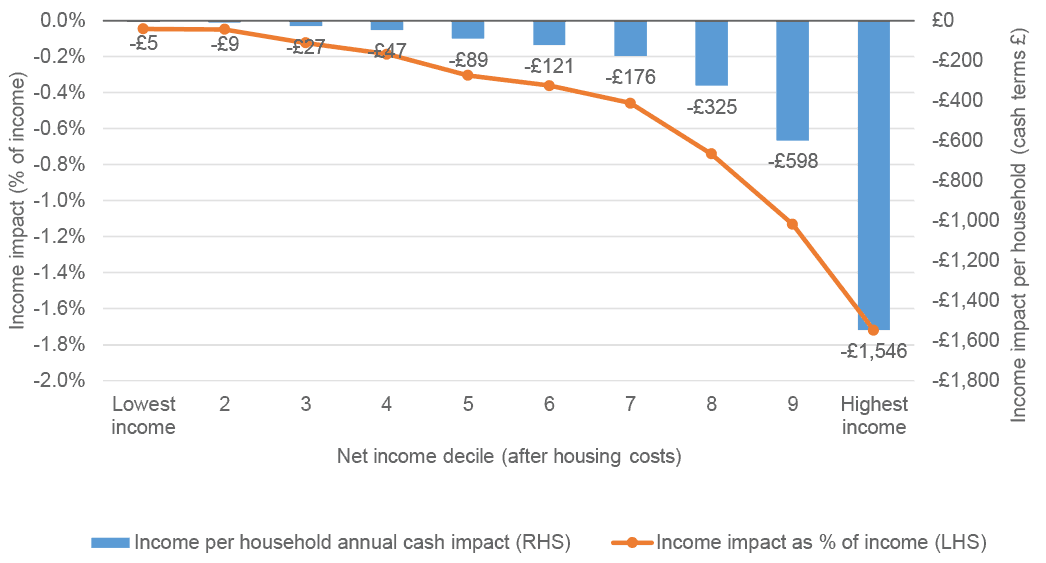
The results, as shown in Chart 4, broadly mirror the findings for the taxpayer population: the tax policy changes implemented by the Scottish Government are highly progressive across the household distribution.
Although all household deciles will see a reduction in their net income, on average, the impact is modest for the lowest 10% at £5 per year (0.05% of their income). This is because there are fewer taxpayers in the lower-income deciles and taxpayers earning up to £14,732 will see no change in their tax liability. Compared to the taxpayer analysis which shows that the decrease in take home pay is largely concentrated in the two top deciles, the distribution of losses is more dispersed when measured at the household level. Some lower income households may experience a small rise in benefit payments due to the increase in tax affecting their Universal Credit entitlement.
Nevertheless, these results confirm that the policy was progressive as the highest earning 10% of households will see the largest decrease in net income, amounting to £1,546 (1.7% of their net income).
Source: Scottish Government Analysis using UKMOD
Another way to assess the progressivity of a tax system as a whole and its impact on inequality is to estimate the change in the Gini coefficient,[3] an internationally recognised measure of how equally income is distributed across the population. A reduction in the Gini coefficient would reduce income inequality and would therefore mean that the tax policy is more progressive.
As illustrated in Table 2, the analysis shows that this year’s Income Tax policy will result in a small reduction in inequality, as measured by the Gini coefficient (a fall of 0.31 percentage points). Given the small size of these estimates, they will be highly sensitive to measurement error as well as methodological choices and thus should be treated as solely indicative. Note also that the measures given here are modelled estimates which do not necessarily align with official statistics, for example because benefit income is simulated rather than taken directly from the Family Resources Survey (FRS).
| 2023-24 Policy | Counterfactual Scenario 2023-24 | Difference (percentage point) | |
|---|---|---|---|
| Gini coefficient | 31.73% | 31.42% | -0.31 |
Impact by equality group
This section considers the impact of this year’s policy changes on some equality groups where data is available, including disability, gender and age and to some extent marriage/civil partnership and maternity.[4]
That said, Income Tax changes apply regardless of protected characteristics such as sex, race or disability. Any equalities impacts will therefore reflect the composition of the Income Tax paying population, and distribution of those living with protected characteristics within it.
Impact across different types of households
As noted above, household composition also matters in assessing the impact of the Scottish Government's Income Tax policy choices on the Scottish population and the analysis therefore also considers the impact by household type.
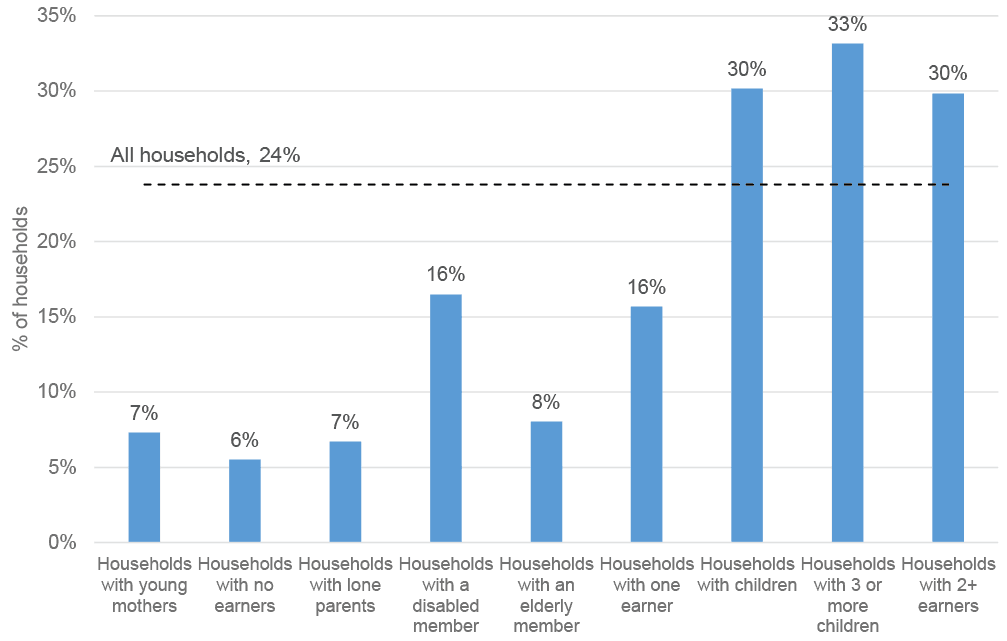
Our analysis shows that, on average, 24% of people in all households are estimated to experience a reduction of their household net income of over 1%. However, the impact varies significantly across different types of households.
As shown in Chart 5, a higher than average proportion of people in households with children (30%) and people in households with two or more earners (30%) will experience a reduction of over 1% of household income. By comparison, a lower than average proportion of people in households with a disabled member (16%) and people in households with one earner (16%) will experience a reduction of 1% or more. Finally, only a relatively small proportion of people, e.g. only 7% of people in households with young mothers, 7% of people in households with lone parents and 6% of people in households with no earners, will experience a reduction of 1% or more.
Source: Scottish Government Analysis using UKMOD
Impact by Gender
While women are expected to account for around 52% of all Scottish adults, they are expected to make up only 45% of Scottish Income taxpayers in 2023-24. There are a number of factors explaining this. First, while the proportion of women in work has increased over the past decades, there are still relatively more men than women who are in full-time work. Second, women tend to have lower earnings, on average, than their male counterparts. There are many drivers to the gender pay gap including:
- women still being regarded as the primary caregiver in a household. This can disproportionately impact women through a range of discriminatory practices, such as pregnancy and maternity discrimination which assumes that motherhood detracts from a worker’s productivity or value.
- a lack of access to affordable, high quality childcare and as unpaid carers for other adults, such as an older or disabled family member. This can mean women are prevented from accessing better paid, secure jobs, from progressing to senior roles, or to taking more time out of the labour market to look after family and children.
- women continue to be paid less, on average, than their male counterparts for similar jobs. The gender pay gap for full-time employees in Scotland increased from 3.0% in 2021 to 3.7% in 2022, although this is still below the gap of 7.2% in 2019 (pre-pandemic). It is also below the UK gap of 8.3%.
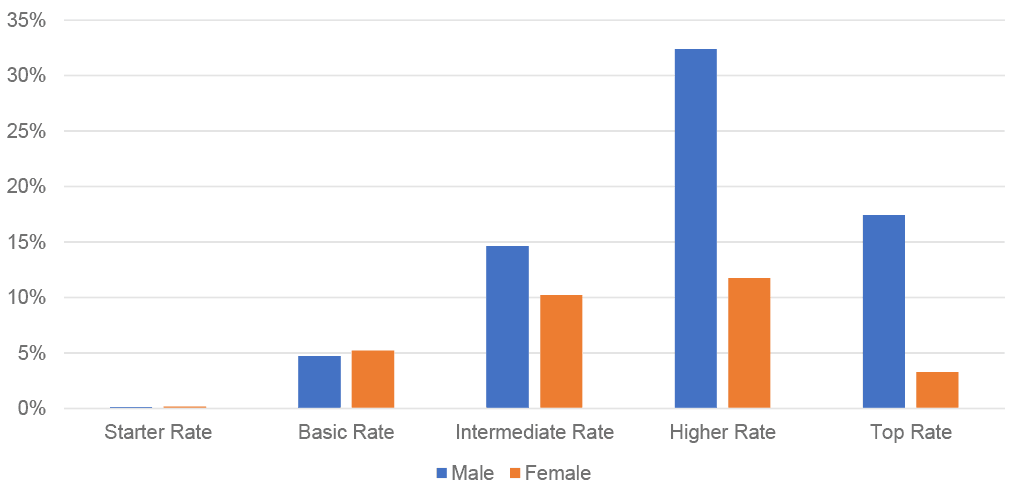
These trends are also evident in the Income Tax data. Median income of male taxpayers is forecast at £30,500 in 2023-24, compared to £23,600 for women. There are also relatively more men who pay the Higher and Top Rate. As a result, male taxpayers are expected to contribute around 69% to total Income Tax liabilities in Scotland in 2023-24, and 74% of the revenue raised by this budget’s policy changes come from males. In general, half of Income Tax receipts is paid by male Higher and Top Rate taxpayers, compared to 15% by women paying the Higher and Top Rates, as shown in Chart 6.[5]
However, this does not necessarily mean that the policy has less of an effect on women, especially when considering household composition and accounting for the fact that many families will rely on the higher income from male earners to support households’ finances.
Source: Scottish Government Analysis based on SFC forecasts
Impact by age
The majority of Scottish taxpayers (71%) are aged between 25 and 64 years, this is explained by a number of factors. For example, many young adults are still in full-time education or training and are therefore unlikely to earn enough to pay Income Tax. Likewise, those who are of pension age (65+) may have incomes that fall below the UK-wide Personal Allowance of £12,570.
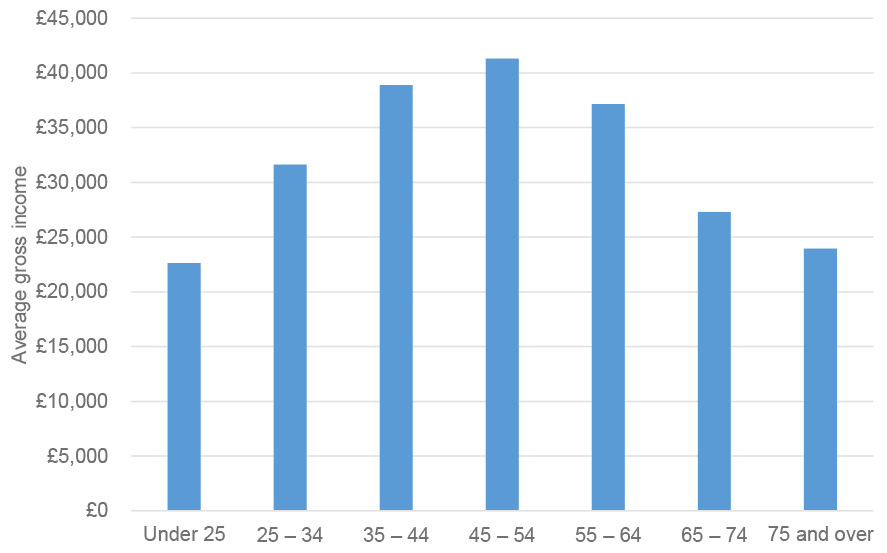
For many taxpayers, average earnings tend to peak in middle age. Taxpayers aged between 45-54 years are expected to have the highest average income in 2023-24, at around £41,300 a year, as shown in Chart 7. As a result, taxpayers in this age bracket are expected to make the largest contribution to total Income Tax liabilities in 2023-24, at around a quarter, or 24%.
- Nearly three quarters (74%) of the revenue raised from the 2023-24 policy measures will be raised from those aged 35-64 who make up 54% of taxpayers while around 27% of the extra yield will come from those aged 45-54 years. While some taxpayers under the age of 25 and over the age of 65 will also see their tax liabilities increase, their contribution per head is lower than for those middle-aged taxpayer cohorts.
Source: Scottish Government Analysis based on SFC forecasts
Contact
Email: ellis.reilly@gov.scot