The Scottish Health Survey 2022 – volume 1: main report
This report presents results for the Scottish Health Survey 2022, providing information on the health and factors relating to health of people living in Scotland.
This document is part of a collection
5 Chronic Pain
In 2022, more than one-third of adults were currently being troubled by pain or discomfort that lasted three months or more, referred to as chronic pain.
- All adults: 38%
A higher proportion of women reported being in chronic pain compared with men.
- Women: 43%
- Men: 33%
The proportion of adults experiencing chronic pain increased with age.
- 16-24: 18%
- 25-34: 23%
- 35-44: 31%
- 45-54: 41%
- 55-64: 49%
- 65-74: 51%
- 75+: 55%
In 2022:
- 6% of all children had experienced chronic pain for three months or more.
- 8% of 8–15 year olds compared with
- 3% of 0-7 year olds.
The proportion of all adults experiencing chronic pain was higher in the most deprived areas than in the least deprived.
- SIMD5 least deprived: 29%
- SIMD4: 35%
- SIMD3: 36%
- SIMD2: 42%
- SIMD1 most deprived: 50%
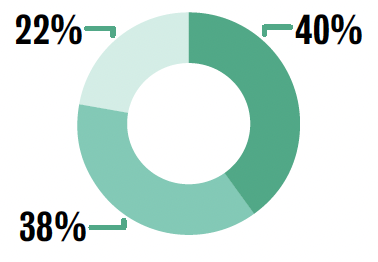
The most common types of chronic pain experienced by all adults in 2022 were:
- Pain in arms, hands, hips, legs or feet: 25%
- Back pain: 18%
- Neck or shoulder pain: 9%
The most common types of pain experienced by all children aged 0-15 were:
- Arms, hand, hips, leg, or feet: 3%
- Stomach ache or abdominal pain: 1%
- Headaches, facial or dental pain: 1%
In 2022, of those adults experiencing chronic pain:
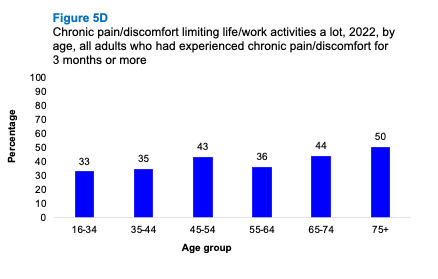
- Four in ten reported that it limited their life/work a lot.
- Almost two-fifths reported that it limited their life/work a little.
- The remaining adults did not experience any impact on their life/work.
Among all adults who reported chronic pain in 2022:
- The majority reported receiving support from their GP: 69%
- While almost a third reported receiving support from a physiotherapist: 31%
In 2022, most children suffering from chronic pain received support from a GP (66%) while 28% received support from a physiotherapist.
- Received support from a GP: 66%
- Received support from a physiotherapist: 28%
Adults who experienced pain/discomfort for 3 months or more in 2022 had a lower average WEMWBS mean score than those who experienced pain/discomfort for less than 3 months and those who were not experiencing any pain.
- Experiencing pain/discomfort for 3+ months: 44.1
- Experiencing pain/discomfort for less than 3 months: 48.0
- Did not report any pain/discomfort: 49.0
WEMWBS scores range from 14 to 70. Higher scores indicate greater wellbeing.
Sophie Birtwistle
5.1 Introduction
Chronic pain has been broadly defined as persistent pain that continues for longer than 12 weeks despite medication or treatment and can affect all ages and different parts of the body[100]. The International Classification of Diseases (ICD-11), which came into effect in January 2022[101], was updated by the World Health Organisation (WHO) to include two categories of chronic pain: chronic primary pain, whereby the pain cannot be explained as a symptom of another chronic condition (for example, fibromyalgia, chronic migraine, etc.) and chronic secondary pain caused by other conditions (such as cancer or surgery) which then becomes a separate issue and may persist beyond successful treatment of the initial cause[102].
The challenges presented by chronic pain not only relate to physical wellbeing but can also include detrimental effects on areas such as overall quality of life, mental wellbeing and employment, with evidence suggestive of an additional link with health inequalities [103].
Understanding lived experience alongside prevalence helps to inform understanding and strategies for chronic pain. Collation of the views of a group of individuals with lived experience of chronic pain by Healthcare Improvement Scotland were used to inform recommendations across several priority areas including staff training, patient support, gathering patient feedback, information provision, support for accessing care and addressing health inequalities[104].
5.1.1 Policy background
Chronic pain has a substantial impact on the lives of those affected and with projections that factors contributing to it could increase, its importance as a key policy area for the Scottish Government has been underlined.
The Framework for Pain Management Service Delivery: implementation plan8 (published in 2022 and informed in part by public consultation)[105] is based on four primary aims that cover a commitment to person-centred care (physical and mental); timely access to locally-based care and community support; safe and effective treatment choices; and improving the quality of life of people with lived experience of chronic pain.
The framework builds on previous Scottish Government initiatives and policies related to chronic pain including clinical and community workshops, funding and performance monitoring for pain clinics and residential courses. In addition, the Management of chronic pain in children and young people[106] guidelines were made available in 2018 for clinicians, patients and their families, as was Quality Prescribing For Chronic Pain, a guide intended to promote quality improvement for medicines and therapies designed to manage chronic pain[107].
Through the Framework, steps are being taken to address the measurement of chronic pain and healthcare services in Scotland, including a national Pain Data Group to improve the quality and consistency of data used to inform and promote improved service delivery, where needed, for those with chronic pain.
5.1.2 Reporting on chronic pain in the Scottish Health Survey
This chapter presents data collected for the first time in SHeS for both adults and children on the prevalence and impact on the lives of individuals living with chronic pain in Scotland, as well as access to support. The Warwick-Edinburgh Mental Wellbeing Scale (WEMWBS) is also included to assess mental wellbeing among adults living with chronic pain. Figures are also reported by age, sex and area deprivation.
The area deprivation data are presented in Scottish Index of Multiple Deprivation (SIMD) quintiles. To ensure that the comparisons presented are not confounded by the different age profiles of the quintiles, the data have been age-standardised. For a detailed description of both SIMD and age-standardisation as well as definitions of other terminology used in this chapter and for details on the data collection methods for chronic pain, please refer to Chapter 2 of the Scottish Health Survey 2022 - volume 2: technical report.
Supplementary tables on chronic pain are also published on the Scottish Government website: Scottish Health Survey.
5.2 Chronic Pain
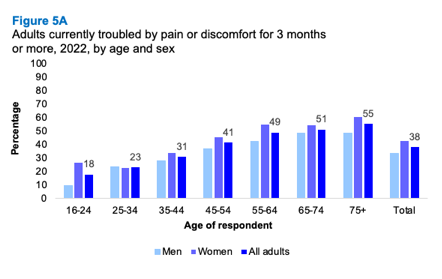
5.2.1 Currently troubled by pain or discomfort and whether lasted more than 3 months, 2022, by age and sex
Among all adults in 2022, more than one-third (38%) were currently being troubled by pain or discomfort that lasted three months or more, referred to as chronic pain. A higher proportion of women (43%) reported being in chronic pain compared with men (33%).
The proportion of adults experiencing chronic pain increased with age: 18% of 16-24 experienced chronic pain for 3 months or more with a linear increase by age to 55% of those aged 75 and above.
In 2022, 6% of all children had experienced chronic pain for three months or more, with no significant difference by sex. However, this did vary by age with a larger proportion of 8–15-year-olds (8%) having experienced chronic pain for 3 months or more compared with those aged 0–7-years (3%).
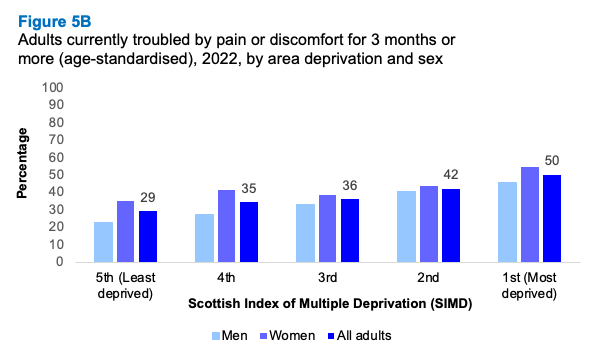
5.2.2 Currently troubled by pain or discomfort and whether lasted more than 3 months (age-standardised), 2022, by area deprivation and sex
Variation in experiences of chronic pain lasting three months or more was evident by area deprivation. The proportion of all adults experiencing chronic pain was higher in the most deprived areas (50%) compared with the least deprived (29%).
Similar patterns appeared to be evident among both men and women. Among men, experience of chronic pain in the last 3 months or more varied from a low of 23% in the least deprived areas to 46% in the most deprived areas. For women, the pattern was not entirely linear, however, overall, the proportion experiencing chronic pain increased from 35% in the least deprived areas to 55% in the most deprived areas.
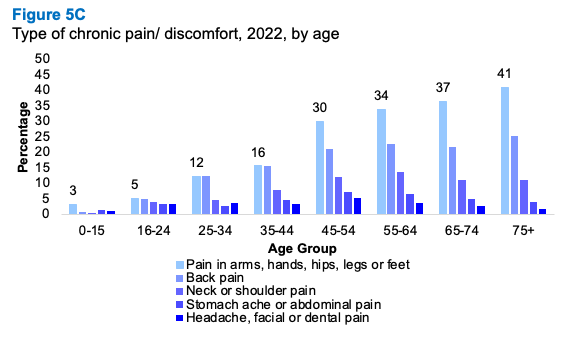
5.2.3 Type of pain/discomfort, 2022, by age and sex
The most common types of chronic pain experienced by all adults in 2022 were pain in arms, hand, hips, leg, or feet (25%), followed by back pain (18%) and neck or shoulder pain (9%). Lower proportions experienced chronic pain in their stomach or abdomen (5%), or in their head, face or teeth (4%).
Chronic pain in the arms, hands, hips, legs or feet increased linearly with age from 5% among adults aged 16-24, to 16% of adults in the 35 to 44 years group, to 41% of those aged 75 years or older. Across most age groups, the incidence of these forms of chronic pain was higher for females than for males. Only in the 25-34 age group were they more prevalent for males (13%) than for females (11%). The difference was greatest in the age groups 55 to 64 years (males: 29%, females: 38%) and 75+ (males: 35%, females: 45%).
A similar pattern occurred for chronic back pain, with incidence increasing from 5% among adults aged 16-24 to 25% of those in the 75+ category. Differences between men and women were not significant.
The most common type of chronic pain experienced by those aged 0-15 was in arms, hand, hips, leg, or feet (boys: 4%, girls 2%).
5.2.4 Whether pain/discomfort limits life/work activities, 2022, by age and sex
In 2022, almost four-fifths of adults who experienced chronic pain/discomfort indicated that it limited their life/work activities to some extent (78%), while the remaining 22% did not experience any impact as a result of chronic pain.
Four in ten adults experiencing chronic pain reported that it limited their life/work a lot. While not a linear pattern, this proportion generally increased with age from 33% of 16-34-year-olds with seriously limiting chronic pain/discomfort to 50% among those aged 75+. A similar pattern was evident for both men and women.
For children, the majority of those who had experienced chronic pain reported that it limited their life activities a little (57%) and 23% that it impacted on these a lot, with no significant difference by sex.
5.2.5 Support received for pain/discomfort, 2022, by age and sex
Among all adults who reported chronic pain in 2022, the majority reported receiving support from their GP (69%), while almost a third (31%) reported receiving support from a physiotherapist.
In 2022, most children suffering from chronic pain received support from a GP (66%) while 28% received support from a physiotherapist. A similar pattern was evident by sex. Table 5.5
5.2.6 Adult WEMWBS mean scores (age-standardised), 2022, by whether been in pain/discomfort for more than 3 months and sex
Adults who experienced chronic pain/discomfort for 3 months or more in 2022 had a lower average WEMWBS mean score of 44.1 compared to those who were not currently experiencing pain/discomfort (49.0) and those who had experienced pain/discomfort but for less than three months (48.0). This pattern was the same for both men and women.

Table list
Table 5.1 Currently troubled by pain or discomfort and whether lasted more than 3 months, 2022, by age and sex
Table 5.2 Currently troubled by pain or discomfort and whether lasted more than 3 months (age-standardised), 2022, by area deprivation and sex
Table 5.3 Type of pain/discomfort, 2022, by age and sex
Table 5.4 Whether pain/discomfort limits life/work activities, 2022, by age and sex
Table 5.5 Support received for pain/discomfort, 2022, by age and sex
Table 5.6 Adult WEMWBS mean scores (age-standardised), 2022, by whether been in pain/discomfort for more than 3 months and sex
Contact
There is a problem
Thanks for your feedback