The Scottish Health Survey 2022 – volume 1: main report
This report presents results for the Scottish Health Survey 2022, providing information on the health and factors relating to health of people living in Scotland.
This document is part of a collection
2 General Health, Cardiovascular Conditions and Caring
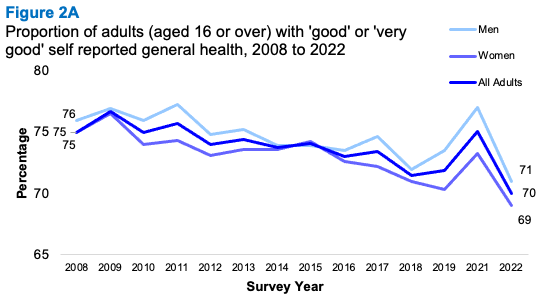
Between 2003 and 2021 the proportion of adults describing their health in general as ‘very good’ or ‘good’ ranged between 71% and 77%. In 2022 this dropped to 70%. Patterns have been similar for men and women, declining for both groups from 2021 to 2022.
- Men
- 2021: 77%
- 2022: 71%
- Women
- 2021: 73%
- 2022: 69%
Most children continued to be described as having ‘very good’ or ‘good’ general health. This remains to be the case for both boys and girls.
- Children: 93%
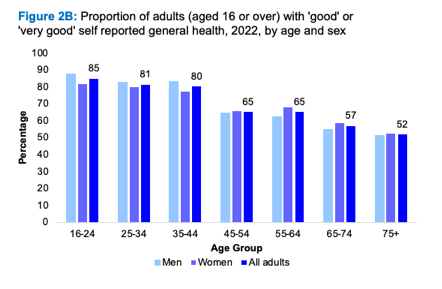
There was a linear relationship between self-assessed general health and age: in 2022, 85% of adults aged 16-24 described their health as ‘good’ or ‘very good’ and the equivalent figure for those aged 75 or above was 52%. This pattern was similar for men and women.
- 16-24: 85%
- 25-34: 81%
- 35-44: 80%
- 45-54: 65%
- 55-64: 65%
- 65-74: 57%
- 75+: 52%
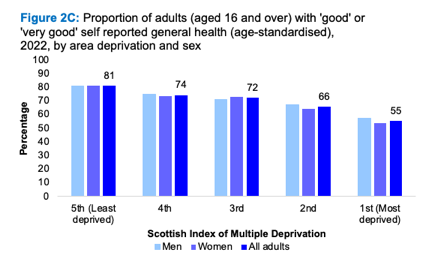
In 2022, the proportion of adults who self- assessed their general health as ‘good’ or ‘very good’ decreased with increased area deprivation, from 81% for those living in the least deprived quintile (SIMD quintile 5) to 55% in the most deprived quintile (SIMD quintile 1).
- Least deprived: 81%
- 4th: 75%
- 3rd: 72%
- 2nd: 66%
- Most deprived: 55%
Since 2008 there has been an increase in the proportion of adults reporting living with a long-term health condition, although minimal change since 2021.
- 2008: 41%
- 2021: 47%
- 2022: 48%
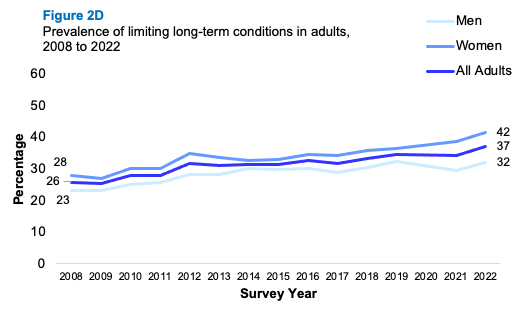
Prevalence of limiting long-term conditions increased from 26% in 2008, to 34% in 2021, to 37% in 2022. Women (42%) were more likely than men (32%) to report a limiting long- term condition.
- 2008: 26%
- 2021: 34%
- 2022: 37%
- Women: 42%
- Men: 32%
Since 2003, the level of adults with any cardiovascular disease (CVD) has remained at around one in six (14-16%; 16% in 2022).
In 2022, the proportion of adults having ever had any cardiovascular disease increased with age.
- 16-24: 5%
- 25-34: 7%
- 35-44: 10%
- 45-54: 14%
- 55-64: 18%
- 65-74: 25%
- 75+: 36%
Prevalence of doctor-diagnosed diabetes among adults increased from 4% in 2003 to 7% in 2018 and has remained around this level (7% in 2022). Prevalence remained higher for men (8%) than for women (6%).
- Men: 8%
- Women: 6%
In 2022, prevalence of doctor-diagnosed diabetes increased from 1-5% of adults aged 16-54 to 11-18% of those aged 55 and above.
- 16-54 years: 1-5%
- 55+ years: 11-18%
In 2022, 1% of adults reported having Type 1 diabetes, with no significant variation by age or sex.
- 2022: 1%
Prevalence of Type 2 diabetes (6% in 2022) increased with age from 1-5% of adults aged 16-54 to 10-16% of those aged 55 and above.
- 16-24: 1%
- 25-34: 0%
- 35-44: 2%
- 45-54: 5%
- 55-64: 10%
- 65-74: 16%
- 75+: 12%
Doctor-diagnosed diabetes was more prevalent in areas of greatest deprivation than in than in areas of least deprivation.
- Most deprived: 10%
- Least deprived: 6%
In 2022, the proportion of adults with Ischemic Heart Disease (IHD) was 5%, similar to previous years, and similar for men and women (6% and 4% respectively).
- 2022: 5%
In 2022, prevalence of IHD increased with age.
- 16-24: 0%
- 25-34: 0%
- 35-44: 1%
- 45-54: 4%
- 55-64: 8%
- 65-74: 11%
- 75+: 15%
IHD was more prevalent in the most deprived quintile than in the three least deprived quintiles.
- Most deprived: 8%
- Least deprived: 3%
Stroke prevalence has remained at 2-3% since 2003 (3% in 2022).
- All adults: 3%
In 2022, prevalence of stroke was highest in the older age groups.
- 16-54 years: 2%
- 65+ years: 9%
In 2021/2022, one in six adults (18% of women and 13% of men) reported providing regular help or unpaid care to someone else.
- Adults: 15%
Adults aged 45-64 were twice as likely as others to report care-giving.
- 16-44 years: 11%
- 45-64 years: 24%
- 65+ years: 12%
Approximately one-third of those providing care in 2021/2022 were doing so for up to four hours per week; 33% for between 5 and 19 hours per week and 17% for more than 50 hours per week.
- Up to 4 hrs pw: 34%
- 5-19 hrs pw: 33%
- 20-34 hrs pw: 8%
- 35-49 hrs pw: 5%
- >50 hrs pw: 17%
- Varies: 3%
During the years 2018-2022 combined, around two-thirds of adults providing regular help or unpaid care reported that they did not receive any form of support in this role.
- 66% of unpaid adult carers received no support
One in five adult carers reported receiving help from family, friends or neighbours.
- Adult carers: 21%
This type of support was more common among those providing 35 or more hours of care per week than among those providing less than 35 hours of care per week.
- >35 hrs per week: 30%
- <35 hrs per week: 18%
One in twelve adult carers were receiving a carer’s allowance in 2018-2022 combined.
- Carer’s allowance in 2018-2022: 8%
Among adult carers, the mean WEMWBS[40] score broadly decreased as the hours of care being provided increased.
- All adults up to 4 hours: 49.5
Josephine Wildman & Stephen Rule
2.1 Introduction
Population measures of self-reported health have been found to be good predictors of mortality, morbidity or use of health care[40]. These measures can reflect subjective lived experiences of diagnosed and undiagnosed (both physical and mental) illnesses which can be overlooked by more objective measurements[41].
The prevalence of long-term conditions has placed considerable strain on healthcare provision[42]. Further challenges are presented by continued inequalities in health outcomes, including decreasing life expectancy for those living in the most deprived areas in Scotland and an ageing population[43].
Cardiovascular disease (CVD) is a general term for conditions that affect the heart and blood vessels, whereby blood flow to the heart, brain, or body is restricted. Its main components are ischaemic heart disease (IHD) and stroke, both of which are well-established clinical priorities for the NHS in Scotland[44],[45]. Since 2009, there has been a steady downward trend in incidence and deaths from IHD and stroke in Scotland[46]. However, IHD continues to be the leading cause of death in Scotland, and with stroke also remains one of the biggest killers as well as the leading cause of disability[47].
Diabetes, the most prevalent metabolic disorder, is a growing health challenge for Scotland. The prevalence of people registered with Type 1 diabetes has increased since 2013, reflecting better survival and the rising prevalence in children. The majority of registered people in Scotland (over four-fifths) have Type 2 diabetes. The prevalence of Type 2 diabetes has also grown, in part due to better detection and treatment but also due to demographic factors such as an ageing population and lifestyle factors such as diet and low levels of physical activity[48],[49].
It is estimated that 3 in 5 people are likely to become a carer at some point in their lives[50]. The care they provide is of significant value, however, such a role can have a negative impact on the physical and mental health and wellbeing of carers, especially given the over-representation of carers in midlife and older age groups[51].
The National Carers Strategy recognises that “Caring can also put pressure on young people, especially where they undertake inappropriate caring responsibilities or spend long hours providing care. Without the right support, young carers are at risk of negative impacts on their educational attainment, relationships with their peer group and their mental health”[52].
Around half of those who provide unpaid care are living with a long-term condition themselves. Having caring responsibilities can also impact on finances, employment opportunities, social relationships and more. Understanding the prevalence of caring and the level of support received from the perspective of carers themselves is vital in informing the delivery of support plans and initiatives for these individuals[53].
2.1.1 Policy background
The Scottish Government’s strategic policies focus on promoting and improving general health and wellbeing, as well as supporting those living with long-term illnesses/conditions. The six Public Health Priorities for Scotland[54] are aimed at improving the health of people in Scotland and are supported by a number of strategies covering specific conditions such as heart disease[55], diabetes[56] and stroke[57].
The Heart Disease Action Plan (2021) sets out the priorities and actions Scottish Government will take to minimise preventable heart disease and ensure equitable and timely access to diagnosis, treatment, and care for people with suspected heart disease in Scotland.
The Progressive Stroke Pathway[58], published in March 2022, sets out a vision for each stage of the stroke pathway, from diagnosis and acute care to the provision of person-centred rehabilitation. The recommendations in the Progressive Stroke Pathway were considered in the publication of Scottish Government’s refreshed Stroke Improvement Plan, published on 14 June 2023[59].
In February 2021, the Scottish Government published the refresh of its Diabetes Improvement Plan[60] (DIP), which sets out aims and priorities to deliver safe and effective person-centred healthcare treatment and support. The Plan sets out priorities and commitments from 2021 to 2026 to improve the prevention, treatment and care for everyone in Scotland living with diabetes.
The Scottish Government’s commitment to unpaid carers in Scotland is reflected in the National Carers Strategy[61]. It sets out a cross-government approach to carers issues, including through social care, social security policies and supporting carers in employment and education.
The Carers (Scotland) Act 2016[62] took effect in 2018. This extended the rights of carers to ensure that they receive better support whilst also maintaining/ improving their own health and enjoying a life beyond their caring role[63].
Embedding carers’ rights to support under the Carers Act is a priority for the Scottish Government and partners. This is complemented by initiatives such as the Short Breaks Fund[64] and the Carer Positive scheme which recognises employers who provide a supportive working environment for carers[65].
2.1.2 Reporting on general health, CVD, diabetes and unpaid caring in the Scottish Health Survey
In this chapter, trends in self-assessed general health for adults and children are presented, as well as prevalence of self-reported long-term conditions in adults. Trends in self-reported CVD, diabetes and stroke prevalence in adults are presented as well as age group and deprivation breakdowns for 2022. Unpaid caring prevalence in adults and children are presented for 2022 along with data on carer support and mental wellbeing for adult carers, using the Warwick-Edinburgh Mental Wellbeing Scale (WEMWBS), for combined 2018 to 2022 data, as well as self-assessed general health among adult carers for 2021/2022 combined.
The area deprivation data are presented in Scottish Index of Multiple Deprivation (SIMD) quintiles. To ensure that the comparisons presented are not confounded by the different age profiles of the quintiles, the data have been age-standardised. For a detailed description of both SIMD and age-standardisation as well as definitions of other terminology used in this chapter and for further details on the data collection methods for general health, CVD and CPR training, please refer to Chapter 2 of the Scottish Health Survey 2022- volume 2: technical report.
Supplementary tables on general health, CVD and caring are also published on the Scottish Government website: Scottish Health Survey.
2.2 General Health, CVD and Caring
2.2.1 Self-assessed general health, adults and children, 2008 to 2022, by sex
Between 2008 and 2021 the proportion of adults describing their general health as ‘good’ or ‘very good’ ranged between 71-77%. In 2022 the prevalence decreased to 70%. The proportion of men and women self-reporting as being in ‘good’ or ‘very good’ health has been similar over the time-series and prevalence declined for both groups between 2021 and 2022 (77% of men and 73% of women in 2021, compared with 71% and 69%, respectively in 2022). The proportion of adults who self-assessed their general health as ‘bad’ or ‘very bad’ increased from 8% in 2021 to 10% in 2022, but the change was not statistically significant.
In 2022, the vast majority of children continued to report having ‘good’ or ‘very good’ general health (93%). This remains to be the case for both boys (93%) and girls (94%). Two percent of children were reported as being in ‘bad’ or ‘very bad’ general health in 2022, similar to previous years.
2.2.2 Adult self-assessed general health, 2022, by age and sex
The proportion of adults describing their general health as ‘good’ or ‘very good’ generally decreased as age increased. In 2022, 85% of adults aged 16-24 described their health as ‘good’ or ‘very good’. The equivalent figure for those aged 75 or above was 52%. This pattern was broadly similar for men and women.
In tandem, the proportion of adults who reported their general health to be ‘bad’ or ‘very bad’ generally increased with age, from 3-6% of those aged 16-44 to 13-16% of those aged 45 and above. Again, this pattern was observed for both men and women.
2.2.3 Adult self-assessed general health (age-standardised), 2022, by area deprivation and sex
In 2022, the proportion of adults who self-assessed their general health to be ‘good’ or ‘very good’ decreased with increased area deprivation, from 81% for those living in the least deprived quintile (SIMD quintile 5) to 55% in the most deprived quintile (SIMD quintile 1).
Those living in areas of greatest deprivation (SIMD quintile 1) were four times as likely as those living in the least deprived areas (SIMD quintile 5) to describe their health in general as ‘bad’ or ‘very bad’ (18%, compared with 4% in the most deprived quintile).
Patterns of self-assessed health by area deprivation were similar for men and women.
2.2.4 Prevalence of long-term conditions in adults, 2008 to 2022, by sex
Since 2008 there has been a gradual increase in the proportion of adults reporting living with a long-term health condition, although there was no significant change between 2021 and 2022 (41% in 2008, 47% in 2021 and 48% in 2022). The increase over time has been slightly more pronounced for women (42% in 2008 and 52% in 2022) than for men (38% in 2008 and 45% in 2022).
Prevalence of a limiting long-term condition increased from 26% in 2008 to 37% in 2022 – representing more than three-quarters of those reporting any long-term condition in 2022. Again, women were more likely than men to report having a limiting long-term condition (42% and 32% respectively).
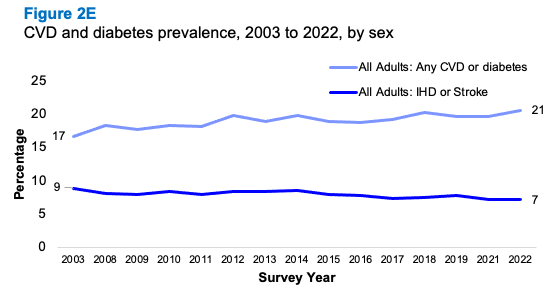
2.2.5 CVD and diabetes prevalence, 2003 to 2022, by sex
Since 2003, the proportion of adults reporting any cardiovascular disease (CVD) has remained between 14-16% (16% in 2022). Prevalence remained slightly higher for men (15-18%) than women (14-16%) throughout the time series with prevalence in 2022 at 17% for men and 14% for women.
Prevalence of doctor-diagnosed diabetes among adults increased from 4% in 2003 to 7% in 2019 and has remained around that level since (7% in 2022). In 2022, 8% of men and 6% of women reported that a doctor had diagnosed them as having diabetes.
The proportion of adults with any CVD or diabetes has remained stable over the last ten years (ranging from 19-21% between 2012 and 2022). The proportion of adults with any CVD or diabetes was 21% in 2022,the highest level in the time series. Prevalence remained slightly higher among men than women in 2022 (23% for men and 18% for women).
In 2022, the proportion of adults with Ischemic Heart Disease (IHD) was 5%, similar to recent years, and a decrease from 7% in 2003. Over the time series prevalence has been largely similar for men and women (6% for men and 4% for women in 2022).
Stroke prevalence in adults has remained between 2-3% since 2003. In 2022 the proportion reporting stroke was 3% for both men and women. A similar pattern was observed for prevalence of IHD or stroke which was 7% in 2022 (8% for men and 6% for women).
2.2.6 Any CVD, CVD or diabetes, IHD, stroke, IHD or stroke, by age and sex, 2022
Any CVD
In 2022 the proportion of adults reporting ever having had CVD increased with age, from 5% for adults aged 16-24 to 36% for those aged 75 and above.
Doctor-diagnosed diabetes
Prevalence of adults with doctor-diagnosed diabetes increased by age in 2022, with 1-5% of adults aged 16-54 having reported a doctor diagnosis of diabetes, compared with 11-18% of those aged 55 and above.
Diabetes Type 1
In 2022, 0-1% of adults reported having type 1 diabetes, with no significant variation by age or sex.
Diabetes Type 2
For all adults, the prevalence of type 2 diabetes was 6% in 2022. Prevalence increased with age, with 1-5% of adults aged 16-54 reporting type 2 diabetes, compared with 10-16% in adults aged 55 and above.
Any CVD or diabetes
Prevalence of any CVD or diabetes increased with age in 2022 from 7% of adults aged 16-24 to 43% of those aged 75 and above. Men aged 65 or over were significantly more likely than women of the same age to report any CVD or diabetes (42% of men aged 65-74 and 49% of men aged 75 and above, compared with 32% and 38%, respectively).
Ischaemic Heart Disease (IHD)
In 2022, the proportion of adults reporting doctor-diagnosed IHD, increased with age, from 0-1% among those aged 44 or under, rising to 15% of those aged 75 and above. The pattern observed by age was true for both men and women and the difference observed between men and women aged 75 and over was significant (20% of men, compared with 11% of women).
Stroke
Prevalence of adults reporting having ever had a stroke increased with age in 2022, from 0-2% among those under the age of 54 to 6-9% of adults aged 65 and above. Prevalence of reported stroke was the same for men and women.
IHD or stroke
In 2022 the proportion of adults who reported having ever had an IHD or stroke increased with age from 0-1% among those under the age of 45 to 6-20% of those aged 55 or above. This pattern was observed for both men and women. Table 2.6
2.2.7 CVD and diabetes prevalence (age-standardised), 2003 to 2022, by area deprivation and sex
Any CVD
There has been little variation in the prevalence of age-standardised CVD by area deprivation since 2003. In 2022, any CVD remained most prevalent among those living in the most deprived areas (SIMD quintile 1), with 20% of adults living in these areas reporting having any CVD, compared with 12% among those living in areas of least deprivation (SIMD quintile 5). The pattern by deprivation was similar for both men and women.
Doctor-diagnosed diabetes
As in previous years, age-standardised doctor-diagnosed diabetes was more prevalent in areas of greatest deprivation, compared with the areas of least deprivation. In 2022, 10% of adults in the most deprived quintile reported doctor-diagnosed diabetes, compared with 5-6% in the two least deprived quintiles. Patterns by area deprivation were similar for both men and women.
Ischaemic Heart Disease (IHD)
In 2022, the prevalence of IHD varied by area deprivation, in a similar way to that seen in previous years. IHD was more prevalent in the most deprived quintile (8% in SIMD quintile 1) than in the three least deprived quintiles (3-4% in SIMD quintiles 3-5). Similar patterns by area deprivation were observed for both men and women.
Stroke
In 2022, as in every year since 2003, the prevalence of stroke varied by area deprivation and was most prevalent in more deprived areas. Five percent of adults in the most deprived quintile reported ever having had a stroke, compared with 1% in SIMD quintile 5, with similar patterns for both men and women.
IHD or stroke
The pattern of prevalence of IHD or stroke across the SIMD quintiles has not changed since 2003 with prevalence remaining highest in more deprived areas. In 2022, one in ten (11%) of those in SIMD quintile 1 reported IHD or stroke, compared with 4% for those living in the least deprived quintile (SIMD quintile 5). This pattern was similar for both men and women. Table 2.7
2.2.8 Caring prevalence and hours spent each week providing help or unpaid care, 2021/2022 combined, by age and sex
In 2021/2022, one in six (15%) adults (18% of women and 13% of men) reported providing regular help or unpaid care to someone else. Adults aged 45-64 were twice as likely as those in other age groups to report care-giving (24%, compared to 11% of 16-44 year olds and 12% of those aged 65 and above). Across all age groups, women were more likely than men to report providing regular help or unpaid care for someone else. For example, 27% of women aged 45-64 reported care giving, compared with 20% of men of the same age.
Approximately one-third (34%) of those providing unpaid care in 2021/2022 were doing so for up to four hours per week. A similar proportion (33%) reported providing care for between 5 and 19 hours per week. One in six (17%) adults providing care, were doing so in excess of 50 hours per week. Table 2.8
2.2.9 Caring prevalence in adults (age-standardised), 2022, by area deprivation and sex
In 2022, caring prevalence for adults was higher for those living in the most deprived areas (18%) than those living in the least deprived areas (15%) although the difference was not significant. The pattern by deprivation was similar for men and women. Table 2.9
2.2.10 Support received by carers, 2018/2019/2021/2022 combined, by age, sex and hours spent caring
During the years 2018/2019/2021/2022 combined, around two-thirds (66% of adults and 68% of children) of those providing regular help or unpaid care reported that they did not receive any form of support in this role.
One in five (21%) adult carers reported receiving help from family, friends or neighbours. This type of support was more common among those providing 35 or more hours of care per week (30%) than among those providing less than 35 hours of care per week (18%). Women caring 35 hours or more, were more likely than men caring for the same number of hours, to receive help from family, friends or neighbours (35% compared with 23% respectively).
One in twelve adult carers (8%) were receiving a carer’s allowance in 2018/2019/2021/2022 combined.
Five percent of adult carers reported receiving practical support in the form of transport, equipment or adaptations in 2018/2019/2021/2022 combined. This type of support was more common (9%) among those providing more than 35 hours of care, than among those providing less than 35 hours of care (4%). Among the small proportion of girls and boys who provided care, almost one-quarter (23%) received help from family, friends or neighbours, and 6% had access to social activities and support (e.g. young carers' groups or day trips). Two-thirds (68%) did not receive any support in this role, but base sizes are small and these numbers should be seen only as indicative. Table 2.11
2.2.11 Adult WEMWBS mean scores, 2018/2019/2021/2022 combined, by age, sex and hours spent each week providing help or unpaid care
In 2018/2019/2021/202 combined adult carers mental wellbeing, based on mean WEMWBS scores, broadly decreased as the hours of care being provided increased. Adults providing care for up to 4 hours per week had a mean WEMWBS score of 49.5, compared to 46.0 of adults who provide care for 50 or more hours per week. Similarly, men providing up to 4 hours of care per week had a mean WEMWBS score of 49.8, compared with a mean score of 47.1 for men who provided care for 50 hours or more per week. Women who provided care for up to 4 hours per week had a mean WEMWBS score of 49.3, compared to 45.3 for those providing 50 hours or more per week. Table 2.12
2.2.12 Adult self-assessed general health of those providing care, 2021/2022 combined, by age and sex
Nearly seven in ten (69%) adult carers described their general health as ‘good’ or ‘very good’ in 2021/2022 combined. The proportion of adult carers assessing their general health in this way declined with age from 73% of those aged 16-44, to 69% of those aged 45-64, and to 64% of those aged 65 or older. A similar pattern was evident for both men and women. Table 2.13
Table List
Table 2.1 Self-assessed general health, adults and children, 2008 to 2022, by sex
Table 2.2 Adult self-assessed general health, 2022, by age and sex
Table 2.3 Adult self-assessed general health (age-standardised), 2022, by area deprivation and sex
Table 2.4 Prevalence of long-term conditions in adults, 2008 to 2022, by sex
Table 2.5 CVD and diabetes prevalence, 2003 to 2022, by sex
Table 2.6 Any CVD, CVD or diabetes, IHD, stroke, IHD or stroke, by age and sex, 2022
Table 2.7 CVD and diabetes prevalence (age-standardised), 2003 to 2022, by area deprivation and sex
Table 2.8 Caring prevalence and hours spent each week providing help or unpaid care, 2021/2022 combined, by age and sex
Table 2.9 Caring prevalence in adults (age-standardised), 2022, by area deprivation and sex
Table 2.10 Caring prevalence in children, 2022, by area deprivation and sex
Table 2.11 Support received by carers, adults and children, 2018/2019/2021/2022 combined, by sex and hours spent caring per week
Table 2.12 Adult WEMWBS mean scores (age-standardised), 2018/2019/2021/2022 combined, by sex and hours spent each week providing help or unpaid care
Table 2.13 Adult self-assessed general health of those providing care, 2021/2022 combined, by age and sex
Contact
There is a problem
Thanks for your feedback