The Scottish Health Survey 2022 – volume 1: main report
This report presents results for the Scottish Health Survey 2022, providing information on the health and factors relating to health of people living in Scotland.
This document is part of a collection
9 Physical Activity
In 2022 65% of adults met the guidelines for moderate or vigorous physical activity (MVPA).[163]
As in previous years, younger adults were more likely than older adults to have met the MVPA guidelines.
- 16-24: 76%
- 25-34: 80%
- 35-44: 74%
- 45-54: 66%
- 55-64: 58%
- 65-74: 55%
- 75+: 37%
In 2022, the age-standardised proportion of adults meeting the MVPA guidelines increased as deprivation decreased.
- Most deprived: 57%
- 2th: 60%
- 3rd: 65%
- 4nd: 68%
- Least deprived: 73%
In 2022 the most common reasons given by all adults for participation in physical activities were to:
- Keep fit (not just to lose weight): 70%
- Enjoy it: 60%
- De-stress-relax-unwind: 45%
- Socialise: 35%
- And/or for health reasons/to improve health: 32%
Amongst adults who did not meet the MVPA guidelines, the most common reasons given were:
- Health was not good enough: 41%
- Difficult to find time: 22%
- Not being interested: 20%
The average time adults spent sitting on weekdays, excluding time working, at college or at school, increased from:
- 2015: 5.2hrs
- 2022: 5.6hrs
The average time adults spent sitting on weekends, excluding time working, at college or at school, increased from:
- 2015: 5.9hrs
- 2022: 6.3hrs
The average amount of time children spent on sedentary activities on weekdays, excluding time at school or nursery, has been in the range from:
- 2015: 3.3hrs
- 2022: 3.6hrs
It has increased over weekends from:
- 2015: 4.5hrs
- 2022: 5.1hrs
In 2022, the proportion of all children aged 5-15 undertaking at least 60 minutes of activity on average per day in the previous week was:
- Including school-based activities: 69%
- Excluding school-based activities: 59%
Including school-based activities, around two in ten children aged 5-15 achieved at least 30 but less than 60 minutes per day on average. While just over one in ten achieved less than 30 minutes of physical activity on average per day:
Girls were more likely to undertake at least 30 but less than 60 minutes of activity on average per day (22%) than boys (16%).
- Girls
- >60: 66%
- 30-60: 22%
- <30: 12%
- Boys
- >60: 72%
- 30-60: 16%
- <30: 12%
Stephen Rule
9.1 Introduction
The World Health Organisation lists physical inactivity as one of the four key modifiable behaviours which increase the risk of non-communicable diseases (NCDs), along with tobacco use, unhealthy diet, and the harmful use of alcohol[160]. Physical activity is beneficial for physical health, maintenance of a healthy weight, mental health (including maintaining cognitive ability), childhood educational attainment and overall wellbeing. A lack of physical activity can result in preventable cases of conditions such as cardiovascular disease, depression, dementia and type 2 diabetes[161].
The UK Chief Medical Officers’ Physical Activity Guidelines[162] (2019) were constructed as advice to the general population about the recommended frequency, intensity, time and types of physical activity required to prevent major chronic disease and to maintain health.
The guidelines recommend that, for good physical and mental health, adults should aim to be physically active every day. Any activity is better than none, and more is better still. Each week, adults should accumulate at least 150 minutes of moderate intensity activity; or 75 minutes of vigorous intensity activity; or even shorter durations of very vigorous intensity activity; or a combination of moderate, vigorous and very vigorous intensity activity. The guidelines also recommend that muscle strengthening activities are undertaken on at least two days a week but that any strengthening activity is better than none. Sedentary time should be minimised as far as possible.
For children and young people, the recommendations[163] are that those aged 5 to 18 years should endeavour to participate in an average minimum of 60 minutes of moderate to vigorous intensity physical activity per day, which should include activity that develops movement skills, bones and muscles; and conversely spend less time sitting or lying down and break up periods of physical inactivity with sporadic movement and activity.
9.1.1 Policy background
The Active Scotland Outcomes Framework[164] sets out the shared vision and goals which have shaped the approach the Scottish Government and a wide range of partner organisations have taken to supporting and enabling people in Scotland to be more physically active. The framework facilitates a cross-government commitment to the importance of physical activity and sport in achieving a wide range of outcomes, including the percentage of schools meeting the physical education target.
The Active Scotland Delivery Plan (A More Active Scotland)[165], published in 2018, identifies a wide range of actions across all sectors with the overall aim of reducing physical inactivity in adults and teenagers by 15% by 2030 and addressing existing inequalities in access to opportunities for physical activity, barriers to participation and how to develop both the confidence and competence needed to encourage lifelong participation in physical activity and sport among children and young people. This plan is currently being revised to reflect the impact of the pandemic and the availability of new international guidance on where efforts should be focussed to improve levels of physical activity across the world.
9.1.2 Reporting physical activity in the Scottish Health Survey
This chapter presents findings on several aspects of physical activity amongst adults and children. For adults aged 16 years and older[166], these include trend and 2022 age and sex breakdowns of adherence to recommended physical activity levels, including muscle strengthening activity levels, reasons for participating in activity, barriers to being more active, and daily sedentary time. For children aged 5 to 15 years, findings are presented on summary activity levels (including and excluding school-based activities) since 1998, 2022 activity by age (2-15 years), and sedentary time.
Breakdown of adult physical activity by deprivation is presented in Scottish Index of Multiple Deprivation (SIMD) quintiles. To ensure that the comparisons presented are not confounded by the different age profiles of the quintiles, the data have been age-standardised. For a detailed description of both SIMD and age-standardisation as well as definitions of other terminology used in this chapter and for details on the 2019 UK Physical Activity Guidelines and data collection methods for physical activity, please refer to Chapter 2 the Scottish Health Survey 2022 - volume 2: technical report.
Please note that some caution should be exercised when interpreting data for 2021 within any time series data presented. In 2021, an opt-in telephone methodology was used due to the COVID-19 restrictions in place. In addition, the data may also have been impacted by the wider societal context in which the survey was undertaken. Please see the 2022 Scottish Health Survey technical report for more information.
Supplementary tables on physical activity are also published on the Scottish Government website: Scottish Health Survey.
9.2 Physical Activity
9.2.1 Adult summary activity levels, 2012 to 2022, by sex
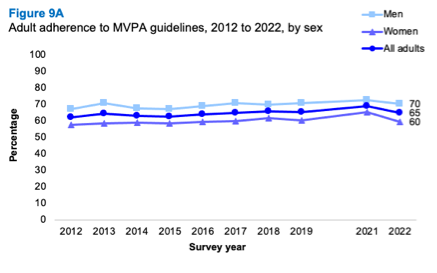
In 2022, 65% of adults met the guidelines for moderate or vigorous physical activity (MVPA)[167]. This is within the range of 62-66% recorded between 2012 and 2019, but lower than the proportion recorded in 2021 (69%).
In 2022, smaller proportions of all adults reported undertaking some (9%), low levels (4%) or very low levels (22%) of physical activity.
As in previous years, in 2022, a higher proportion of men (70%) reported adhering to the MVPA guidelines than women (60%). However, these proportions represented a decline since 2021 (men 73%; women 65%) after increasing from the 2019 levels of 71% and 61% respectively.
9.2.2 Adult summary activity levels, 2022, by age and sex
As in previous years, younger adults were more likely than older adults to have met the MVPA guidelines. In 2022, 74% to 80% of those aged 16-44 met the guidelines, a proportion which decreased by age to 37% among those aged 75 and over.
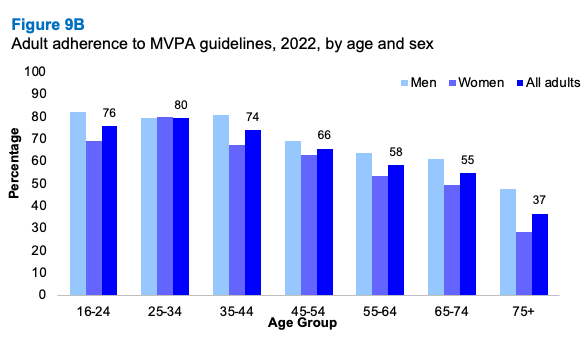
As in previous years, statistically significant differences in the proportions adhering to the MVPA guidelines were recorded by sex for the older age groups in 2022. Among those aged 55-64 years, 64% of men and 54% of women adhered to the guidelines, as did 62% of men compared with 49% of women in the 65-74 age group, and 48% of men compared with 28% of women aged 75 and over.
9.2.3 Adult summary activity levels (age-standardised), 2022, by area deprivation and sex
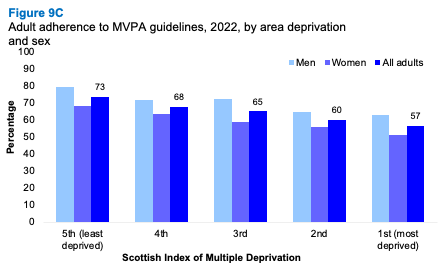
As in previous years, in 2022, the age-standardised proportion of adults who met the MVPA guidelines was lowest among those living in the most deprived quintile (57%) and highest among those living in the least deprived quintile (73%). Similar patterns were evident among men and women.
9.2.4 Adult MVPA and muscle strengthening physical activity, 2022, by age and sex
In 2022, 28% of adults adhered to both the MVPA and muscle strengthening recommendations[168], while 37% met the MVPA guidelines only. Just over one-third (35%) of adults in 2022 did not meet either of the recommendations, while 1% fulfilled the muscle strengthening recommendation only.
As in previous years, men were more likely than women to meet both guidelines in 2022 (32% and 25% respectively), although this difference was not significant.
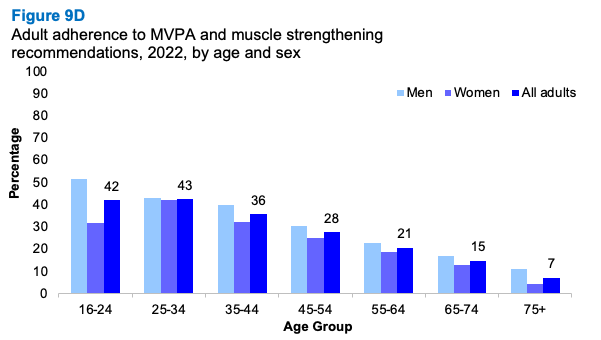
In 2022, adherence to both the MVPA and muscle strengthening recommendations decreased with age, from 36-43% among those aged 16-44 to 7% among those aged 75 and over. Similar patterns were recorded among men and women. The proportion not meeting either recommendation increased with age from 20-25% among those aged 16-44 to 63% among those aged 75 and over.
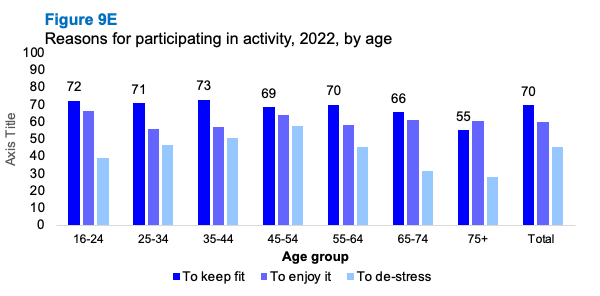
9.2.5 Reasons for participating in activity, 2022, by age and sex
In 2022, the most common reasons given by all adults for participation in physical activities were to keep fit (not just to lose weight) (70%), to enjoy it (60%), to de-stress/relax/unwind (45%), to socialise (35%) and/or for health reasons/to improve health (32%). Similar patterns were evident among men and women.
In 2022, few significant patterns were evident by age; higher proportions of adults aged 45 and over participated in physical activity to help with an injury or disability (10-14%) compared with those aged 16-44 (1-8%).
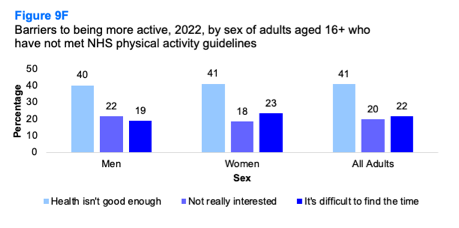
9.2.6 Barriers to being more active, 2022, by age and sex
Amongst adults who did not meet the MVPA guidelines, the most common reasons given were that their health was not good enough (41%), it was difficult to find time (22%) and not being interested (20%). These reasons did not differ significantly by age or sex.
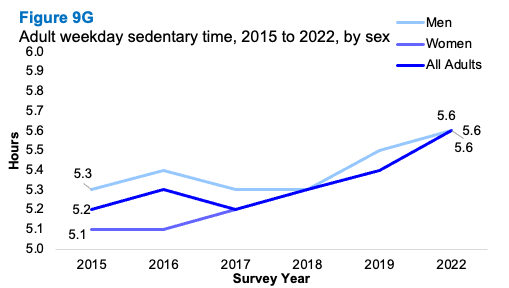
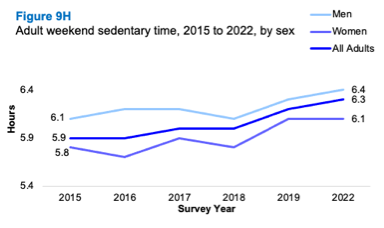
9.2.7 Adult sedentary time, 2015 to 2022, by sex
A small overall increase, not statistically significant, has been recorded in the average time spent sitting by an adult on weekdays (from 5.2 hours in 2015 to 5.6 hours in 2022) and weekends (from 5.9 to 6.3 hours respectively). The trend was similar for men and women. Although men and women were at the same weekday average (5.6 hours), the average sedentary time for men was 0.3 hours more (6.4) than for women (6.1) at weekends.
9.2.8 Children sedentary time, 2015 to 2022, by sex
The average amount of time spent on sedentary activities among children aged from 5 to 15 years in 2022 was higher on weekends than weekdays (5.1 hours and 3.6 hours respectively).
Across the time series, the average amount of time spent on sedentary activities among all children on weekdays has hovered between 3.3 hours in 2015 and 3.6 hours in 2022. It has increased from 4.5 to 5.1 hours on weekends. The trend was similar for boys and girls.
Table 9.8
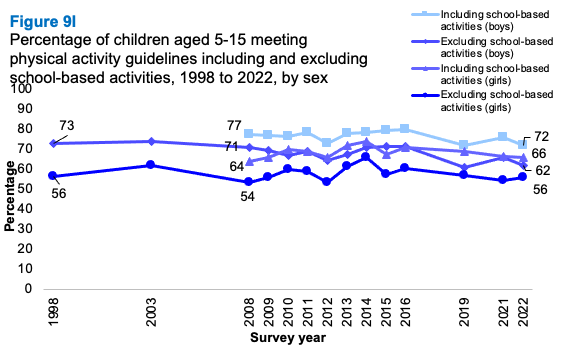
9.2.9 Children summary activity levels (including and excluding school-based activities), 1998 to 2022, by sex
In 2022, the proportion of all children aged 5-15 undertaking at least 60 minutes of activity on average per day in the previous week was 69% (including school-based activities) and 59% (excluding school-based activities). These levels have been relatively stable since 2019, having declined from peaks of 76% (including school-based activities) and 68% (excluding school-based activities) in 2014.
Similar patterns were recorded for both boys and girls.
9.2.10 Children summary activity levels (including school-based activities), 2022, by age and sex
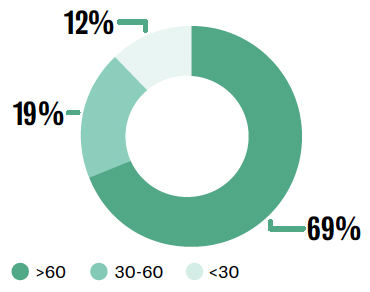
In 2022, around seven in ten children aged 5-15 met the physical activity guidelines of at least 60 minutes on average per day in the previous week (69%), including school-based activities (where applicable). Around two in ten (19%) achieved at least 30 but less than 60 minutes per day on average, and 12% achieved less than 30 minutes of physical activity on average per day.
In 2022, the proportion meeting the recommendations was lowest among those aged 13 to 15 years (54%), while adherence to the guidelines was in the range 62-77% among those aged 2-12.
With the exception of the 5-7 year age group, a higher proportion of boys than girls adhered to the physical activity guidelines in 2022. This variation was only significant among those aged 13-15, with a 22-percentage-point difference between boys and girls (65% and 43% respectively).
In 2022, girls were more likely to undertake at least 30 but less than 60 minutes of activity on average per day (22%) than boys (16%). However, there was no significant difference in the proportions undertaking less than 30 minutes of physical activity on average per day by sex (12% for boys and girls).
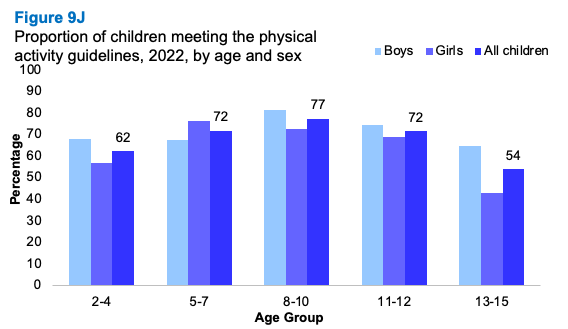
Table list
Table 9.1 Adult summary activity levels, 2012 to 2022, by sex
Table 9.2 Adult summary activity levels, 2022, by age and sex
Table 9.3 Adult summary activity levels (age-standardised), 2022, by area deprivation and sex
Table 9.4 Adult MVPA and muscle strengthening physical activity, 2022, by age and sex
Table 9.5 Reasons for participating in activity, 2022, by age and sex
Table 9.6 Barriers to being more active, 2022, by age and sex
Table 9.7 Adults sedentary time, 2015 to 2022, by sex
Table 9.8 Children sedentary time, 2015 to 2022, by sex
Table 9.9 Children summary activity levels (including and excluding school-based activities), 1998 to 2022, by sex
Table 9.10 Children summary levels (including school-based activities), 2022, by age and sex
Contact
There is a problem
Thanks for your feedback