The Scottish Health Survey 2022 – volume 1: main report
This report presents results for the Scottish Health Survey 2022, providing information on the health and factors relating to health of people living in Scotland.
This document is part of a collection
6 Alcohol
For all adults, prevalence of hazardous or harmful drinking has generally decreased over time, with levels dropping from 34% in 2003 to 22% in 2022.
- 2003: 34%
- 2008: 32%
- 2009: 29%
- 2010: 28%
- 2011: 28%
- 2012: 28%
- 2013: 25%
- 2014: 25%
- 2015: 26%
- 2016: 26%
- 2017: 24%
- 2018: 24%
- 2019: 24%
- 2021: 23%
- 2022: 22%
Non-drinking prevalence rose from 11% in 2003 to 19% in 2022.
- 2003: 11%
- 2022: 19%
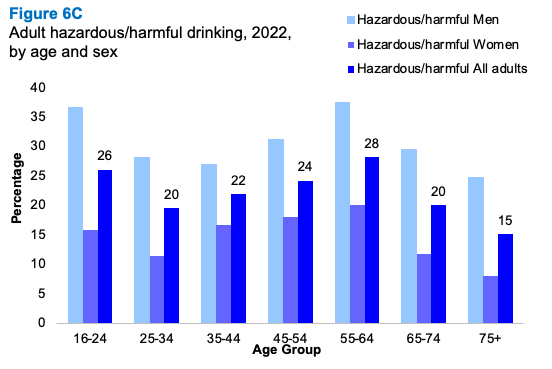
In 2022, hazardous or harmful drinking levels varied by age, ranging between 15% of those aged 75 and over to 28% among those aged 55 – 64.
- 16-24: 26%
- 25-34: 20%
- 35-44: 22%
- 45-54: 24%
- 55-64: 28%
- 65-74: 20%
- 75+: 15%
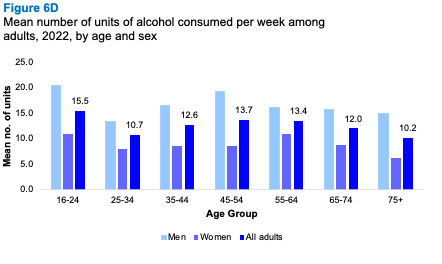
In 2022, the average number of units of alcohol consumed per week by all drinkers was 12.6 units, ranging significantly by age from 15.5 units among drinkers aged 16-24 years to 10.2 among drinkers aged 75+.
- 16-24: 15.5
- 25-34: 10.7
- 35-44: 12.6
- 45-54: 13.7
- 55-64: 13.4
- 65-74: 12.0
- 75+: 10.2
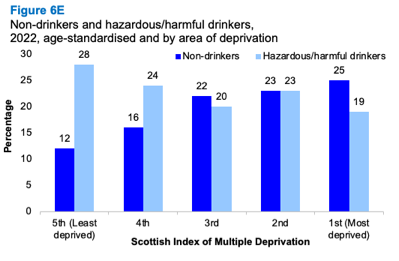
Prevalence of hazardous or harmful drinking levels was significantly higher among those living in the least deprived areas (28% in SIMD quintile 5) than among those living elsewhere (19-23%).
- SIMD quintile 5 (least deprived): 28%
- SIMD quintile 4: 24%
- SIMD quintile 3: 20%
- SIMD quintile 2: 23%
- SIMD quintile 1 (most deprived): 19%
Hazardous or harmful drinking was most prevalent among those who reported having a non-limiting long-term condition and least prevalent among those with a long -term condition that limited their activities.
- Limiting long-term conditions: 17%
- Non-limiting long-term conditions: 29%
- No long-term conditions: 25%
Erin Deakin
6.1 Introduction
Harmful alcohol consumption, which has been linked with a risk of physical and mental health problems and social and economic losses[108], has been a public health challenge in Scotland for decades. A total of 21,840 people were admitted to a general acute hospital with an alcohol-related diagnosis in 2021/22[109]. In addition, in 2022, 1,276 people in Scotland died from alcohol-specific causes, a 2% increase from 2021 and the highest number of annual deaths recorded since 2008[110]. Rates of alcohol-specific death were more than twice as high for men as for women in 2022, with males aged 45 years or older being most at risk. Rates of alcohol-specific death have been reported to be 5.6 times higher in the most deprived areas of Scotland than in the least deprived areas [111].
While both 2020 and 2021 recorded the lowest level of alcohol sales in Scotland over the available time series (since 1994), 9.4 litres of pure alcohol were sold per adult, comprised primarily of spirits (2.9 litres), wine (2.8 litres), beer (2.7 litres) and cider (0.5 litres), and representing 18.1 units of alcohol per adult per week [112]. This is nearly 30% above the UK Chief Medical Officers’ guidelines of 14 units per adult per week.
In 2021, 85% of all pure alcohol sold in Scotland was sold through the off-trade (supermarkets and other off-licences). This is a decrease from 90% in 2020 but an increase from 72% in 2019. The average price of alcohol in 2021 in the off-trade was 64 pence per unit, whereas it was £2.04 per unit in the on-trade (such as pubs, clubs and restaurants)[113]. It should be noted that COVID-19 restrictions continued to affect alcohol sales in 2021 through on-trade premises.
6.1.1 Policy background
The Scottish Government’s Alcohol Framework 2018: Preventing Harm[114] endorses the World Health Organization (WHO) Safer initiative of evidence-based strategies to tackle alcohol-related harm[115]. The framework includes actions related to putting the voices of children and young people at the heart of alcohol preventative measure development, supporting families and communities, keeping the licensing system and statutory guidance under review and consulting on marketing restrictions. The actions included in the framework are grouped into four key impacts focused on:
- Protecting young people
- Tackling health inequalities
- Improving national systems
- A whole population approach
A key strategy for tackling alcohol-related harm in Scotland was the introduction of minimum unit pricing in 2018 (MUP), setting the minimum cost of one unit of alcohol to 50p. MUP has been associated with a 13.4% reduction in alcohol-related deaths[116]. In addition, the Scottish Government work in partnership with both local and national partners to help develop strategies aimed at reducing harmful alcohol use, helping to facilitate recovery, reducing the impact of alcohol on individuals, families and communities and supporting clinicians and clinical organisations[117].
6.1.2 Reporting on harmful alcohol in the Scottish Health Survey
This chapter reports weekly alcohol consumption trends and figures for 2022 for adults, including data for weekly alcohol consumption by age, sex, area deprivation and long-term illness. Data are also presented for the number of days on which alcohol was consumed by adults for 2021 and 2022 combined, by age and sex.
The area deprivation data are presented in Scottish Index of Multiple Deprivation (SIMD) quintiles. To ensure that the comparisons presented are not confounded by the different age profiles of the quintiles, the data have been age-standardised. For a detailed description of both SIMD and age-standardisation as well as definitions of other terminology used in this chapter and for further details on the data collection methods for alcohol consumption and days on which alcohol was consumed, please refer to the Scottish Health Survey 2022 - volume 2: technical report.
Supplementary tables on alcohol use are also published on the Scottish Government website: Scottish Health Survey.
6.2 Alcohol
6.2.1 Estimated usual weekly alcohol consumption level, 2003 to 2022, by sex
For all adults, prevalence of hazardous or harmful drinking has generally decreased over time, with levels dropping from 34% in 2003 to 22% in 2022. While the proportion of men drinking at hazardous or harmful levels has consistently been higher than for women, both have declined over the course of the time series, and the decline has been more pronounced for men than for women. In 2003 47% of men and 23% of women drank to hazardous or harmful levels. The equivalent figures in 2022 were 31% and 15%, respectively.
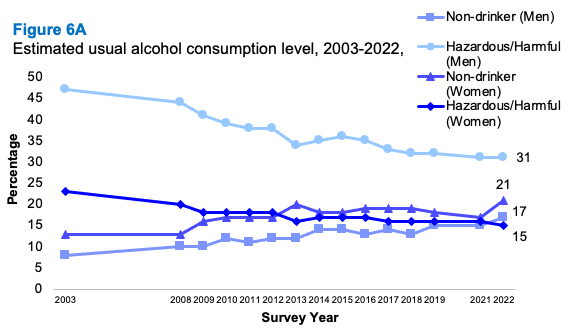
The decrease in drinking at hazardous or harmful levels occurred alongside an increase in the proportion of adults classified as non-drinkers. Non-drinking prevalence rose from 11% in 2003 to 19% in 2022. The increase in non-drinking was observed for both men and women with 17% of men and 21% of women classified as non-drinkers in 2022, compared with 8% and 13%, respectively in 2003.
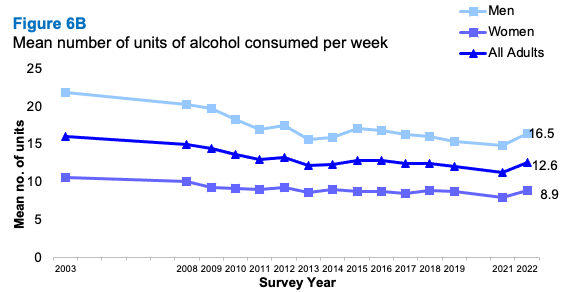
Over time, the mean number of units of alcohol consumed by adults per week decreased from 16.1 units in 2003 to 12.6 units in 2022. Mean unit consumption has followed a similar pattern for men and women with consumption remaining higher among men than women in 2022 (16.5 units of alcohol for men, compared with 8.9 units for women).
6.2.2 Estimated usual weekly alcohol consumption level, 2022, by age and sex
In 2022, hazardous or harmful drinking levels varied by age, ranging between 15% of those aged 75 and over to 28% among those aged 55-64. As observed in previous years, men were significantly more likely than women to display higher levels of hazardous or harmful drinking across all age groups. The proportion of men classified as drinking to hazardous or harmful levels was highest among those aged 55-64 (37%) and 16-24 (37%). Among women, hazardous or harmful drinking was most prevalent among those aged 35-64 years old (17-20%). Levels of hazardous or harmful drinking were lowest for men and women aged 75 or over (25% of men and 8% of women).
For all adults, non-drinking prevalence was highest among those aged 16-24 (23%) and 65 years and older (23-27%), with similar patterns for men and women.
In 2022, the average number of units of alcohol consumed per week by all drinkers was 12.6 units, ranging significantly by age from 15.5 units among drinkers aged 16-24 years to 10.2 among drinkers aged 75+. Average unit consumption was higher among men than women across all groups, and this was most pronounced in the 45-54 age category (men aged 45-54 consumed 19.2 unit per week, compared with 8.6 units for women in the same age group).
6.2.3 Estimated usual weekly alcohol consumption level (age-standardised), 2022, by area deprivation and sex
In 2022, levels of age-standardised weekly alcohol consumption varied by area deprivation. Prevalence of hazardous or harmful drinking levels was significantly higher among those living in the least deprived areas (28% in SIMD quintile 5) than among those living elsewhere (19-24%). This pattern between area deprivation and estimated usual alcohol consumption was observed for both men and women.
There was also a significant association between area deprivation and non-drinking prevalence in 2022, with the highest proportion of non-drinkers living in the most deprived areas (25% in SIMD quintile 1) and lowest in the least deprived areas (12% in SIMD quintile 5). This linear pattern was observed for women but for men, non-drinking prevalence was highest among those living in SIMD quintile 3 (22%).
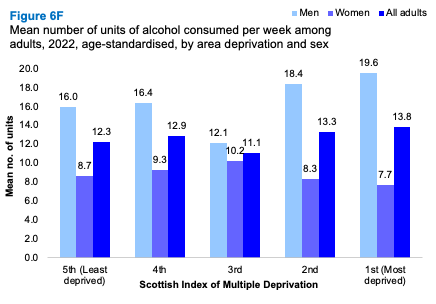
The age-standardised mean number of units of alcohol consumed per week by adult drinkers did not vary significantly by area deprivation. Across all deprivation quintiles, men consumed a higher mean number of units of alcohol per week than women, with this being most pronounced in the most deprived areas (19.6 units for men and 7.7 units for women in SIMD quintile 1).
6.2.4 Estimated usual weekly alcohol consumption level (age-standardised), 2022, by limiting long-term condition and sex
Hazardous or harmful drinking was most prevalent among those who reported having a non-limiting long-term condition (29%) and least prevalent among those with a long-term condition that limited their activities (17%). This pattern by long-term condition was observed for men (43% of men with a non-limiting long-term condition reported drinking hazardous or harmful amounts, compared to 24% of those with a limiting long-term condition), whereas prevalence of hazardous or harmful drinking for women was similar irrespective of whether they had a long-term condition or not (13-16%).
For all adults, those with a limiting long-term condition were most likely to be non-drinkers (26%), compared with 14% of those with a non-limiting long-term condition and 15% of those with no long-term condition. This pattern was observed across both sexes, with women more likely to be non-drinkers than men.
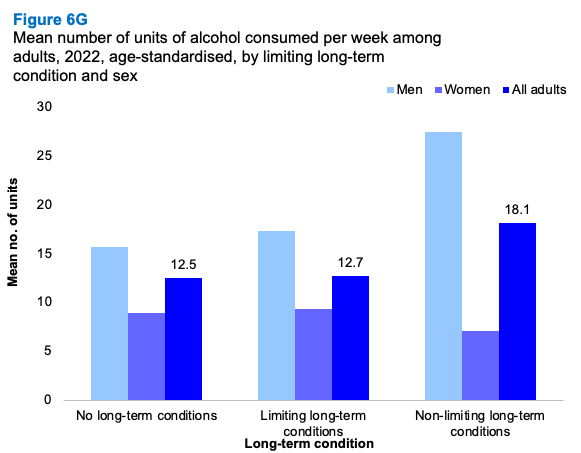
The age-standardised mean number of units of alcohol consumed per week by adult drinkers varied significantly by long-term condition. On average, adults with a non-limiting long-term condition drank significantly more units of alcohol per week than those with either a limiting long-term condition or no long-term conditions (18.1 units compared to 12.7 for those with limiting long-term conditions and 12.5 for those with no long-term condition). Across all groups, a higher mean number of units of alcohol was consumed per week amongst men compared with women, with the greatest differences observed between men and women with a non-limiting long-term condition (27.4 units for men, 7.1 units for women).
6.2.5 Number of days on which adult drinkers drank alcohol in the past week, 2021/2022 combined, by age and sex
In 2021/2022, 7% of adult drinkers who consumed alcohol in the week prior to interview, did so almost every day. The proportion of drinkers consuming alcohol almost every day in the previous week increased with age. Just 1% of 16-24-year-old drinkers drank almost every day in the last week, compared with 20% of those aged 75 and over. While this linear pattern was observed for both sexes, it was more pronounced for male drinkers than female drinkers.
The mean number of days on which adult drinkers drank alcohol in the week prior to interview was 2.6 days in 2021/2022. The average number of days on which adult drinkers drank alcohol in the previous week increased with age from 2.0 days for those drinkers aged 16-24 to 3.3 days for those aged 75 or over. The pattern by age was observed for both men and women and was most pronounced for men. Male drinkers aged 16-24 drank on an average of 1.9 days in the week prior to interview and the mean for female drinkers this age was 2.0 days. The equivalent figures for drinkers aged 75 or over was 3.6 days for men and 2.9 for women.
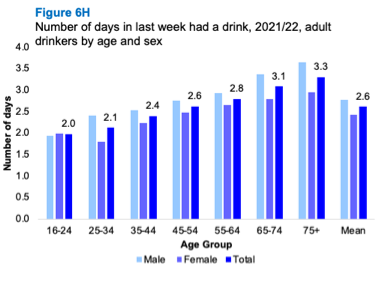
Table list
Table 6.1 Estimated usual weekly alcohol consumption level, 2003 to 2022, by sex
Table 6.2 Estimated usual weekly alcohol consumption level, 2022, by age and sex
Table 6.3 Estimated usual weekly alcohol consumption level (age-standardised), 2022, by area deprivation and sex
Table 6.4 Estimated usual weekly alcohol consumption level (age-standardised), 2022, by limiting longstanding illness and sex
Table 6.5 Number of days on which adult drinkers drank alcohol in the past week, 2021/2022 combined, by age and sex
Contact
There is a problem
Thanks for your feedback