The Scottish Health Survey 2022 – volume 1: main report
This report presents results for the Scottish Health Survey 2022, providing information on the health and factors relating to health of people living in Scotland.
This document is part of a collection
7 Smoking
The proportion of adults who reported themselves to be current smokers in 2022 was 15%. While this is higher than the figure reported in 2021 (11%), the 2022 figure is in line with the general downward trend in previous years (17% in 2019.)
- 2003: 28%
- 2008: 26%
- 2009: 25%
- 2010: 25%
- 2011: 23%
- 2012: 25%
- 2013: 21%
- 2014: 22%
- 2015: 21%
- 2016: 21%
- 2017: 18%
- 2018: 19%
- 2019: 17%
- 2021: 11%
- 2022: 15%
In 2022, almost two thirds of adults reported never having smoked or previously having smoked only occasionally, an overall increase from 50% in 2003.
- 2022: 63%
- 2003: 50%
As was the case with current smoking rates, an overall decrease in the mean number of cigarettes smoked by current smokers has been recorded, with a peak of 15.3 per day recorded among all current smokers in 2003.
- 2003: 15.3
- 2022: 11.4
In 2022, smoking was most prevalent for those aged 45-54, and least prevalent for those aged 75 and over. Significantly more men (18%) than women (13%) reported that they were currently smokers.
- 16-24: 17%
- 25-34: 17%
- 35-44: 15%
- 45-54: 19%
- 55-64: 15%
- 65-74: 14%
- 75+: 6%
The number of cigarettes consumed per day tended to increase with age up to a peak of 15.6 among those aged 65-74.
In 2022, the age-standardised prevalence of current cigarette smoking remained highest (25%) among adults living in the most deprived areas, and lowest among those living in the least deprived areas (7%). This continued the trend observed since 2003, when smoking prevalence was 45% in most deprived areas and 17% in least deprived areas.
- Most deprived
- 2022: 25%
- 2003: 45%
- Least deprived
- 2022: 7%
- 2003: 17%
In 2022, the age-standardised mean number of cigarettes smoked per day was highest among adults living in most deprived areas and lowest among those living in least deprived areas.
- Most deprived 2022: 13
- Least deprived 2022: 10
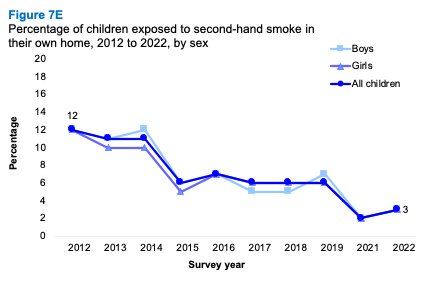
In 2022, a small proportion (3%) of children were reported to be exposed to second-hand smoke in their own home.
- 2022: 3%
The 2022 figure represents a slight but not significant increase compared with 2021 but an overall decrease of nine percentage points since 2012.
- 2012: 12%
- 2021: 2%
- 2022: 3%
Current Nicotine Vapour Product (NVP) use increased in 2022 among all adults to 10%, having remained in the range 5 - 7% between 2014 and 2021.
- 2014: 5%
- 2019: 7%
- 2022: 10%
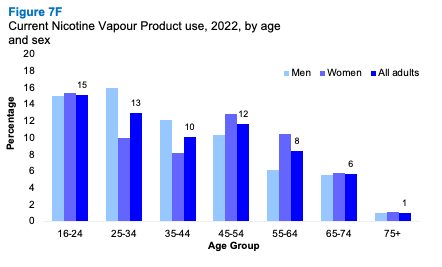
The use of NVPs was most prevalent among those aged 16-24. 15% of adults aged 16-24 reported that they currently used NVPs and usage was lowest among those aged 75 and older: 1% reported that they currently use NVPs.
- 16-24: 15%
- 25-34: 13%
- 35-44: 10%
- 45-54: 12%
- 55-64: 8%
- 65-74: 6%
- 75+: 1%
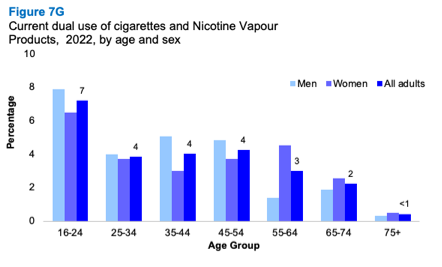
4% of all adults reported using both NVPs and cigarettes, while 5% reported current use of NVPs and previous use of cigarettes.
Use of NVPs tended to decrease with age, with dual use of NVPs and cigarettes and use of NVPs with no history of smoking highest among those aged 16-24 (7% and 3% respectively) and lowest among those aged 75 and older (<1% and 0% respectively).
Currently vape & smoke cigarettes:
- 16-24: 7%
- 25-34: 4%
- 35-44: 4%
- 45-54: 4%
- 55-64: 3%
- 65-74: 2%
- 75+: <1%
Currently vape, no history of smoking cigarettes
- 16-24: 3%
- 25-34: 1%
- 35-44: 1%
- 45-54: 1%
- 55-64: <1%
- 65-74: 1%
- 75+: 0%
A higher proportion of men than women had never tried to stop smoking in 2021/2022 combined (28% men; 16% women), while a lower proportion of men than women had tried to stop smoking three times or more (37% and 49% respectively).
Eleanor Holman
7.1 Introduction
Tobacco is recognised internationally as a major public health threat. More than eight million deaths worldwide each year are a direct result of tobacco use, with over one million attributed to second-hand smoke exposure[118]. The impacts of tobacco include a significant healthcare burden through the treatment of tobacco attributable diseases and morbidity.
Smoking is the cause of around one in five deaths and the primary preventable cause of premature death and ill health in Scotland[119],[120]. Evidence of differences by deprivation mean that smoking also remains an ongoing health inequality challenge[121]. Smoking-related health risks increase over time but can be substantially reduced following smoking cessation interventions; cost-effective interventions that help to reduce the economic and human cost of smoking-related illnesses and conditions[122].
Less is known about the long-term impact of Nicotine Vapour Products (NVPs) (electronic cigarettes and all related equipment, including liquids). However, these practices are not deemed to be risk-free, particularly where there is dual use alongside tobacco products[123],[124]. Further research to evaluate the long-term effects of NVPs is needed. While NVPs are deemed lower risk than tobacco products and a useful cessation aid, there is evidence of potential for harm including to the cardiovascular system[125].
7.1.1 Policy background
The overall strategic objective for health in the Scottish Government’s National Outcomes Framework is ‘We are healthy and active’[126]. Scottish Health Survey data is used as a National Indicator to measure the proportion of adults with two or more of the following health risk behaviours: currently smoking, harmful drinking, low physical activity and obesity[127].
Scottish Government’s new Tobacco and Vaping Framework: a roadmap to 2034[128], launched in November 2023, outlines interventions and policies that aim to ensure Scotland is raising a tobacco-free generation by 2034 (defined as ‘a smoking prevalence among the adult population of 5% or lower’). This includes working with the UK Government on their Smoke Free Generation, further action on NVPs and measures to reduce the environmental impact of single use NVPs and to encourage responsible disposal[129].
A Fairer, Greener Scotland: Programme for Government 2021-22[130] pledged to develop a renewed action plan to identify additional interventions that will help to achieve the ambition for a tobacco‑free generation by 2034.
7.1.2 Reporting on smoking in the Scottish Health Survey
This chapter presents trend data for cigarette smoking and NVPs use as well as prevalence of adult cigarette smoking by age, sex and area deprivation, NVP use for 2022, and dual use of both cigarettes and NVPs. This chapter also presents data on trends in second-hand smoke exposure among children and data on attempts to quit smoking, analysed by age, sex and area deprivation, as well as the use of nicotine replacement therapy (NRT) and other products for smoking cessation.
The area deprivation data are presented in Scottish Index of Multiple Deprivation (SIMD) quintiles. To ensure that the comparisons presented are not confounded by the different age profiles of the quintiles, the data have been age-standardised. For a detailed description of both SIMD and age-standardisation, as well as definitions of other terminology used in this chapter and further details on the data collection methods for smoking, please refer to Chapter 2 of the Scottish Health Survey 2022- volume 2: technical report.
Please note that some caution should be exercised when interpreting data for 2021 within any time series data presented. In 2021, an opt-in telephone methodology was used due to the COVID-19 restrictions in place. In addition, the data may also have been impacted by the wider societal context in which the survey was undertaken. Please see the 2022 Scottish Health Survey technical report for more information.
Supplementary tables on smoking are also published on the Scottish Government website: Scottish Health Survey.
7.1.3 Comparability with other UK statistics
The Health Survey for England, Health Survey for Northern Ireland and the National Survey for Wales provide estimates of smoking prevalence in the other home nations within the UK. The surveys are conducted separately and have different sampling methodologies, so smoking prevalence estimates across the surveys are only partially comparable. Smoking prevalence estimates from the UK-wide Integrated Household Survey for Scotland, Wales, England and Northern Ireland have been deemed to be fully comparable[131].
7.2 Smoking
7.2.1 Cigarette smoking status, 2003 to 2022, by sex
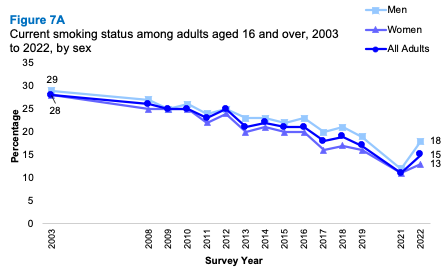
The proportion of adults who reported themselves to be current smokers in 2022 was 15%. While this is higher than the figure reported in 2021 (11%), the 2022 figure is in line with the general downward trend in previous years (17% in 2019). The 2022 proportion of current smokers represents an overall decrease from a peak of 28% in 2003. However, some caution should be exercised when interpreting the lower current smoking prevalence reported in 2021 (see section 7.1.2 and the 2022 technical report).
As was the case for all adults, there has been an overall decrease in the proportions reporting themselves to be current smokers by sex since the start of the timeseries in 2003 (28% of women and 29% of men).
The proportion who reported themselves to be current smokers among men was 18% in 2022, returning to a similar proportion as recorded in 2019 (19%). While the 2022 figure for women (13%) was higher than in 2021 (11%), it remains lower than the 2019 proportion of 16%.
Despite variations in the proportion of current smokers, the proportion of ex-smokers has remained relatively stable over time. Just over one-fifth (22%) of adults in 2022 reported that they used to smoke cigarettes regularly but no longer do, with this proportion having been in the range 22 - 26% since 2003. Similarly consistent patterns for ex-smokers were evident among both men and women.
In 2022, almost two thirds (63%) of adults reported never having smoked or previously having smoked only occasionally, an overall increase from 50% in 2003. Similar patterns were recorded by sex, with this proportion increasing overall from 47% in 2003 to 59% in 2022 among men and from 53% to 66% respectively among women.
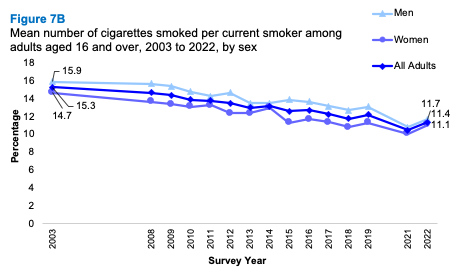
Among all adults who were current smokers, a mean of 11.4 cigarettes per day was recorded in 2022, with no significant variation by sex (11.1 per day for women and 11.7 for men). As was the case with current smoking rates, an overall decrease in the mean number of cigarettes smoked by current smokers has been recorded, from a peak of 15.3 per day recorded in 2003. Similar patterns were evident by sex.
7.2.2 Cigarette smoking status, 2022, by age and sex
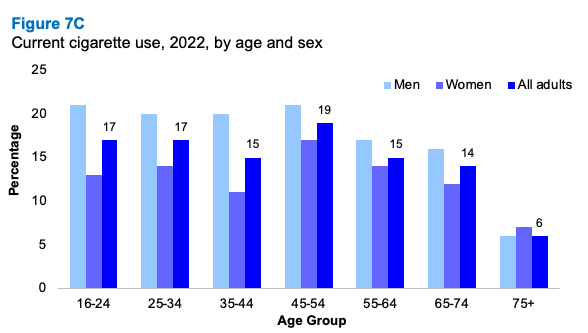
As noted above, in 2022, 15% of all adults were current smokers. Smoking was most prevalent for those aged 45-54 (19%), and least prevalent for those aged 75 and over (6%). Significantly more men than women reported that they were currently smokers (18% and 13% respectively). Conversely, significantly more women than men indicated that they had never smoked (66% and 59% respectively).
Of those who smoked, the mean number of cigarettes consumed per day was 11.4, with similar patterns for men and women. The number of cigarettes consumed per day tended to increase with age up to a peak of 15.6 among those aged 65-74.
Ex-regular smokers tended to be older, with only 6% of those aged 16-24 reporting having smoked regularly in the past, compared with 34% of those aged 75 and older. The reverse pattern was found for those who had never smoked, falling from 77% of those aged 16-24 to 55-59% of those aged 45 and older.
7.2.3 Cigarette smoking status (age-standardised), 2003 to 2022, by area deprivation and sex
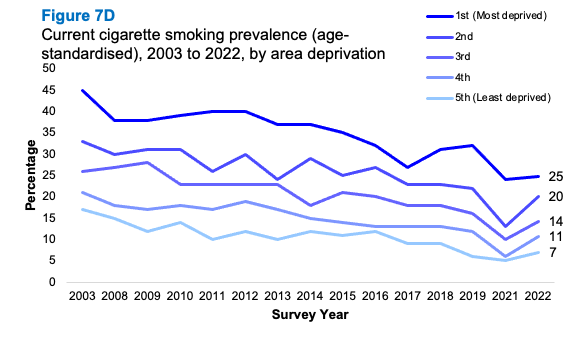
In 2022, the age-standardised prevalence of current cigarette smoking remained highest among adults living in the most deprived areas (25%), and lowest among those living in the least deprived areas (7%). This continued the trend observed since 2003, when smoking prevalence was 45% in most deprived areas and 17% in least deprived areas.
When evaluating the 2022 data in comparison with data recorded prior to and during the pandemic, some variations by area deprivation were evident. In 2022, the proportion of current cigarette smokers was similar to levels recorded in 2019 for all deprivation areas except the most deprived, where the 2022 proportion (25%) remained similar to 2021 (24%) and lower than in 2019 (32%). The proportion of current smokers has varied for this deprivation area in recent years and further data is required in order to assess whether this is a potential trend.
In 2022, the age-standardised mean number of cigarettes smoked per day was highest among adults living in the most deprived areas (13.0 per day) and lowest among those living in least deprived areas (10.0). This pattern has been evident across the timeseries.
7.2.4 Children's exposure to second-hand smoke, 2012 to 2022, by sex
In 2022, 6% of children aged 0-15 were living in accommodation in which someone regularly smoked indoors, a figure which was consistent for both boys and girls. This is a slight but not significant increase compared with 2021 (4%), however, it represents a decrease since 2019 (11%) and an overall decrease of 13 percentage points since 2012 (19%). As with the figures on adult smoking rates, the figures for 2021 must be interpreted with caution (see section 7.1.2 and the 2022 technical report).
In 2022, a small proportion (3%) of children were reported to be exposed to second-hand smoke in their own home. Over the time series, this proportion has reflected a similar pattern to the proportion of children living in accommodation with someone who regularly smoked indoors. The 2022 figure (3%) represents a slight but not significant increase compared with 2021 (2%) but an overall decrease of nine percentage points since 2012 (12%). The pattern has been similar among boys and girls across the time series.
7.2.5 Nicotine Vapour Product use, 2014 to 2022, by sex
Current Nicotine Vapour Product (NVP) use increased in 2022 among all adults to 10%, having remained in the range 5 - 7% between 2014 to 2021. Similar patterns and increases in 2022 were recorded by sex.
The proportion of adults who had never used NVPs was 79% in 2022, a proportion which is slightly below the range recorded between 2014 and 2021 (80 - 85%). Table 7.5
7.2.6 Nicotine Vapour Product use, 2022, by age and sex
In 2022, 21% of all adults reported that they had ever used Nicotine Vapour Products (NVPs): 10% reported being current users and 11% reported having previously used them. 79% of adults had never used NVPs. Similar patterns were recorded for men and women.
The use of NVPs was most prevalent among those aged 16-24. About one in seven (15%) adults aged 16-24 reported that they currently used NVPs, while 24% of adults in this age group reported that they had previously used NVPs. Conversely, usage was lowest among those aged 75 and older with just 1% reporting that they currently use NVPs, and 3% reporting that they have previously used NVPs.
7.2.7 Dual use of Nicotine Vapour Products and cigarettes, 2022, by age and sex
In 2022, 4% of all adults reported using both NVPs and cigarettes, while 5% reported current use of NVPs and previous use of cigarettes. One percent reported current use of NVPs and no history of smoking cigarettes. Similar patterns were recorded for men and women, however significantly more women than men did not currently smoke or use NVPs (82% and 76% respectively).
Use of NVPs tended to decrease with age, with dual use of NVPs and cigarettes and use of NVPs with no history of smoking highest among those aged 16-24 (7% and 3% respectively) and lowest among those aged 75 and older (<1% and 0% respectively).
7.2.8 Attempts to quit smoking, 2021/2022 combined, by age and sex
In 2021/2022 combined, two-thirds (66%) of adult current smokers reported that they would like to give up smoking. A large proportion (78%) had tried to stop at least once, with 42% having tried to stop three times or more. Similar figures were recorded among men and women, with no significant variations.
Among those who had stopped smoking at some point in 2021/2022 combined, 44% reported that they had managed to stop smoking for over 6 months, with 56% having stopped for less than 6 months.
A higher proportion of men compared with women had never tried to stop smoking in 2021/2022 combined (28% men; 16% women), while a lower proportion of men had tried to stop smoking three times or more (37% and 49% respectively).
Adult smokers under the age of 64 were more likely to indicate that they wanted to give up smoking (66 – 73%) compared with those aged 75 and over (40 – 51%). However, it was the youngest age group that was most likely to indicate that they had never tried to stop (31% among those aged 16-44). Table 7.8
7.2.9 Use of NRT and other products, 2022, by age and sex
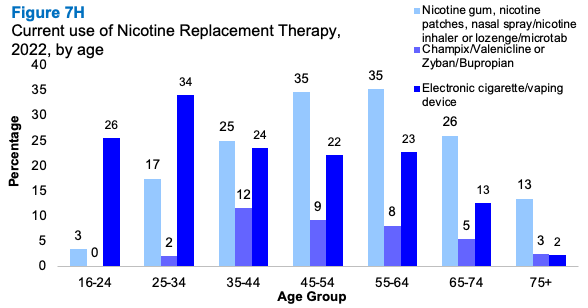
In 2022, 40% of adult ex-smokers and current smokers who had ever attempted to quit smoking, had used some form of Nicotine Replacement Therapy (NRT) during their most recent attempt to quit smoking.
The most frequently used form of NRT was nicotine gum, patches, sprays/inhalers or lozenges/microtabs (25%), followed by NVPs (21%). Over half of adults who used to smoke or had ever tried to quit reported that they had not used any form of NRT (60%).
Similar patterns of NRT use were recorded for men and women.
7.2.10 Use of NRT and other products that helped successful smoking cessation, 2018/2019/2021/2022 combined, by age and sex
Success rates of NRTs reported among those who had tried to use them were 74% for e-cigarettes/vaping devices; 73% for Champix/Valenicline or Zyban/Bupropian; and 60% for nicotine-containing products (gum, patches, sprays/ inhalers or lozenges/microtabs). These figures were similar for men and women.
Table 7.10
Table list
Table 7.1 Cigarette smoking status, 2003 to 2022, by sex
Table 7.2 Cigarette smoking status, 2022, by age and sex
Table 7.3 Cigarette smoking status (age-standardised), 2003 to 2022, by area deprivation and sex
Table 7.4 Children's exposure to second-hand smoke, 2012 to 2022, by sex
Table 7.5 Nicotine Vapour Product use, 2014 to 2022, by sex
Table 7.6 Nicotine Vapour Product use, 2022, by age and sex
Table 7.7 Dual use of e-cigarettes and cigarettes, 2022, by age and sex
Table 7.8 Attempts to quit smoking, 2021/2022 combined, by age and sex
Table 7.9 Use of NRT and other products, 2022, by age and sex
Table 7.10 Use of NRT and other products that helped successful smoking cessation, 2018/2019/2021/2022 combined, by age and sex
Contact
There is a problem
Thanks for your feedback