Scottish Health Survey – telephone survey – August/September 2020: technical report
Presents information on the methodology and fieldwork from the Scottish Health Survey – telephone survey- August September 2020.
This document is part of a collection
1.6 Survey Response
1.6.1 Introduction
This section presents the fieldwork outcomes for the sampled addresses. Survey response is an important indicator of survey quality as non-response can introduce bias into survey estimates.
1.6.2 Household response
Table 1.1 shows a detailed breakdown of the SHeS response for all sampled addresses in the telephone survey. Figures are presented as a percentage of the issued sample, as a percentage of eligible households and as a percentage of households who both opted in and provided a valid telephone number. An assumption was made that the proportion of ineligible addresses was 10% of the sampled addresses. This is based on evidence from previous years of SHeS, in which interviewers have found around 10% of addresses to be ineligible because they are unoccupied, occupied only as a holiday home, are non-residential, or otherwise do not fall within the scope of the survey.
1,498 households opted into the survey and of these, 1,476 provided valid telephone numbers. The number of opt-ins with valid numbers represented 13.4% of the issued sample and 14.9% of eligible households.
At each selected household in the main sample, all adults aged 16 and above were eligible for interview. When considering the household response rate, households classed as “responding” were those where at least one eligible person was interviewed. The table shows that 14.0% of eligible households were classed as responding, equating to 93.8% of those who opted in and provided a valid phone number. In around three-quarters (70.1%) of the responding households, all those aged 16 and above were interviewed (10.4% of eligible households).
Table 1.2 shows that across Heath Boards, the percentage of households where at least one person was interviewed ranged from 9.9% of eligible households in Orkney to 18.0% in Dumfries and Galloway.
Table 1.3 shows the same information for local authorities. The percentage of households where at least one person was interviewed ranged from 8.5% of eligible households in Inverclyde and 8.6% in West Dunbartonshire to 21.5% in East Renfrewshire.
Table 1.4 shows that response rate increased with decreasing levels of deprivation. In the most deprived SIMD quintile, at least one person was interviewed in 9.9% of eligible households compared to 19.9% in the least deprived quintile. Tables 1.1-1.4
1.6.3 Individual response for adults
Overall, there were 1,920 adult responses to the SHeS 2020 telephone survey. Tables 1.2, 1.3 and 1.4 show the number of adults per productive address and the number of achieved interviews as a percentage of the number of adults in productive households, for Health Board areas, local authorities and SIMD quintiles respectively.
There were, on average, 1.69 adults residing in each productive household and 81.9% of these were interviewed. The percentage of adults in productive households who were interviewed ranged across the Health Board areas from 75.5% in the Western Isles (where the number of adults per household was largest at 1.89) to 88.2% in Orkney (where there were 1.62 adults per productive household).
Across the local authority areas, the percentage of adults in productive households who were interviewed ranged from 67.3% in East Renfrewshire (where there were 1.88 adults per household) to 91.3% in Angus (where there were 1.64 adults per household).
The proportion of adults in productive households who were interviewed was fairly similar in each of the SIMD quintiles, between 80.8% and 83.7%. However, the number of adults per productive address increased with decreasing levels of deprivation, from 1.49 in the most deprived areas to 1.84 in the least deprived areas. Combined with the increasing response rate as deprivation decreased, this led to a considerable skew in the number of responding adults in each deprivation quintile, rising from 294 in the most deprived areas to 619 in the least deprived areas. The weighting strategy for the survey has been amended to take into account this skewed distribution of responses across the quintiles (see section 1.7).
Table 1.5 shows that men are under-represented in the achieved interviews compared to the National Records of Scotland’s (NRS) mid-2019 population estimates as they made up 42% of the sample, but 48% of the population. Younger age groups were also under-represented in the SHeS sample when compared to the NRS mid-2019 population estimates. In particular, men and women under 45 were under-represented. Conversely, men and women 55 and over were over-represented in the sample. Again, this was accounted for in the weighting strategy. Tables 1.2-1.5
1.6.4 The sample profile
Compared with previous SHeS surveys, some variations in the profile of participants were observed, most likely due to the opt-in nature of participation in telephone survey.
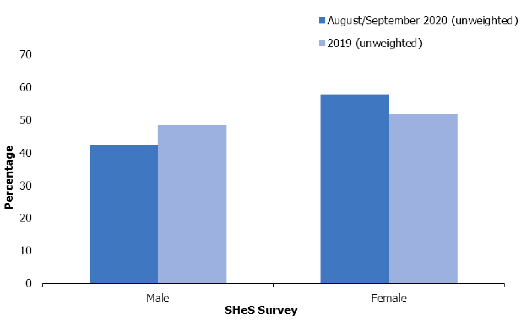
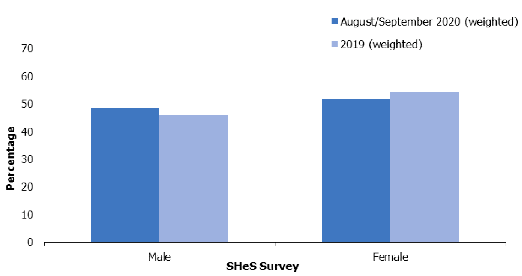
Figures 1 and 2 present the weighted and unweighted participant profile by sex. As shown in Figure 1, a higher proportion of participants were female in the 2020 telephone survey unweighted sample, compared with the 2019 unweighted sample, with the reverse evident for male participants. This was corrected for through weighting, as shown in Figure 2, bringing the two samples closer with regards to representation by sex (see section 1.7 for more on weighting for the telephone survey, which differs in some respects from the approaches used in previous SHeS surveys).
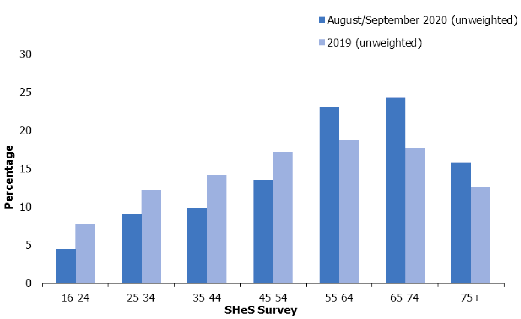
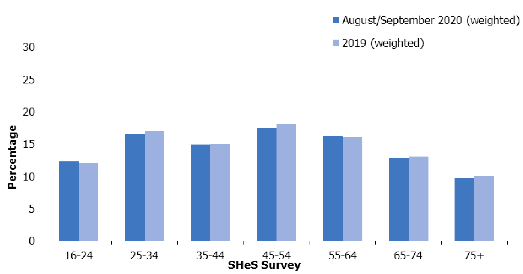
Figures 3 and 4 present the weighted and unweighted participant profile by age for the 2020 telephone survey and the 2019 survey. As shown in Figure 3, in the 2020 unweighted sample 16-54 year olds were under-represented and aged 55 and above over-represented, when compared with the 2019 unweighted sample. The age profiles within the two samples were more closely aligned after survey weighting was applied.
Contact
There is a problem
Thanks for your feedback