Publication - Statistics
Scotland's carbon footprint: 1998 - 2017
Estimates of Scotland's greenhouse gas emissions on a consumption basis.
Part of
Scotland's Carbon Footprint 1998 – 2017
Key points
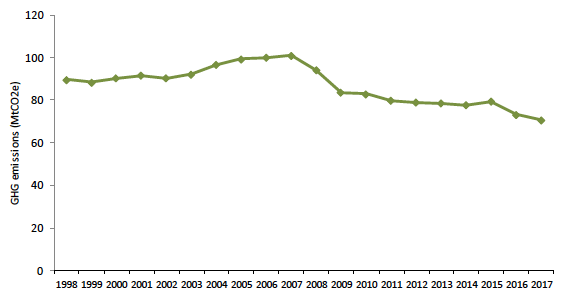
- Between 2016 and 2017, Scotland's carbon footprint (emissions from all greenhouse gases) decreased by 3.5 per cent to a record low of 70.7 million tonnes of carbon dioxide equivalent (MtCO2e).
- Between 1998 and 2017, Scotland's carbon footprint fell by 21.1 per cent, from 89.6 MtCO2e in 1998 to 70.7 MtCO2e in 2017.
- Scotland's carbon footprint rose from 1999 onwards to a peak of 101.1 MtCO2e in 2007 before falling sharply in the following years (coinciding with the recession) and has generally fallen gradually in more recent years. The overall reduction between the 2007 peak and 2017 is 30.0 per cent.
Contact
Email: lisa.lochran@gov.scot