Tackling child poverty delivery plan - annual progress report: annex b - cumulative impact assessment update
Annex b of the Tackling child poverty delivery plan: annual progress report 2022-23. It provides an updated assessment of the cumulative impact of a package of our policies on child poverty.
1. Introduction
In March 2022, the Scottish Government published a Cumulative Impact Assessment (CIA) to accompany the second Tackling Child Poverty Delivery Plan, 'Best Start, Bright Futures'.[1] The CIA set out projections for relative and absolute child poverty in 2023-24 and 2025-26, in addition to the estimated impact of Scottish Government policies, using the latest information available at the time[2]. This annex presents updated headline measures which take into account the latest economic forecasts, and policy announcements.
Significant developments have occurred since March 2022, relating primarily to the unfolding cost-of-living crisis. The macroeconomic outlook has deteriorated as inflation reached double digits, and the UK economy has only narrowly avoided a technical recession in the last quarter of 2022, with OBR anticipating output would fall in the first quarter of 2023[3], putting upward pressure on child poverty. Although policy interventions will mitigate some of the impacts by regulating prices and boosting incomes, the Office for Budget Responsibility (OBR) is still predicting the largest two-year fall in living standards since records began.
The largest revisions pertain to 2023-24, the year of the interim child poverty targets. As of March 2023, the OBR forecasts that consumer prices will have risen by almost 20% between 2019-20 and 2023-24, significantly faster than was previously anticipated in its October 2021 forecasts (10%). Over the same period, average hourly earnings are forecast to rise by 18%, significantly higher than the 13% in previous forecasts.[4]
Employment in 2023-24 in the latest OBR forecasts is now also expected to be slightly lower than was previously anticipated. However, sensitivity analysis indicates that unless the change was to be concentrated in a particular subgroup of the population, the size of this change in either direction is unlikely to have an effect on the headline measures.
The original cumulative impact assessment sets out the full details of our methodology.[5] As in the original analysis, we run two scenarios in each year: a 'baseline' (or 'policy') scenario, which represents our projection, and a 'counterfactual' scenario, which represents a hypothetical world in which certain Scottish Government policies did not exist. As previously noted the modelled policy package is not exhaustive due to limitations around what can be modelled. The difference between the two scenarios represents the impact of Scottish Government policies. The only significant modification to our approach in this update is that we are now able to project to 2026-27, whereas we previously projected only to 2025-26.
Results
1.1 Relative poverty
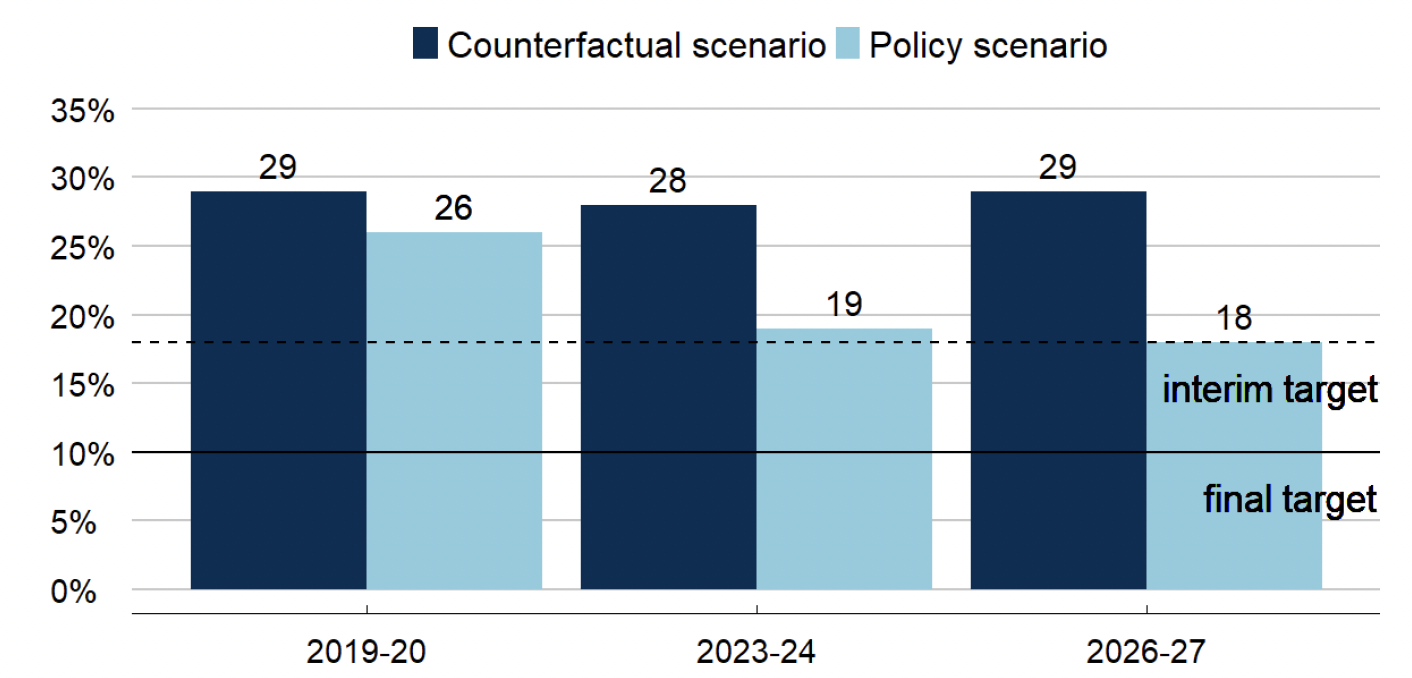
The latest statistics currently included in the modelling indicate that 26% of children in Scotland lived in relative poverty in 2019-20[6]. With up-to-date policies included, we project that the relative child poverty rate will fall to around 19% by 2023-24. Meanwhile, we estimate that the counterfactual poverty rate was around 29% in 2019-20, falling to 28% by 2023-24. Taking the difference between these scenarios, we estimate that the child poverty rate would have been around 3 percentage points higher in 2019-20 if the policy package had not been in place, with 20,000 more children living in poverty. This impact is projected to increase to 9 percentage points by 2023-24, meaning that Scottish Government policies are anticipated to be keeping around 90,000 children out of relative poverty.
The Scottish Government policy package looks similar to last year. The introduction and doubling of the Scottish Child Payment, followed by the further increase to £25 per child per week and it's expansion to under 16s, is still expected to contribute around a 5 percentage point reduction in relative poverty in 2023-24 as was previously set out in analysis accompanying the previous CIA[7]. Other policies coming into effect include mitigation of the Benefit Cap through Discretionary Housing Payments, the removal of income limits for Best Start Foods and the increase in the minimum levels of School Clothing Grant. Interactions between the policies in the package will also contribute to the cumulative impact. Since the previous publication the extension of universal Free School Meals to all primary school children has been postponed and there have been budget reductions for employability services, although neither of these changes should affect the 2023-24 projection. Devolved benefit amounts, with the exception of SCP for which uprating was brought forward to November 2022 and increased by a further 25%, have been increased by 10.1% from April 2023-24. Scottish Income tax changes that diverge from UK Government primarily affect the upper part of the income distribution and are hence of less relevance.
The deterioration in the macroeconomic situation means that the counterfactual poverty level has risen, this is in spite of UK Government policies such as the decision to uprate reserved benefits by inflation, and the cost of living payments which partially offset the increase. Cuts to National Insurance Contributions (NICs) and the removal of the Health and Social Care levy are anticipated to slightly increase relative poverty by raising the median income while increases in income tax and NICs through freezing the thresholds are unlikely to have much effect. The last UK Government budget announced changes to the Universal Credit childcare element, although it's impact along with that of a number of newly announced UK Government programmes aimed at getting different groups into work[8] will depend on the extent to which they encourage people to work more.
It remains worth bearing in mind that reductions in measured levels of relative poverty should be treated with caution – not only because they rely on macroeconomic forecasts and are sensitive to changes in the income distribution, both of which are uncertain, but also because they do not necessarily reflect improvements in living standards. While high rates of inflation will trigger an increase in benefit payments, in practice they will erode the living standards of many low-income households, particularly in the short term as most benefit rates are only uprated once per year based on the previous year's inflation rate.
These effects will not necessarily be reflected in the relative measure of poverty, which is primarily based on nominal income. Similarly, the lived experience of households in poverty may not materially improve if they exit poverty through a marginal increase in income which happens to nudge them over the poverty line, or indeed through changes elsewhere in the income distribution which shift the poverty line. By 2026-27, the child poverty rate has risen in the counterfactual scenario to reach 29%, while the policy scenario falls slightly to 18% - the impact of the package is therefore around 11 percentage points after rounding.
Figure 1 and Table 1 summarise the headline results of our analysis in terms of the estimated relative child poverty rates.
Source: Scottish Government analysis using UKMOD
| 2019-20 – | 2023-24 – interim targets | 2025/26 –horizon of model | 2026-27 –horizon of model | ||
|---|---|---|---|---|---|
| March 2022 | Counterfactual scenario | 28% | 27% | 26% | |
| Policy scenario | 26% | 17% | 17% | ||
| Estimated impact of policy package | 2 ppts | 10 ppts | 9 ppts | ||
| April 2023 | Counterfactual scenario | 29% | 28% | 29% | |
| Policy scenario | 26% | 19% | 18% | ||
| Estimated impact of policy package | 3 ppts | 9 ppts | 11 ppts | ||
| Interim target | 18% | ||||
1.2 Absolute poverty
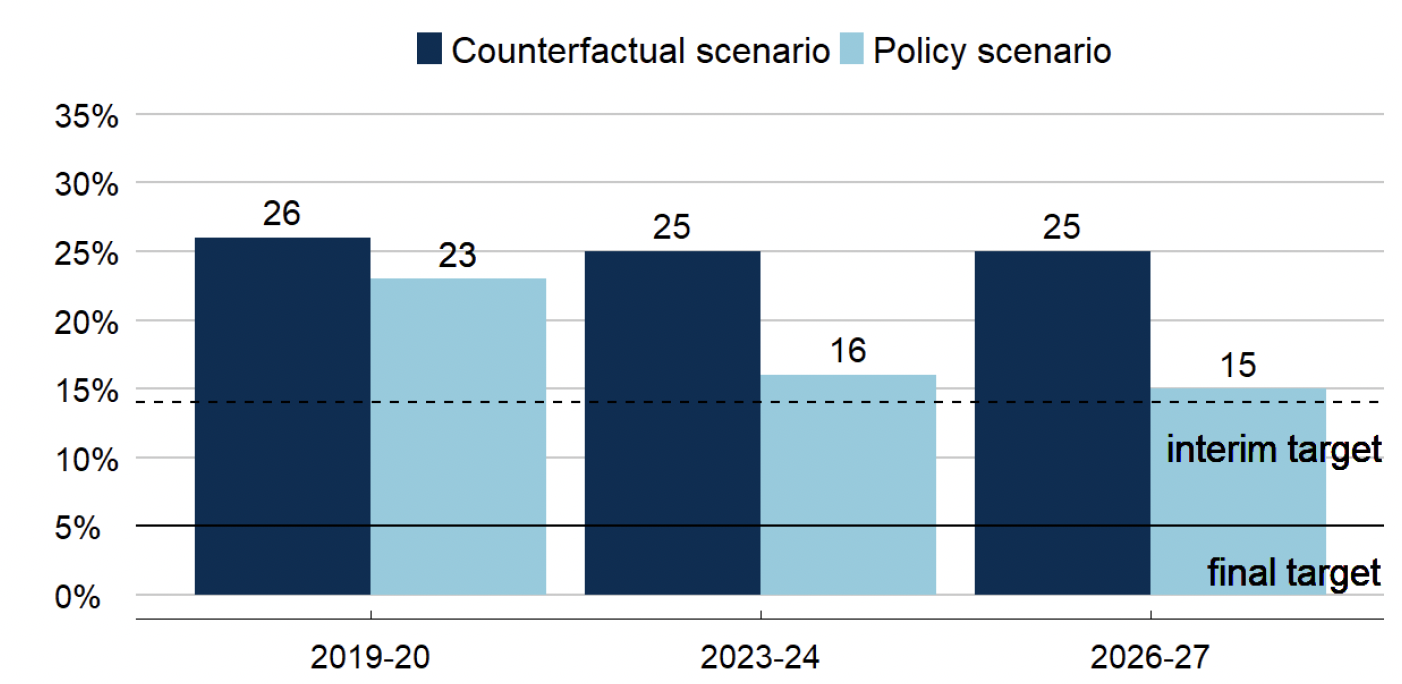
The latest statistics currently included in the modelling indicate that 23% of children in Scotland lived in absolute poverty in 2019-20[9]. Updated modelling indicates that the child poverty rate will fall to around 16% by 2023-24. Meanwhile, we estimate that the counterfactual poverty rate was 26% in 2019-20. Taking the difference between these scenarios, we can estimate that the child poverty rate would have been 3 percentage points higher in 2019-20 if the policy package had not been in place, with around 30,000 more children living in absolute poverty. This impact is projected to increase to 9 percentage points by 2023-24, meaning that Scottish Government policies could be keeping around 90,000 children out of absolute poverty each year.
High inflation has a more direct mechanical effect on the absolute poverty line – this is currently anticipated to result in its rising by almost 20% between 2019-20 and 2023-24 (this was 10% when 'Best Start, Bright Futures' was originally published). It was previously expected that the difference between the absolute and relative poverty rate would narrow, however, the relative poverty line is now expected to rise by a similar amount over the same period due to earnings growth being repeatedly revised upwards over successive forecasting rounds. In our model, nominal earnings growth tends to have a similar effect on relative poverty as inflation does on absolute poverty by boosting the income of the median household, although in reality this impact will depend on the distribution of earnings growth across the economy.
A notable result is that the relative measure of poverty has increased more than the absolute measure, compared to the original projections. This is because the absolute poverty line is further into the lower tail of the income distribution – similar sized movements in the absolute poverty line therefore result in relatively fewer people moving in or out of poverty.
As with relative child poverty, the outlook beyond 2023-24 becomes increasingly uncertain. By 2026-27, the absolute child poverty rate remains the same in the counterfactual scenario (25%), the policy scenario falls slightly to 15%. The impact of the package is therefore around 10 percentage points after rounding.
Figure 2 and Table 2 summarise our analysis on estimated absolute child poverty.
Source: Scottish Government analysis using UKMOD
| 2019-20 – | 2023-24 – interim targets | 2025/26 –horizon of model | 2026-27 –horizon of model | ||
|---|---|---|---|---|---|
| March 2022 | Counterfactual scenario | 25% | 26% | 25% | |
| Policy scenario | 23% | 16% | 16% | ||
| Estimated impact of policy package | 2 ppts | 10 ppts | 9 ppts | ||
| April 2023 | Counterfactual scenario | 26% | 25% | 25% | |
| Policy scenario | 23% | 16% | 15% | ||
| Estimated impact of policy package | 3 ppts | 9 ppts | 10 ppts | ||
| Interim target | 14% | ||||
Source: Scottish Government analysis using UKMOD
Contact
Email: tcpu@gov.scot