Planning decision times published
An Official Statistics Publication for Scotland.
Latest quarterly statistics show faster average decision times for local developments but slower average decision times for major developments compared to the previous quarter and previous year.
Statistics on quarterly planning performance in Scotland have been released today by Scotland’s Chief Statistician.
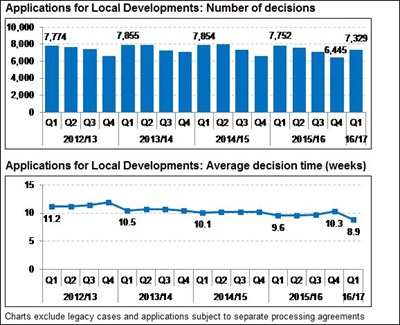
In quarter one (April to June) of 2016/17 there were 7,329 decisions made on local developments with an average decision time of 8.9 weeks. This was almost one and a half weeks quicker than the previous quarter (10.3 weeks), five days faster than the equivalent quarter in 2015/16 (9.6 weeks), and the quickest average decision time since the start of this data collection in quarter one of 2012/13.
For the 61 decisions made on major developments the average decision time was 39.3 weeks. This was 13 weeks slower than the previous quarter (26.3 weeks) and more than five weeks slower than the equivalent quarter in 2015/16 (34.2 weeks).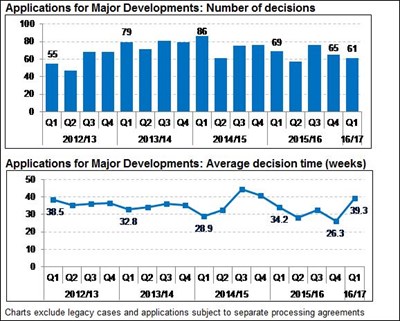
The average time figures quoted in this Statistical News Release exclude any applications concluded through the use of a processing agreement between the developer and the local authority, where an agreement on timescales for decisions can be made either at the beginning of the application process or at a later stage.
Key Findings for Quarter 1 (April to June) of 2016/17:
The overall average decision time for all local developments was quicker than the previous quarter, and the quickest average decision time since the start of this data collection in quarter one of 2012/13.
- Excluding one pre 3rd-August 2009 legacy case there were 7,329 decisions made on local applications decided during quarter one of 2016/17. The overall average decision time for these local developments was 8.9 weeks, quicker than the previous quarter (10.3 weeks), and the quickest average decision time since the start of this data collection in quarter one of 2012/13.
- For quarter one in 2016/17 the percentage of local development decisions made in less than two months was 78.0%, more than 9 percentage points higher than 68.9% in the previous quarter and the highest percentage since the start of this data collection in quarter one of 2012/13.
- In addition, there were 215 local developments decided in the first quarter of 2016/17 that had processing agreements in place, with almost 80% of these meeting agreed timescales.
The average decision time for local housing developments was quicker by more than two weeks compared to the previous quarter, and the quickest average decision time since the start of this data collection in quarter one of 2012/13.
- Excluding one pre 3rd-August 2009 legacy case there were 1,262 decisions made on local housing applications decided during quarter one of 2016/17. The average decision time for these local housing developments was 12.5 weeks, quicker by more than two weeks compared to the previous quarter (14.7 weeks) and the quickest average decision time since the start of this data collection in quarter one of 2012/13.
- In addition, there were 89 local housing applications that were subject to processing agreements with 66 (74%) of these meeting agreed timescales.
The overall average decision time for all major developments was thirteen weeks slower than the previous quarter and more than five weeks slower when compared to quarter one in 2015/16.
- There were a total of 61 major applications decided during the first quarter of 2016/17 and the average decision time was 39.3 weeks, thirteen weeks slower than the previous quarter (26.3 weeks) and more than five weeks slower when compared to quarter one in 2015/16 (34.2 weeks).
- In addition there were 30 major applications that were subject to processing agreements with half of these meeting agreed timescales
The average decision time for major housing developments was almost 18 weeks slower than the previous quarter, but quicker by more than 16 weeks compared to the equivalent quarter in the previous year.
- There were 30 decisions made on major housing developments decided during quarter one of 2015/16. The average decision time for these major housing developments was 48.3 weeks, slower by almost 18 weeks compared to the previous quarter (30.5 weeks) but quicker by more than 16 weeks compared to quarter one in 2015/16 (64.4 weeks).
- The average has been influenced by nine applications with a decision time of more than one year. 70% of the 30 major housing development applications were decided in a time that is quicker than the average. Average figures based on a small number of applications can be volatile when reporting quarterly trends.
- In addition, there were fifteen major housing applications that were subject to processing agreements with six (40%) of these meeting agreed timescales.
Local developments include applications for household extensions and loft conversions etc, smaller housing and retail developments, as well as various other types of local developments.
Major developments include applications for developments of 50 or more homes, as well as certain waste, water, transport and energy-related developments, larger retail developments, and other types of major developments.
The overall rate of approvals for all types of application was 94.0% in the period April to June 2016, a slight increase from the previous quarter (93.4%), and from the equivalent quarter one in 2015/16 (93.7%).
The figures released today were produced by independent statistical staff free from any political interference, in accordance with professional standards set out in the Code of Practice for Official Statistics.
The figures presented in this Statistical News Release exclude pre 3rd August 2009 cases and applications subject to separate processing agreements. Also, some applications exclude time periods in which particular delays have been outwith the control of planning authorities. Further information on these types of applications is available in the full statistical publication.
The full statistical publication along with excel web tables can be accessed at:
http://www.gov.scot/Topics/Statistics/Browse/Planning/Publications
The publication contains a range of quarterly trend information on average decision times by development types and information on delegation and approval rates, appeals and local reviews, and enforcement activity.
It is based on quarterly data collected by the Scottish Government from Local and Planning Authorities as part of the Planning Performance Framework, which came into effect from April 2012.
We would be grateful for your views on the format and content of this publication, or if you have any suggestions for improvements that we could build into future versions. Please provide us with feedback by emailing us at planstats@scotland.gsi.gov.uk
More information on the Planning Performance Framework is available at:
http://www.gov.scot/Topics/Built-Environment/planning/Roles/Scottish-Government/Service-Improvement