4% increase in housing supply in 2017-2018
A National Statistics Publication for Scotland.
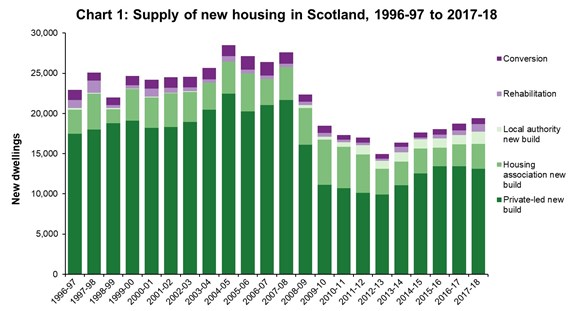
Total new housing supply in Scotland increased by 4% in 2017-18, to 19,428 new housing units, or 745 more homes than the previous year, the fifth consecutive annual increase in total housing supply, and the highest annual figure since 2008-09.
Two sets of housing statistics have been released today by Scotland’s Chief Statistician. The Annual Housing Statistics update includes information on total housing supply, local authority house sales, lettings and evictions, stock and vacancy rates, supported housing, housing lists, scheme of assistance and houses in multiple occupation. The Quarterly Housing Statistics update includes information on new build housing, affordable housing supply, and local authority right to buy sales. The affordable housing supply statistics are used to inform the Scottish Government target to deliver 50,000 affordable homes, including 35,000 homes for social rent, over the period 2016/17 to 2020/21, and reflect the number of affordable homes delivered that have received some form of government support through loans, grant or guarantees.
Key findings from the Annual Housing statistics update:
New housing supply: New housing supply (new build, refurbishment and net conversions) increased by 4% between 2016-17 and 2017-18, from 18,683 to 19,428 new homes.
Housing supply figures include private-led and social sector new builds, as well as conversions and rehabilitations. Housing association new builds increased by 382 homes (14%), local authority new builds increased by 381 homes (34%), and private-led new builds decreased by 325 homes (2%), whilst rehabilitations increased by 359 homes (60%) and net conversions decreased by 52 homes (7%).
New house building: In 2017-18, 17,731 new build homes were completed in Scotland, an increase of 438 homes (3%) on the 17,293 completions in the previous year, the fifth consecutive annual increase and the highest annual number of completions since 2008-09. During the same time-period the number of homes started decreased by 129 homes (1%) from 19,724 to 19,595. Housing association approvals fell by 235 homes (5%), and local authority starts dropped slightly by 13 homes (1%), whilst private-led starts increased by 119 homes (1%).
Affordable housing: (As previously reported on 12th June 2018): In 2017-18, there were 8,534 units completed through all Affordable Housing Supply Programme (AHSP) activity, an increase of 1,198 units (16%) on the previous year. Approvals increased by 1,401 units (14%) in the latest year to reach 11,677 in 2017-18, and starts increased by 1,261 units (14%) to reach 10,569. This activity represents the first two years in the target period to build 50,000 affordable homes, including 35,000 for social rent, over the five year period from 2016-17 to 2020-21.
Local authority housing stock: At 31st March 2018, there were 314,482 local authority dwellings in Scotland, a slight decrease of 334 units (0.1%) from the previous year.
Vacant stock: Local authorities reported 7,140 units of vacant stock at 31st March 2018, 976 units (16%) more than the 6,164 vacant units in the previous year, driven by increases in units awaiting demolition (an increase of 503 units), units part of a modernisation programme (an increase of 310 units), and vacant normal letting stock (an increase of 319 units). Vacant units used as temporary accommodation for the homeless fell by 7, and vacant units in low demand areas fell by 149 units..
Lettings: During 2017-18 there were 25,666 permanent lettings made, a slight decrease of 122 units (0.5%) compared to 25,788 lettings in the previous year. There were 10,805 lets to homeless households in 2017-18, which equates to 42% of all permanent lets by local authorities.
Evictions: Eviction actions against local authority tenants resulted in 1,460 evictions or abandoned dwellings in 2017-18 (1,023 evictions, 437 abandoned dwellings). This is up by 3%, or 39 actions of evictions or abandonments, on the 1,421 in the previous year.
Housing Lists: Household applications held on local authority or common housing register lists decreased by 3% or 4,346 households to 157,806 at March 2018, the tenth consecutive annual decrease.
Scheme of assistance: There were 9,049 scheme of assistance grants paid to householders in 2017-18, 1,434 grants (14%) fewer than in 2016-17. Spend on scheme of assistance grants totalled £29.8 million, around £2 million less than in 2016-17. The majority of grants in 2017-18 were for disabled adaptions; 5,599 grants totalling £21.9 million.
Houses in multiple occupation: In 2017-18, 9,025 applications were received in respect of the mandatory licensing scheme for houses in multiple occupation (including new applications and applications for renewal). At 31st March 2018 there were 15,671 licences in force, representing an increase of 2% over the previous year.
Key findings from the Quarterly Housing statistics update:
New Build Housing - All Sectors - up to end March 2018
- There were 4,532 new build homes completed between January and March 2018; a 2% increase (108 homes) on the same quarter in 2017. This brings the total for the year to end March 2018 to 17,731, up 3% (438 homes) compared to the 17,293 completed in the previous year.
- There were 6,146 new build homes started between January and March 2018, 2% less (104 homes) than the same quarter in 2017. This brings the total for the year to end March 2018 to 19,595 which is down by 1% (129 homes) compared to the 19,724 homes started in the previous year.
New Build Housing - Private-led Housing - up to end March 2018
- Between January and March 2018, 2,825 private sector led homes were completed; 16% fewer (532 homes) than the same quarter in 2017. This brings the total for the year to end March 2018 to 13,102 which is 2% less (325 homes) than the 13,427 completions in the previous year.
- There were 2,798 private sector led starts between January and March 2018, 8% less (246 homes) than the same quarter in 2017. This brings the total for the year ending March 2018 to 13,527 which is 1% more (119 homes) than the 13,408 starts in the previous year.
New Build Housing - Social Sector Housing (Housing Association and Local Authority combined) - up to end March 2018
- There were 1,707 social sector completions between January and March 2018; 60% more than the same quarter in 2017. This brings the total for the year to end March 2018 to 4,629. This is a 20% increase on the 3,866 social sector completions in the previous year.
- Meanwhile, 3,348 social sector homes were started between January and March 2018; 4% more than the same quarter in 2017. This brings the total for the year to end March 2018 to 6,068. This is a 4% decrease on the 6,316 social sector starts in the previous year.
- More up-to-date figures - up to end June 2018
Between April and June 2018, 934 social sector homes were completed (7% more than the 875 completions in the same quarter in 2017), and 1,158 were started (90% more than the same quarter in the previous year). This brings the total completions for the 12 months to end June 2018 to 4,688 (a 25% increase on the 3,764 social sector homes completed in the previous year). Total starts over the 12 months to end June 2018 are now at 6,617 (6% more than the 6,255 started in the previous year).
New Build Housing - Housing Association Homes - up to end March 2018
- There were 1,382 housing association completions between January and March 2018, 87% more than the 741 completions in the same quarter in 2017. This brings the total for the year to end March 2018 to 3,130, a 14% (382 homes) increase on the 2,748 completions over the previous year.
- There were 3,073 housing association approvals between January and March 2018; 5% more than the 2,917 approvals in the same quarter in the previous year. This brings the total for the year to end March 2018 to 4,710. This is a 5% (235 homes) decrease on the 4,945 approvals in the previous year.
More up-to-date figures - up to end June 2018
A total of 526 Housing Association homes were completed between April and June 2018, 2% (8 homes) more completions than in the same period in the previous year. This brings the total completions for the 12 months to end June 2018 to 3,138, which is an increase of 25% on the 2,520 homes completed in the previous year. A total of 563 Housing Association homes were approved between April and June 2018, 26% more than the 447 approvals in the same quarter in 2017. This brings the total approvals for the 12 months to end June 2018 to 4,826, a 4% decrease on the 5,041 approvals in the previous year.
New Build Housing - Local Authority Homes - up to end March 2018
- There were 325 local authority completions between January and March 2018, which is 1 home less than the number that were completed in the same quarter in 2017. This brings the total for year ending March 2018 to 1,499. This is a 34% (381 homes) increase on the 1,118 completions in the previous year.
- There were 275 local authority starts between January and March 2018; 5% fewer than in the same quarter in the previous year. This brings the total for year ending March 2018 to 1,358. This is a 1% (13 homes) decrease on the 1,371 starts in the previous year.
More up-to-date figures - up to end June 2018
Between April and June 2018, 408 local authority houses were completed (14% more than the same quarter in the previous year), and 595 were started (267% more than in the same quarter in the previous year). This brings the total completions for the year to end June 2018 to 1,550, which is 25% more than the previous year. Total starts for the 12 months to end June 2018 now stands at 1,791 which is an increase of 48% on the 1,214 local authority homes started in the previous year.
Affordable Housing Supply - up to end June 2018
- Affordable Housing Supply Programme (AHSP) statistics reflect the broader supply of affordable homes (i.e. for social rent, affordable rent and affordable home ownership) and include off-the-shelf purchases and rehabilitations as well as new builds.
- The latest statistics for the year to end June 2018 show that affordable housing supply completions have totalled 8,381, up 15% (1,122 homes) on the previous year. This includes increases in social rent completions (up by 14% or 616 homes) and affordable home ownership completions (up by 36% or 636 homes), and decreases in affordable rent completions (down 13% or 130 homes).
- There were 11,926 affordable housing approvals over the year up to end June 2018, up by 12% or 1,252 homes compared to the previous year. This includes increases affordable rent approvals (up by 59% or 951 homes), and affordable home ownership approvals (up by 31% or 580 homes), with a decrease in social rent approvals (down by 4% or 279 homes).
- There were 10,285 affordable houses started in the year to end June 2018, up by 3% or 346 homes compared to the previous year. This includes increases in affordable rent starts (up by 2% or 37 homes), and affordable home ownership starts (up by 26% or 457 homes), but decreases in social rent starts (down 2% or 148 homes).
Local Authority Right to Buy Sales - up to end March 2018
- The Right to Buy scheme closed to all new applicants on 31 July 2016, therefore there have been no Right to Buy applications made during the last 18 months (October 2016 to March 2018). Throughout the final year of the scheme (the year to end September 2016) there were 9,060 applications made, more than double the 3,890 applications that were made in the previous year to end September 2015. This increase is likely to have been because this was the last chance for social housing tenants with an entitlement to exercise their Right to Buy before the scheme closed.
- It can take a period of time for applications to be processed and for sales to be made, and therefore Right to Buy sales are still being recorded. In the latest available quarter, January to March 2018, there were 75 Right to Buy sales. It is expected that sales will continue to fall further in future quarters as the number of applications remaining in the system falls. As of March 2018, there were 142 Right to Buy applications still pending.
Background
Note that the new build starts figures quoted in this Statistical News Release contain information on approvals rather than starts for housing associations. This is because the data held on approvals for housing association new builds is considered to be a more robust measure than the data held on starts. An approval is the point in time at which Scottish Government funding is granted through the Affordable Housing Supply Programme. Further information on this is available in the explanatory document providing background information on the quarterly statistics.
The Affordable Housing Supply Programme statistics include off-the-shelf purchases and rehabilitations as well as new build.
- Social Rent includes Housing Association Rent, Council House Rent as well as Home Owner Support Fund Rent
- Affordable Rent includes Mid-Market Rent (MMR), National Housing Trust (NHT) Rent as well as other programmes such as the Empty Homes Loan Fund (EHLF) and Rural Homes for Rent (RHfR)
- Affordable Home Ownership includes Open Market Shared Equity (OMSE), New Supply Shared Equity (NSSE), Shared Ownership (LCHO) as well as other programmes such as Home Owner Support Fund Shared Equity.
The Housing Statistics for Scotland 2017: Annual Key Trends Summary, which presents information on new house building, public sector house sales, local authority lettings and evictions, stock and vacancy rates, supported housing, housing lists, scheme of assistance and houses in multiple occupation, can be found at this address: http://www.gov.scot/ISBN/9781787812307.
The Housing Statistics for Scotland Quarterly Update, containing details of new house building, the Affordable Housing Supply Programme and sales of social sector housing, can be found at this address: http://www.gov.scot/ISBN/9781787812314.
Background information including Excel tables and an explanatory note on the Quarterly Housing Statistics can be found in the Housing Statistics webpages.
Housing Association and most Local Authority led new build activity is funded through Scottish Government funding programmes. Several changes to these funding programmes in recent years have affected both the trends and seasonal quarterly pattern of new build approvals, so care should be taken when making comparisons over time. These same changes will also impact on the Affordable Housing Supply Programme.
The supply statistics break down new build construction activity into private-led and social sector starts and completions, with the social sector further broken down between local authority and registered social landlord (housing association). The figures are as recorded by Local Authority administrative systems and the Scottish Government Affordable Housing Supply Programme (AHSP) system. Private sector construction activity includes not only homes built for private sale but also some homes which are used in the affordable housing sector and self-build activity by local builders.
Official statistics are produced by professionally independent statistical staff – more information on the standards of official statistics in Scotland can be accessed at: http://www.gov.scot/Topics/Statistics/About.