Improving understanding of seabird bycatch in Scottish longline fisheries and exploring potential solutions
A Scottish Government funded study to improve knowledge and understanding of bycatch in the offshore longline fishery that targets hake in the United Kingdom and European Union waters, through new data analyses and discourse with industry.
Section 3: Estimating bycatch using sampling data
Ratio-based and model-based approaches were used to produce new bycatch estimates for northern fulmar. The model-based approach was also used to produce new estimates for great skua, great shearwater and northern gannet. The production of these new estimates is described below.
3.1 Revised ratio-based estimates
Preliminary estimates of bycatch in the longline fishery (Northridge et al.2020) indicated annual bycatch of about 4,500 northern fulmars, with confidence intervals running from two thousand to nine thousand. These initial estimates were derived from a very small sample size of 102 observed hauls from 14 trips undertaken between 2010 and 2018.
Revised estimates produced under this project for northern fulmar were generated using a larger dataset (an additional 63 hauls collected during 2018 and 2019) and a bootstrap by trip approach, rather than bootstrap by haul, as was done by Northridge et al.(2020). The revised approach also used fishing effort data from 2000 to 2019, rather than the two years fishing effort data (2016 and 2017) used in the Northridge et al.(2020) estimates. This new approach produced mortality estimates with wider confidence intervals than Northridge et al.(2020).
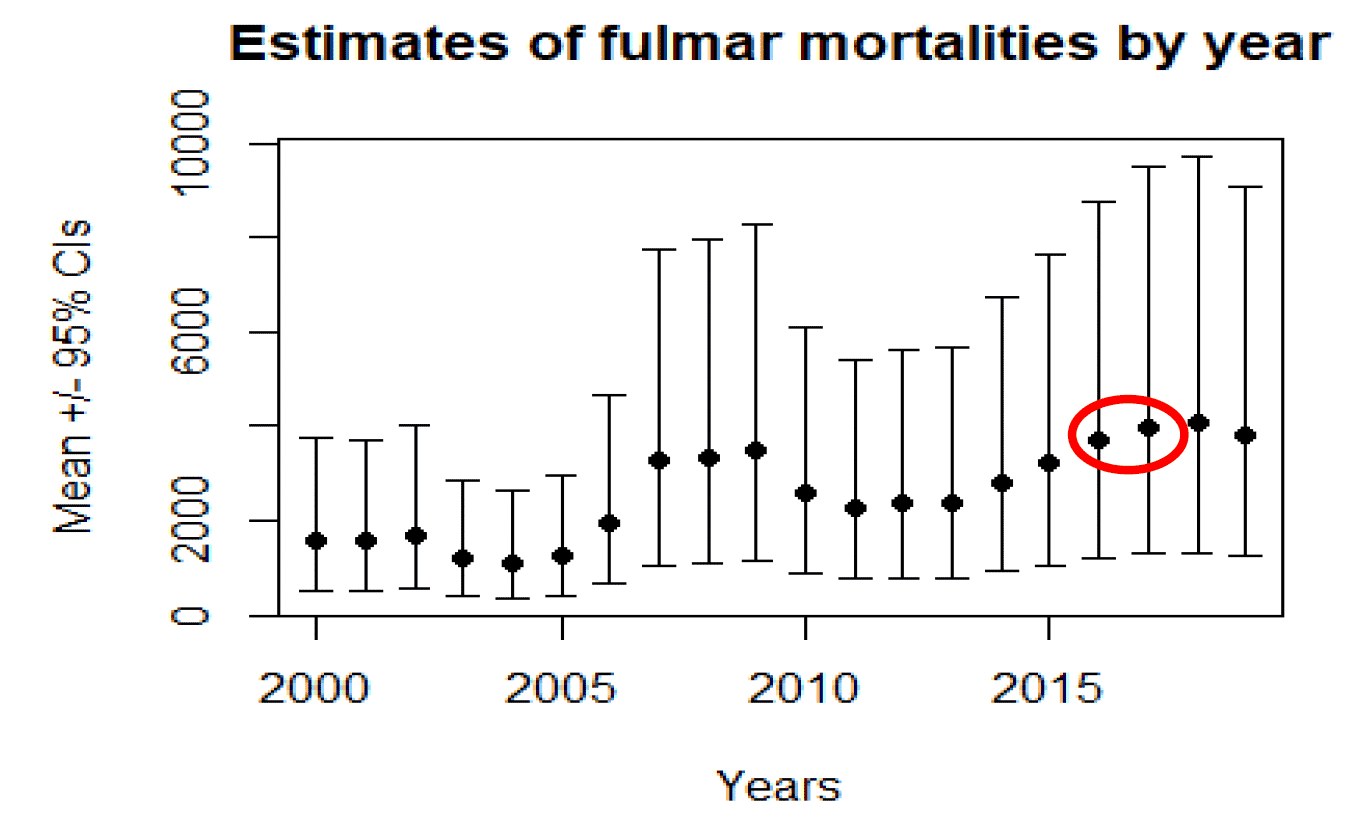
Over the 20-year period the revised estimates were produced for, estimated northern fulmar bycatch in the longline fishery ranged from about 1000 individuals per year to around 4000 individuals per year, and associated confidence intervals ranged from a few hundred individuals to close to ten thousand individuals per year (Figure 8). The revised estimates for the calendar years 2016 and 2017 specifically (as highlighted in Figure 8), of about 4000 fulmars per year are fairly similar to the preliminary estimates produced by Northridge et al.(2020) but the confidence intervals are wider.
3.2 Modelled bycatch estimates
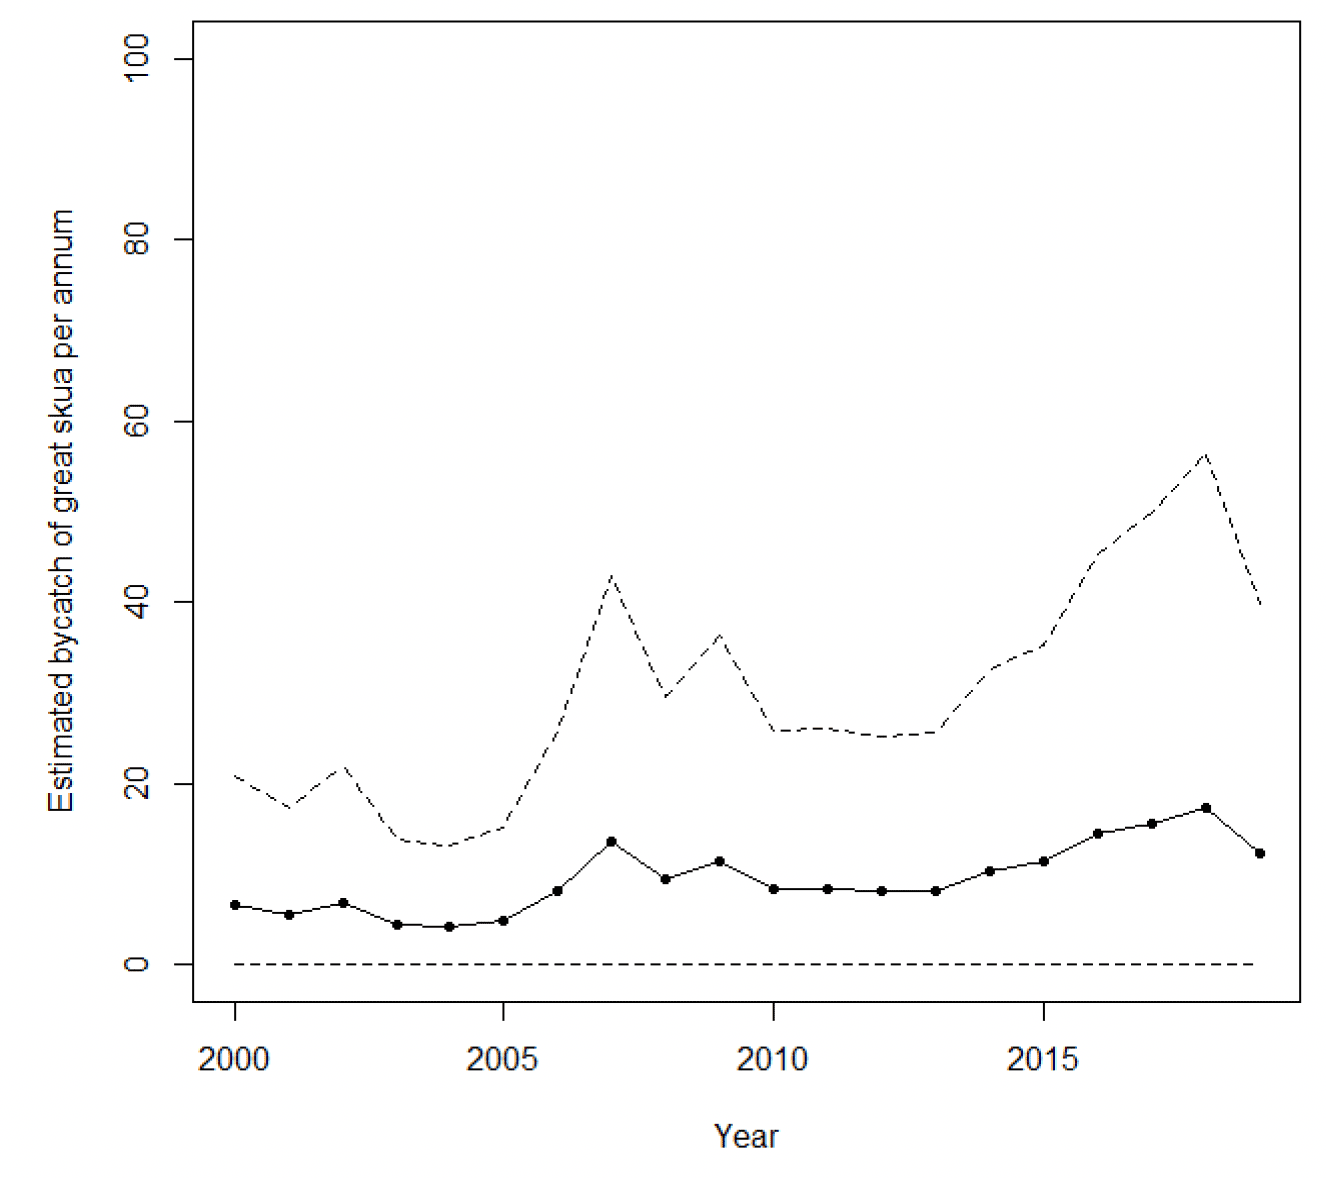
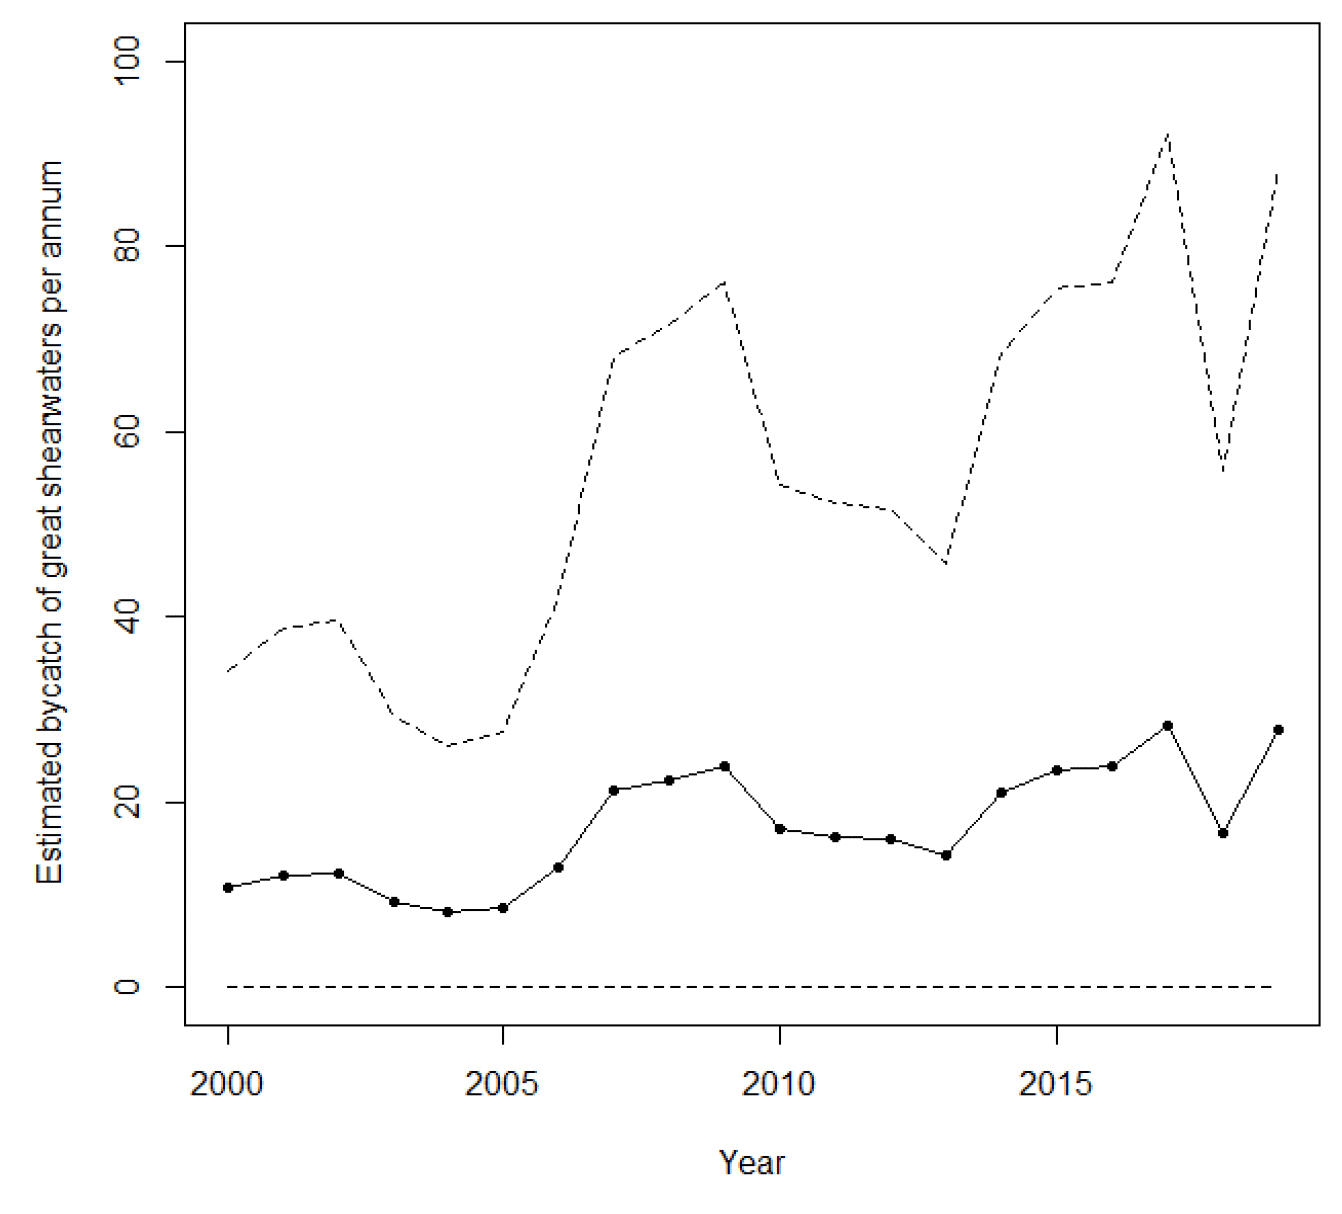
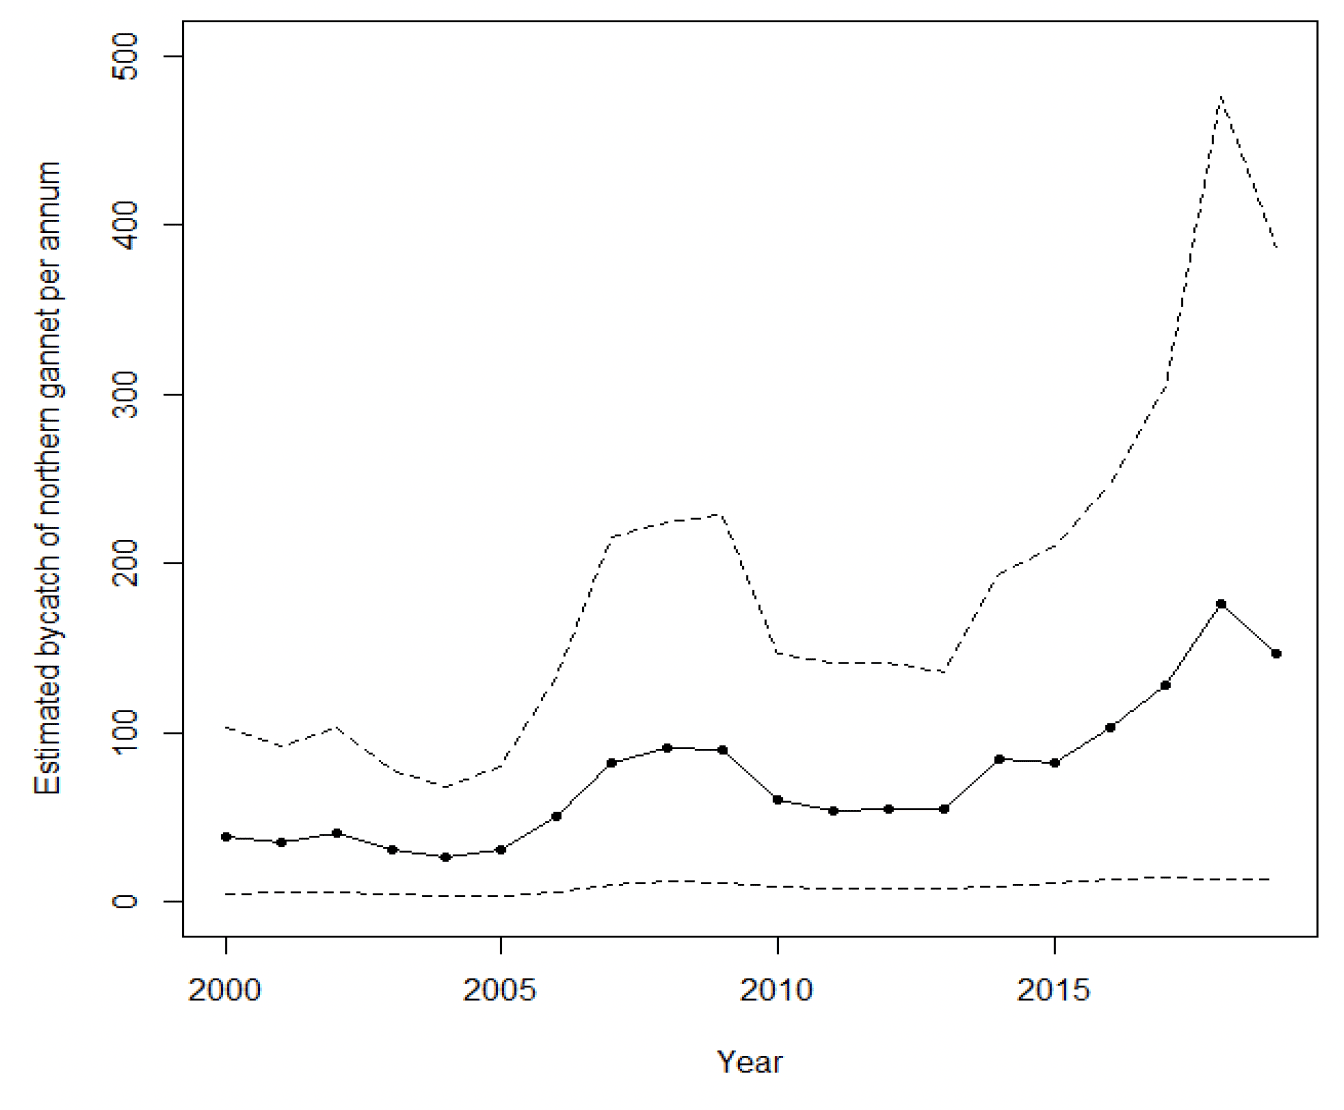
With additional observer data collected up to October 2021, a more detailed model driven approach to estimating bycatch mortality was also developed and is described below. In addition to northern fulmar, the modelling approach has enabled bycatch estimates to be produced for great skua, great shearwater and northern gannet, which were observed bycaught in small numbers.
3.2.1 Methods
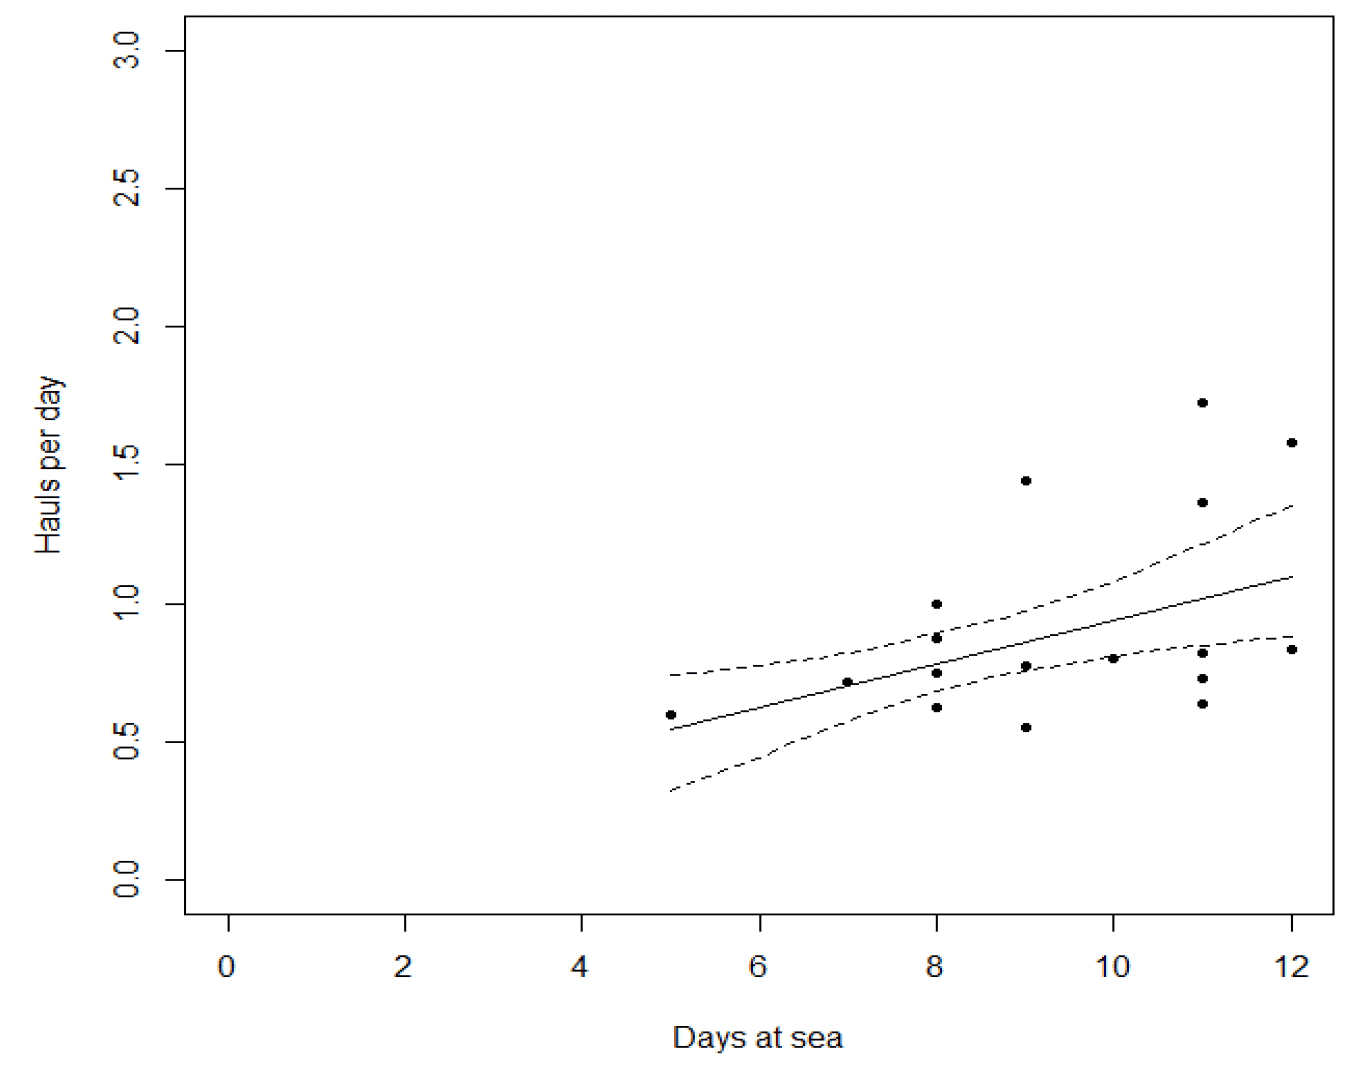
To produce estimates of bycatch across the entire longline fleet, the observed bycatch data were considered along with an estimate of the number of hauls per day at sea derived from the observed trips (n=23), which we assume are representative of the number of hauls per day in the wider fleet. In addition to the observed data, UK fleet effort summaries were used since 2000 to estimate fishing effort (days at sea) by ICES rectangle and year. There was a positive relationship between the number of hauls and trip length in the observer data (Figure 9), however this was not incorporated into the estimation, but instead the observed mean number of hauls per day was used to estimate the fleet effort in that metric.
With the mean observed bycatch per ICES rectangle by month, mean observed bycatch by month alone, mean observed bycatch by ICES rectangle alone and overall (across all rectangles and months) estimated, the estimation procedure was as follows:
For each year of effort,
- the relevant ICES rectangles were considered in turn.
- the number of hauls by the fleet was estimated from the number of days per rectangle.
- the number of bird catches for that ICES rectangle for that month was calculated given the number of hauls. If haul data for that ICES rectangle were not available, then the bycatch was taken for the mean of that month in the data. If month was not available, then bycatch per haul was estimated from the mean of the ICES rectangle over the surveyed trips and if neither month nor ICES square were available, overall bycatch per haul was considered. However, in the case of fulmars if data was missing mean bycatch per haul were taken from the predictions for the relevant latitude from the GAMM model.
- Sum bycatch for each relevant ICES rectangle in question
- Sum for year in question.
To obtain uncertainty around the estimates, the whole process was then repeated 1000 times as a non-parametric bootstrap, resampling with replacement the hauls per day data and the bycatch per haul data. Non-parametric bootstrap estimates were also obtained for the GAMM model by latitude predictions.
The method assumes no year effect except as mediated through changes in fishing effort which is justifiable given that a year effect was not found in the haul analysis.
3.2.2 Results
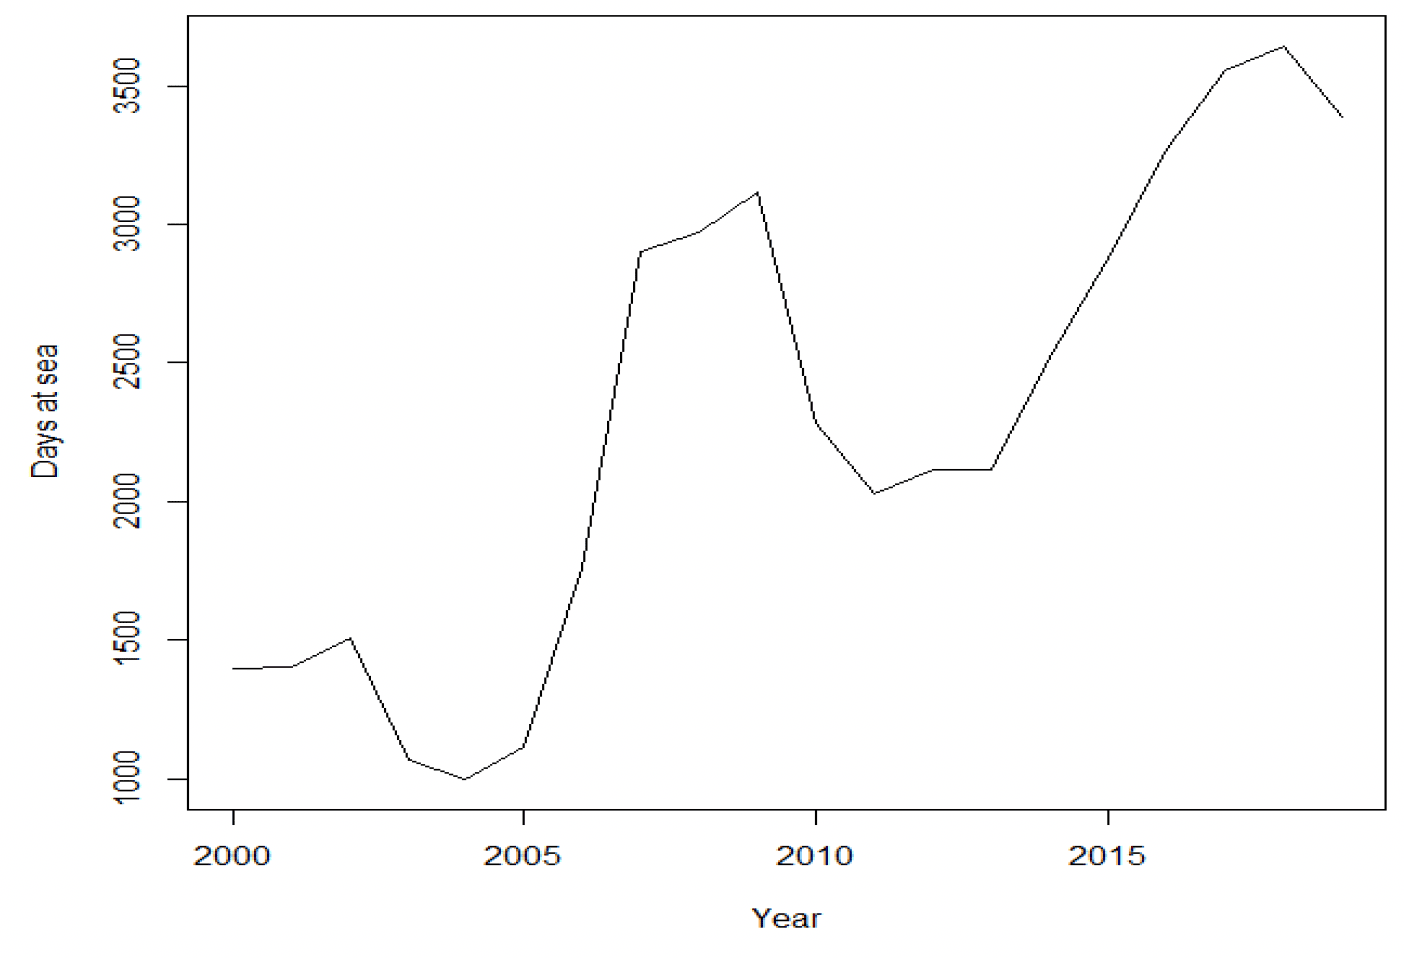
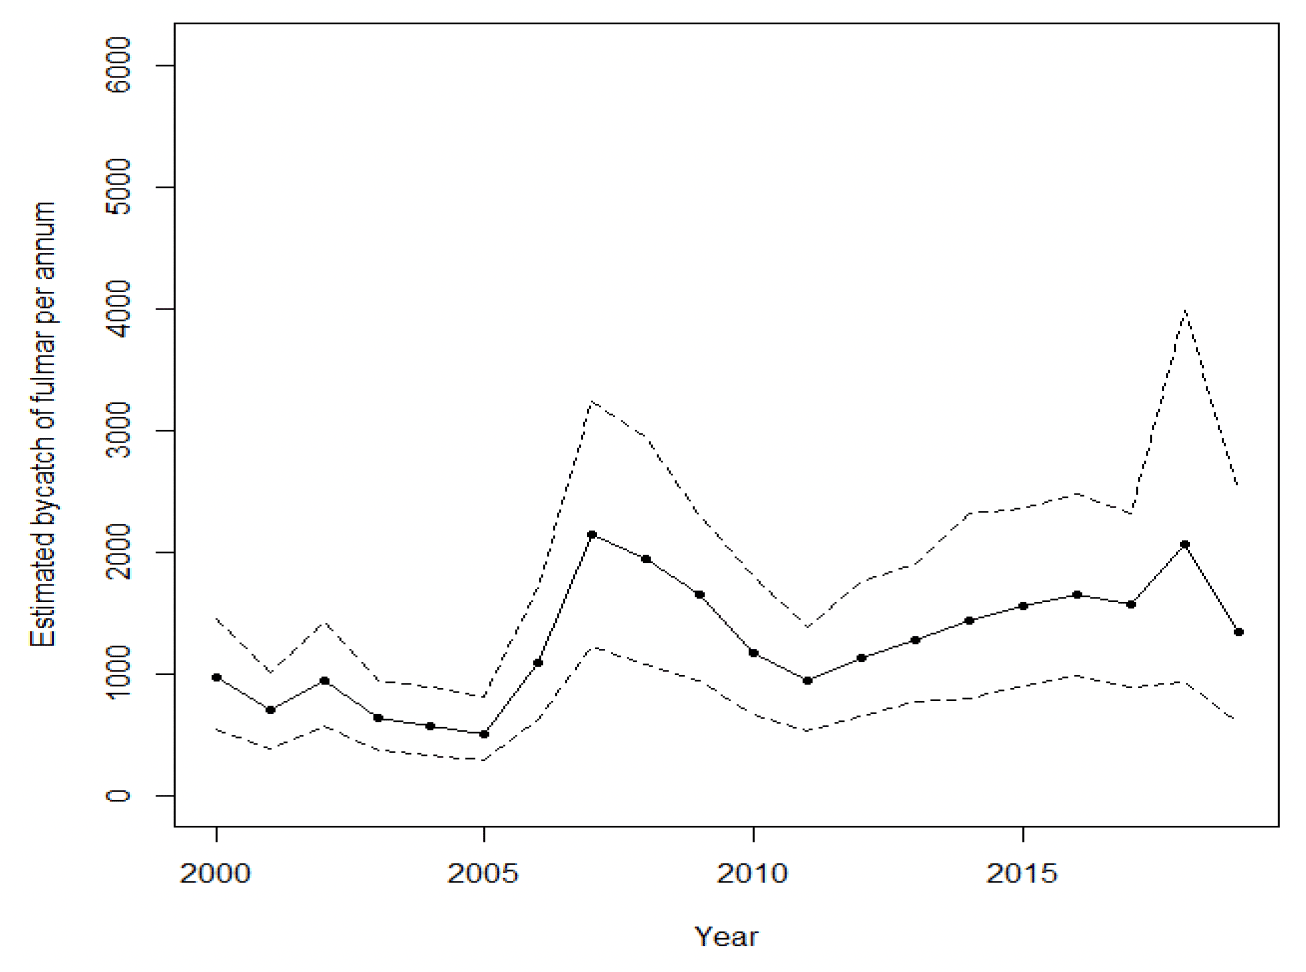
According to official fishing effort statistics, overall effort in the UK longline fleet has increased over the last two decades (Figure 10). The time series of bycatch estimates for fulmar, northern skua, great shearwater and northern gannet are given in Figures 11 to14. In every case there is an increase in bycatch over time which, under this analytical approach, is driven by the generally increasing trend in effort in the fishery.
Overall, these results suggest that:
1. Bycatch of seabirds in the fishery may have increased over the last two decades due to an increase in fishing effort.
2. Bycatch of great shearwaters and great skuas is less than one hundred individuals of each species per year, and most likely between ten and twenty individuals per year.
3. Bycatch of northern gannets is less than four hundred individuals per year and most likley about one hundred individuals per year.
4. Bycatch of northern fulmars is probably 1000-2000 individuals per year and in the most recent year (2019) is close to 1000, though confidence intervals remain wide and range from about five hundred to four thousand individuals per year.
3.3 Discussion
The apparent changes in fulmar bycatch estimates from those initially provided by Northridge et al.(2020), evident in the updated estimates described in Section 3.1 and Figure 8, and then in the most recent estimates produced using a modelling approach presented in Section 3.2 are a consequence of more refined spatial and temporal stratification, an increase in overall data availability, and – in the case of estimates generated using a modelling approach – improved estimation methodologies. These changes improved the reliability of the latest mortality estimates which are lower (and have wider confidence limits) than those produced by Northridge et al.(2020).
However, based on the findings from Section 2.2, the data on which these latest estimates are based are likely to be biased (as demonstrated in Figures 2 & 3) and are from just 201 sampled hauls across 23 trips spanning over a decade. By comparison, Melvin et al.(2019) used data from over 90,000 haul observations to examine seabird bycatch in Alaskan waters and Fangel et al.(2017) used data collected from 426 trips. Consequently, it is important that these latest results for the UK offshore longline fishery are viewed rationally and in the context of the underlying biases and low data levels.
Contact
Email: marine_species@gov.scot
There is a problem
Thanks for your feedback