Scottish Local Government Finance Statistics 2022-23
Annual publication providing a comprehensive overview of financial activity of Scottish local authorities in 2022-23 based on authorities' audited accounts (where available).
This document is part of a collection
2. Revenue Expenditure and Income
Revenue expenditure is the cost of delivering services each year and includes both service operating costs and overheads. These costs might include salaries, rent, building maintenance, supplies and services. The benefits from revenue expenditure are mainly received within the financial year. Revenue expenditure also includes costs that cannot be directly attributed to a service, such as the repayment of debt and where a local authority has used revenue resources to fund capital investment.
All local authorities are required to have a General Fund which is used to account for all revenue activity, except that relating to local authority housing. The General Fund is the principle revenue reserve of the local authority.
Where a council has housing stock, it is required to record expenditure and income relating to the direct provision of housing in their Housing Revenue Account (HRA). HRAs are generally self-financing, that is the income received is sufficient to cover expenditure incurred. Of the 32 councils, 26 have an HRA.
The Orkney County Council Act 1974 and the Zetland County Council Act 1974 require Orkney and Shetland to also hold a Harbour Account, a separate account and reserve fund specifically for harbour undertakings. Orkney and Shetland are also able to transfer money between their General Fund and their Harbour Accounts. For the purposes of this publication, expenditure and income relating to Harbour Accounts is included in General Fund figures unless otherwise stated.
Revenue expenditure is principally funded through service income and general funding – further detail on these sources of funding is provided in Chapters 2.1.4 and 2.3 respectively. Any deficit (+) in a local authority’s revenue account is met from their reserves, and any surplus (-) is added to a local authority’s reserves and carried forward to the next year. Chapter 2.4 provides more detail on the movement in General Fund and HRA reserves in 2022-23.
2.1 Expenditure and Income on Services
Net Revenue Expenditure, also known as the net cost of services, is the element of service expenditure that is funded by general funding or reserves. It is calculated as gross service expenditure minus gross service income. As shown in Table 2.1, the net revenue expenditure on local authority services, including HRA, was £12,951 million in 2022-23. This is an increase in net revenue expenditure of £1,201 million, or 10.2 per cent, on 2021-22.
The increase in net revenue expenditure figure partly reflects the impact of high inflation on the cost to local authorities of providing services. For context, the GDP deflator, which can be viewed as a measure of general inflation in the domestic economy, was 6.80 per cent higher in 2022-23 when compared to 2021-22[2].
| Category | General Fund | HRA | Total |
|---|---|---|---|
| Gross Service Expenditure | 22,565 | 826 | 23,391 |
| Gross Service Income | 9,076 | 1,364 | 10,440 |
| Net Revenue Expenditure | 13,489 | -538 | 12,951 |
Source: LFR 00
2.1.1 Net Revenue Expenditure by Service
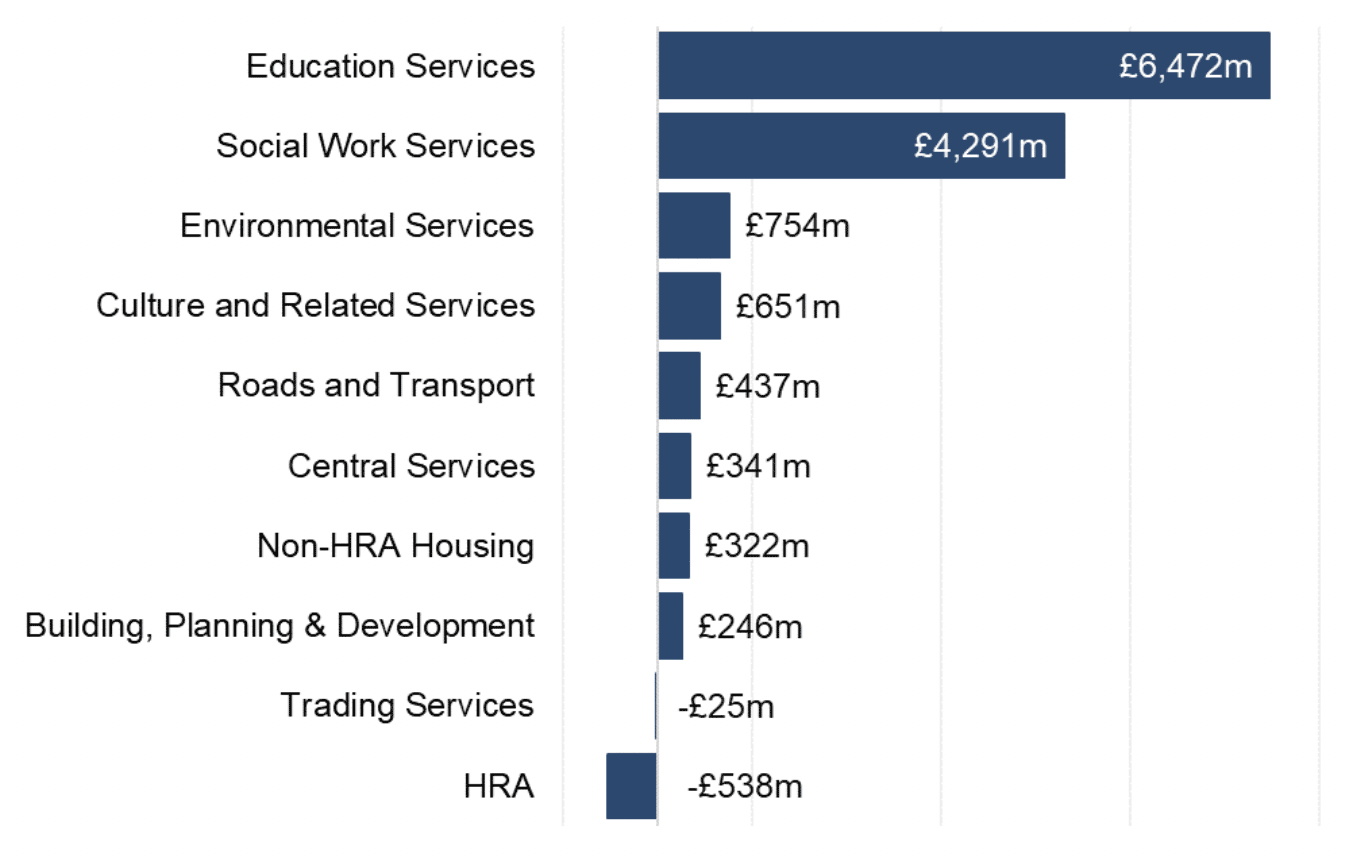
Chart 2.1 shows net revenue expenditure on services in Scotland in 2022-23. Education has the highest net revenue expenditure at £6,472 million followed by Social Work which has a net revenue expenditure of £4,291 million.
Source: LFR 00
Table 2.2 shows how net revenue expenditure by service has changed between 2018-19 and 2022-23.
| Service | 2018-19 | 2019-20 | 2020-21 | 2021-22 | 2022-23 | % change between 2021-22 & 2022-23 |
|---|---|---|---|---|---|---|
| Education | 5,054 | 5,330 | 5,524 | 5,867 | 6,472 | 10.3% |
| Culture & Related Services | 575 | 554 | 582 | 592 | 651 | 9.9% |
| Social Work | 3,312 | 3,458 | 3,540 | 3,818 | 4,291 | 12.4% |
| Roads & Transport | 384 | 382 | 458 | 404 | 437 | 8.0% |
| Environmental Services | 678 | 684 | 726 | 719 | 754 | 4.8% |
| Building, Planning & Development | 206 | 190 | 219 | 250 | 246 | -1.6% |
| Central Services | 346 | 783 | 387 | 363 | 341 | -6.1% |
| Non-HRA Housing | 254 | 258 | 272 | 291 | 322 | 10.7% |
| Trading Services | -35 | -36 | -29 | -29 | -25 | -13.1% |
| General Fund Net Revenue Expenditure | 10,774 | 11,604 | 11,679 | 12,277 | 13,489 | 9.9% |
| HRA | -524 | -527 | -571 | -527 | -538 | 2.1% |
| Total Net Revenue Expenditure | 10,250 | 11,077 | 11,108 | 11,750 | 12,951 | 10.2% |
Source: LFR 00
Net revenue expenditure on Education has increased by 10.3 per cent, or £605 million, in 2022-23. This is driven by increases in net expenditure for Pre-Primary, Primary and Secondary Schools, which have increased by 25.1 per cent, 8.6 per cent and 8.3 per cent, or £96 million, £204 million and £193 million, respectively. Net revenue expenditure on special education increased by £93 million (13.6 per cent). Community Learning increased by £15 million (15.9 per cent).
Culture and Related Services saw an increase of 9.9 per cent, or £59 million, in net revenue expenditure in 2022-23. The main underlying changes were an increase in net expenditure on Sports Facilities of £14 million (8.0 per cent), and on Community Parks and Open Spaces of £14 million (11.0 per cent).
Net revenue expenditure on Social Work increased by 12.4 per cent, or £473 million, in 2022-23. Much of this increase is accounted for by Integrated Joint Boards (IJBs). Councils’ collectively transferred £447 million more funds to IJBs in 2022-23, compared to 2021-22. This resulted in an increase in net revenue for IJBs of £447 million.
Net revenue expenditure on Roads & Transport has increased by 8 per cent, or £32 million, in 2022-23. Net revenue expenditure on parking services decreased by £12 million (41.9 per cent) as a result of increased parking income. Net revenue expenditure on Roads: Winter Maintenance increased by £17 million (26.2 per cent). Roads: Other Maintenance increased by £18 million (12.2 per cent).
Environmental Services saw an increase of 4.8 per cent, or £34 million, in net revenue expenditure in 2022-23. Of this increase, £15 million related to Waste Management.
Building, Planning & Development saw a decrease of 1.6 per cent, or £4 million, in net revenue expenditure in 2022-23, compared to 2021-22. This was the result of gross service expenditure increasing by £21 million over the year, but gross service income increasing more (by £25 million), resulting in the £4 million decrease.
Net revenue expenditure on Central Services decreased by 6.1 per cent, or £22 million, between 2021-22 and 2022-23.
Net revenue expenditure on Non-HRA Housing has increased by 10.7 per cent, or £31 million, in 2022-23.
HRA and Trading Services both have negative net revenue expenditure, which means that the service income received for these services was more than the expenditure incurred to provide these services. As such, negative net revenue expenditure can be considered as net income. For 2022-23, net expenditure for Trading Services decreased by 13.1 per cent to negative £25 million (it was negative £29 million in 2021-22). Net expenditure for HRA has been decreasing – that is, the overall net income that local authorities have received from their HRA has increased.
2.1.2 General Fund Net Revenue Expenditure by Council
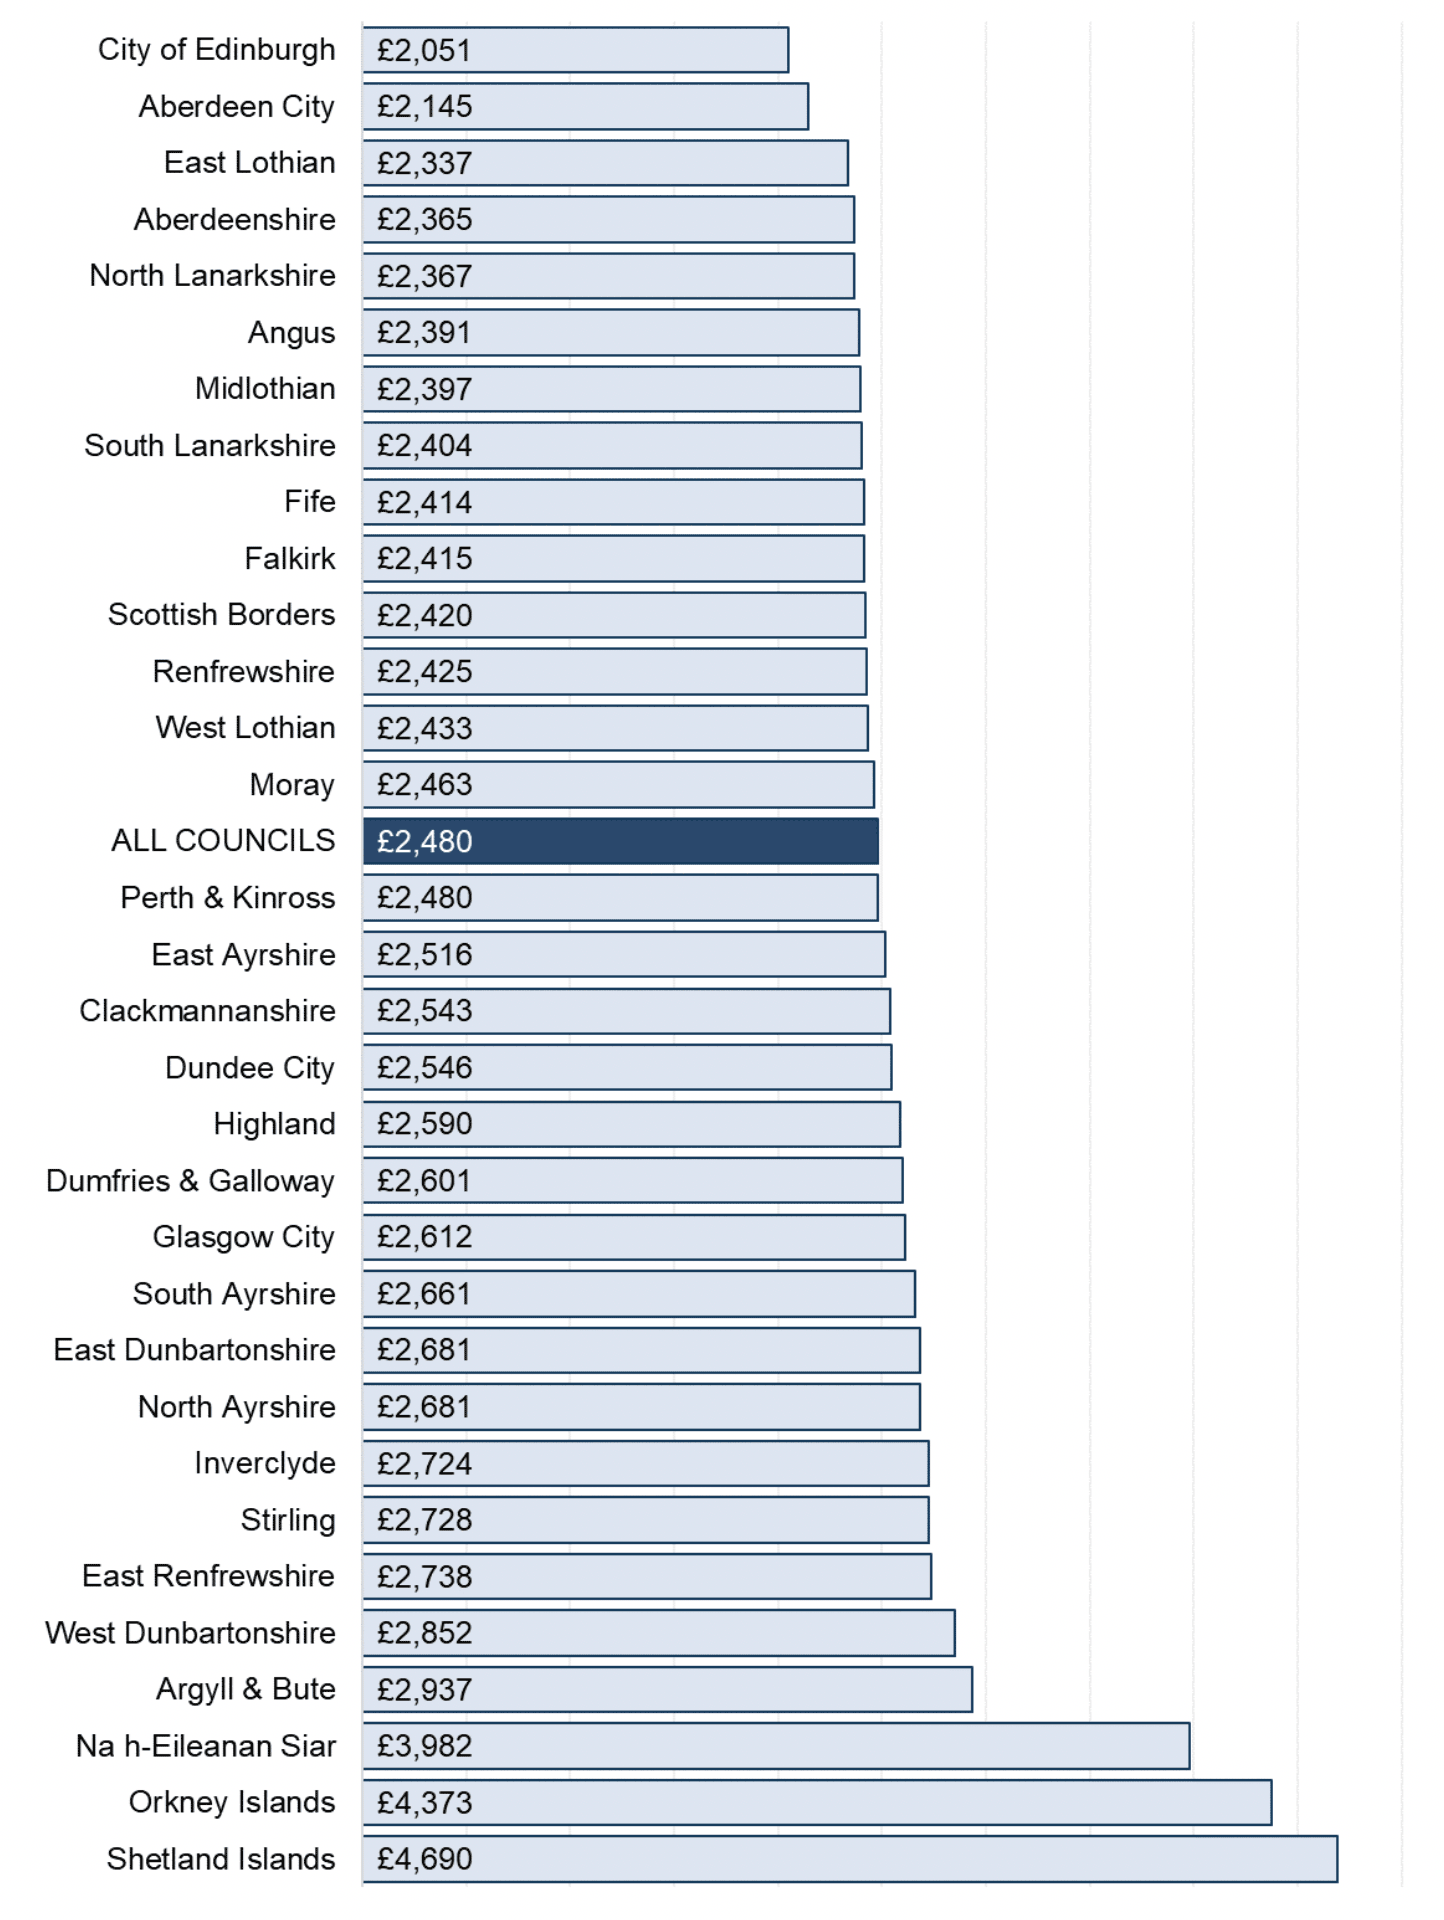
Chart 2.2 shows net revenue expenditure on General Fund services per person by council. In 2022-23, councils spent on average £2,480 per person, an increase from £2,246 per person in 2021-22. Spend per person varied across councils with island authorities having the highest spend per person.
Source: LFR 00, Scotland’s Census 2022
2.1.3 Gross Service Expenditure
Gross Service Expenditure is the total expenditure on local authority services within a financial year, adjusted for any intra / inter-authority transfers. In 2022-23, gross service expenditure was £23,391 million, an increase of 8.3 per cent, or £1,792 million, from 2021-22. Table 2.3 shows gross service expenditure by type of expenditure from 2018-19 to 2022-23.
| Expenditure Type | 2018-19 | 2019-20 | 2020-21 | 2021-22 | 2022-23 | % change between 2021-22 & 2022-23 |
|---|---|---|---|---|---|---|
| Employee Costs | 7,196 | 8,259 | 8,191 | 8,611 | 9,306 | 8.1% |
| Operating Costs | 7,467 | 7,562 | 8,066 | 8,400 | 9,046 | 7.7% |
| Transfer Payments | 4,743 | 4,771 | 4,724 | 5,026 | 5,432 | 8.1% |
| Support Services | 735 | 728 | 743 | 785 | 832 | 5.9% |
| Adjustment for Intra / Inter Authority Transfers | -1,275 | -1,227 | -1,253 | -1,223 | -1,224 | 0.1% |
| Gross Service Expenditure | 18,866 | 20,094 | 20,471 | 21,599 | 23,391 | 8.3% |
Source: LFR 00
In 2022-23, employee costs were the largest element of gross service expenditure, accounting for £9,306 million. These costs relate to salaries and wages, national insurance and superannuation contributions, cash allowances paid to employees, redundancy and severance payments and any other costs relating to employees. Employee costs in 2022-23 have increased by 8.1 per cent, or £694 million, from 2021-22. Employee costs have increased by 29.3 per cent, or £2,109 million, over the last five years.
Operating costs relate to costs for premises, transport, supplies and services, as well as payments made to third parties. In 2022-23, these accounted for £9,046 million of gross expenditure – an increase of 7.7 per cent, or £646 million, from 2021-22. This increase predominantly relates to an increase in payments to third parties.
Transfer payments accounted for £5,432 million of gross service expenditure in 2022-23, an increase of 8.1 per cent, or £406 million, from 2021-22. This expenditure relates to payments for which no goods or services are received in return by the local authority, including payment of Housing Benefit and transfers to IJBs.
Support services costs are the smallest component of gross service expenditure, accounting for only £832 million. This is an increase of 5.9 per cent, or £47 million, from 2021-22. These are costs that are paid for services that support the provision of services to the public, such as IT, Human Resources, Legal services, Procurement services and Corporate services.
An adjustment for intra / inter-authority transfers of -£1,224 million has been made to the aggregate gross service expenditure figure. This is to prevent double counting of expenditure caused by transfers between different services within an authority and between different local authorities. The adjustment removes the total recharge income from other services, contributions from other local authorities and requisition income for VJBs and RTPs. Following the adjustment, expenditure is only reported against the authority or service area that commissioned the service.
Chart 2.3 shows the breakdown of gross service expenditure by service and by expenditure type. Education has a higher proportion of employee costs than other services – this is due to the higher number of staff employed within Education, in particular teachers. Social Work and Non-HRA Housing have high proportions of transfer payments which relates to amounts transferred to IJBs and the payment of Housing Benefits respectively. Other has the largest adjustment for intra / inter authority transfers which is due to Central Services and Trading Services having particularly high amounts of recharge income from other services.
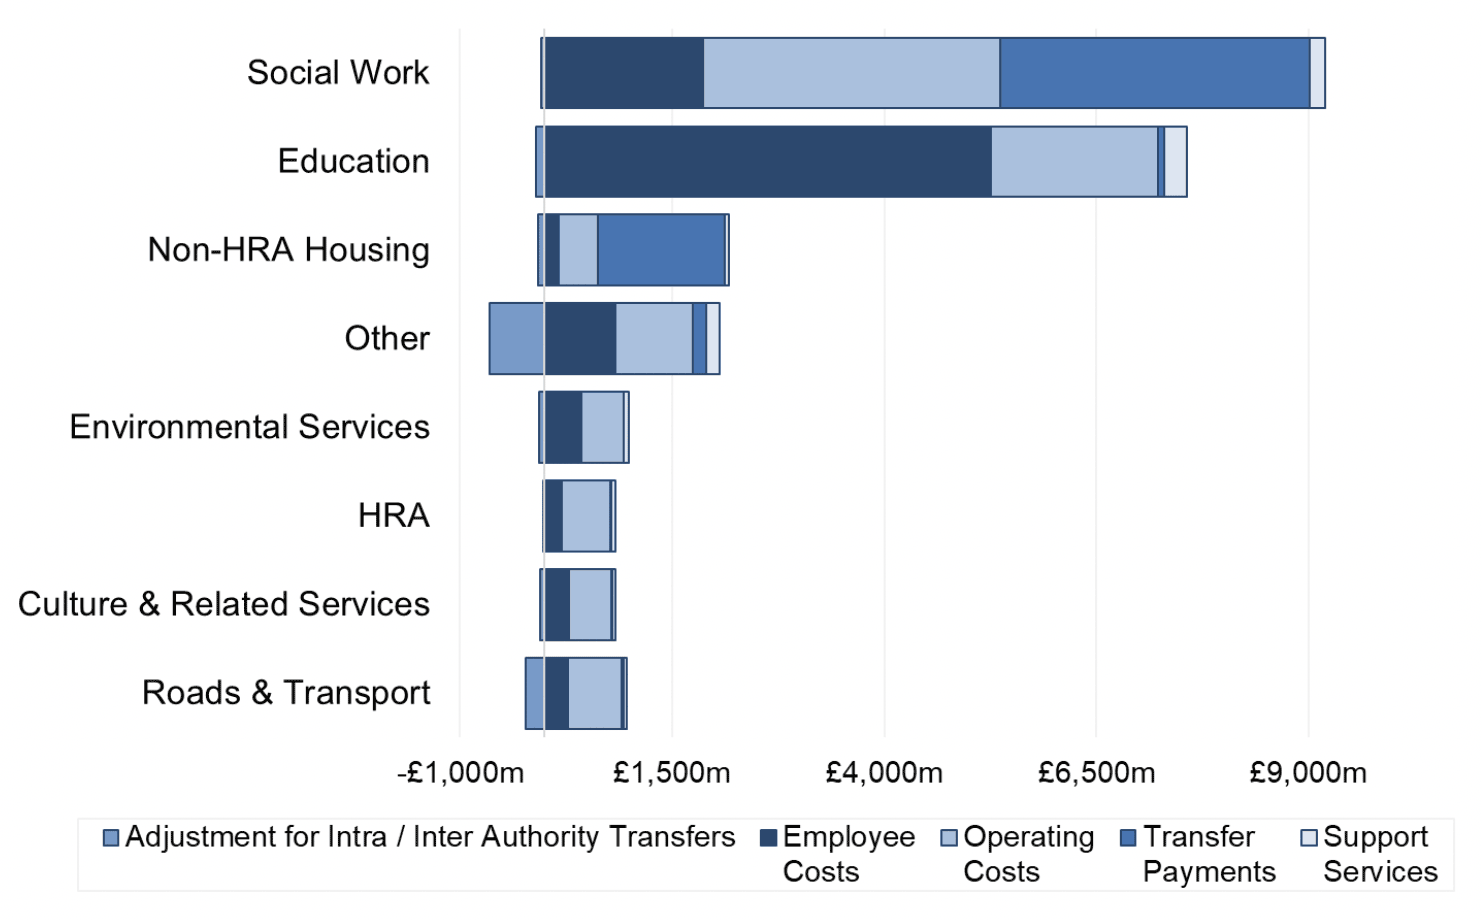
Please note that ‘Other’ consists of Building, Planning & Development Services, Central Services and Trading Services.
Source: LFR 00
2.1.4 Gross Service Income
Gross Service Income is the total income a local authority receives directly in relation to services they provide. In 2022-23, local authorities received £10,440 million in service income, an increase of 6.0 per cent, or £591 million, from 2021-22.
Local authorities receive service income from a variety of sources. Table 2.4 shows gross service income by type of income from 2018-19 to 2022-23.
| Income Type | 2018-19 | 2019-20 | 2020-21 | 2021-22 | 2022-23 | % change between 2021-22 & 2022-23 |
|---|---|---|---|---|---|---|
| Government Grants | 2,380 | 2,559 | 2,866 | 2,884 | 2,857 | -1.0% |
| Other Grants, Reimbursements and Contributions | 3,638 | 3,772 | 4,003 | 4,249 | 4,676 | 10.1% |
| Customer and Client Receipts | 2,598 | 2,685 | 2,494 | 2,715 | 2,907 | 7.1% |
| Gross Service Income | 8,616 | 9,016 | 9,363 | 9,849 | 10,440 | 6.0% |
Source: LFR 00
Government grants relates to grants local authorities receive to support specific services from either the Scottish or UK Governments, including Ring-Fenced Revenue Grants (RFRGs) and grants from the Department for Work & Pensions (DWP) for Housing Benefit payments. These figures will reflect the amount of grants used in the year specified – this may not match the amount of grants local authorities received in that year. This category does not include General Revenue Grant (GRG) as that is not provided to local authorities to fund a specific service. In 2022-23, government grants accounted for £2,857 million of service income, a decrease of 1.0 per cent, or £28 million, from 2021-22.
Other grants, reimbursements and contributions includes contributions from NHS Boards and income from IJBs to commission social care services. This accounted for £4,676 million of service income in 2022-23 – an increase of 10.1 per cent, or £427 million, from 2021-22.
Customer and client receipts is income local authorities have received for sales, rents, fees and charges for services they provide. In 2022-23, this accounted for £2,907 million of service income, an increase of 7.1 per cent, or £192 million, from 2021-22.
Chart 2.4 shows the breakdown of gross service income by service and income type. Social Work has the largest amount of service income, the majority of which is from other grants, reimbursements and contributions. This relates to amounts received from IJBs to commission social care services, as well as contributions received from NHS Boards.
Both Non-HRA Housing and Education have high proportions of service income from government grants. For Non-HRA Housing, this relates to grants from the DWP to fund Housing Benefit payments. For Education, this amount reflects various Education RFRGs that local authorities received from Scottish Government.
Service income for the HRA is almost entirely made up of customer and client receipts which predominantly relates to rent payments received.
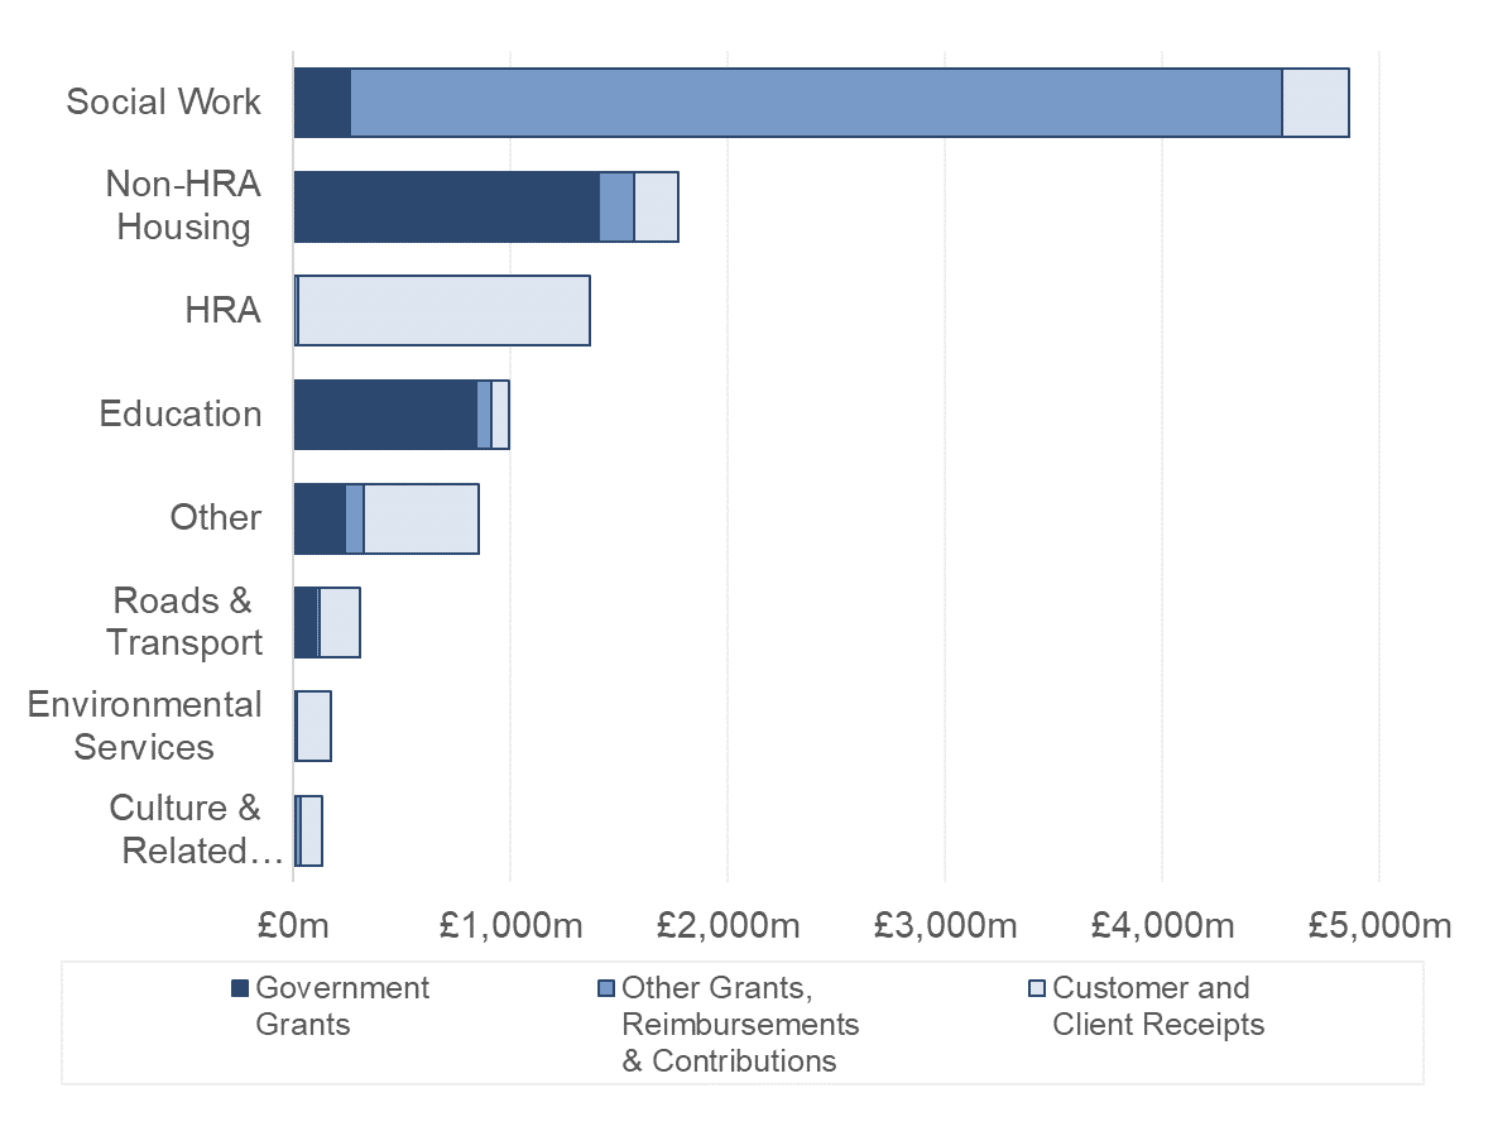
Please note that ‘Other’ consists of Building, Planning & Development Services, Central Services and Trading Services.
Source: LFR 00
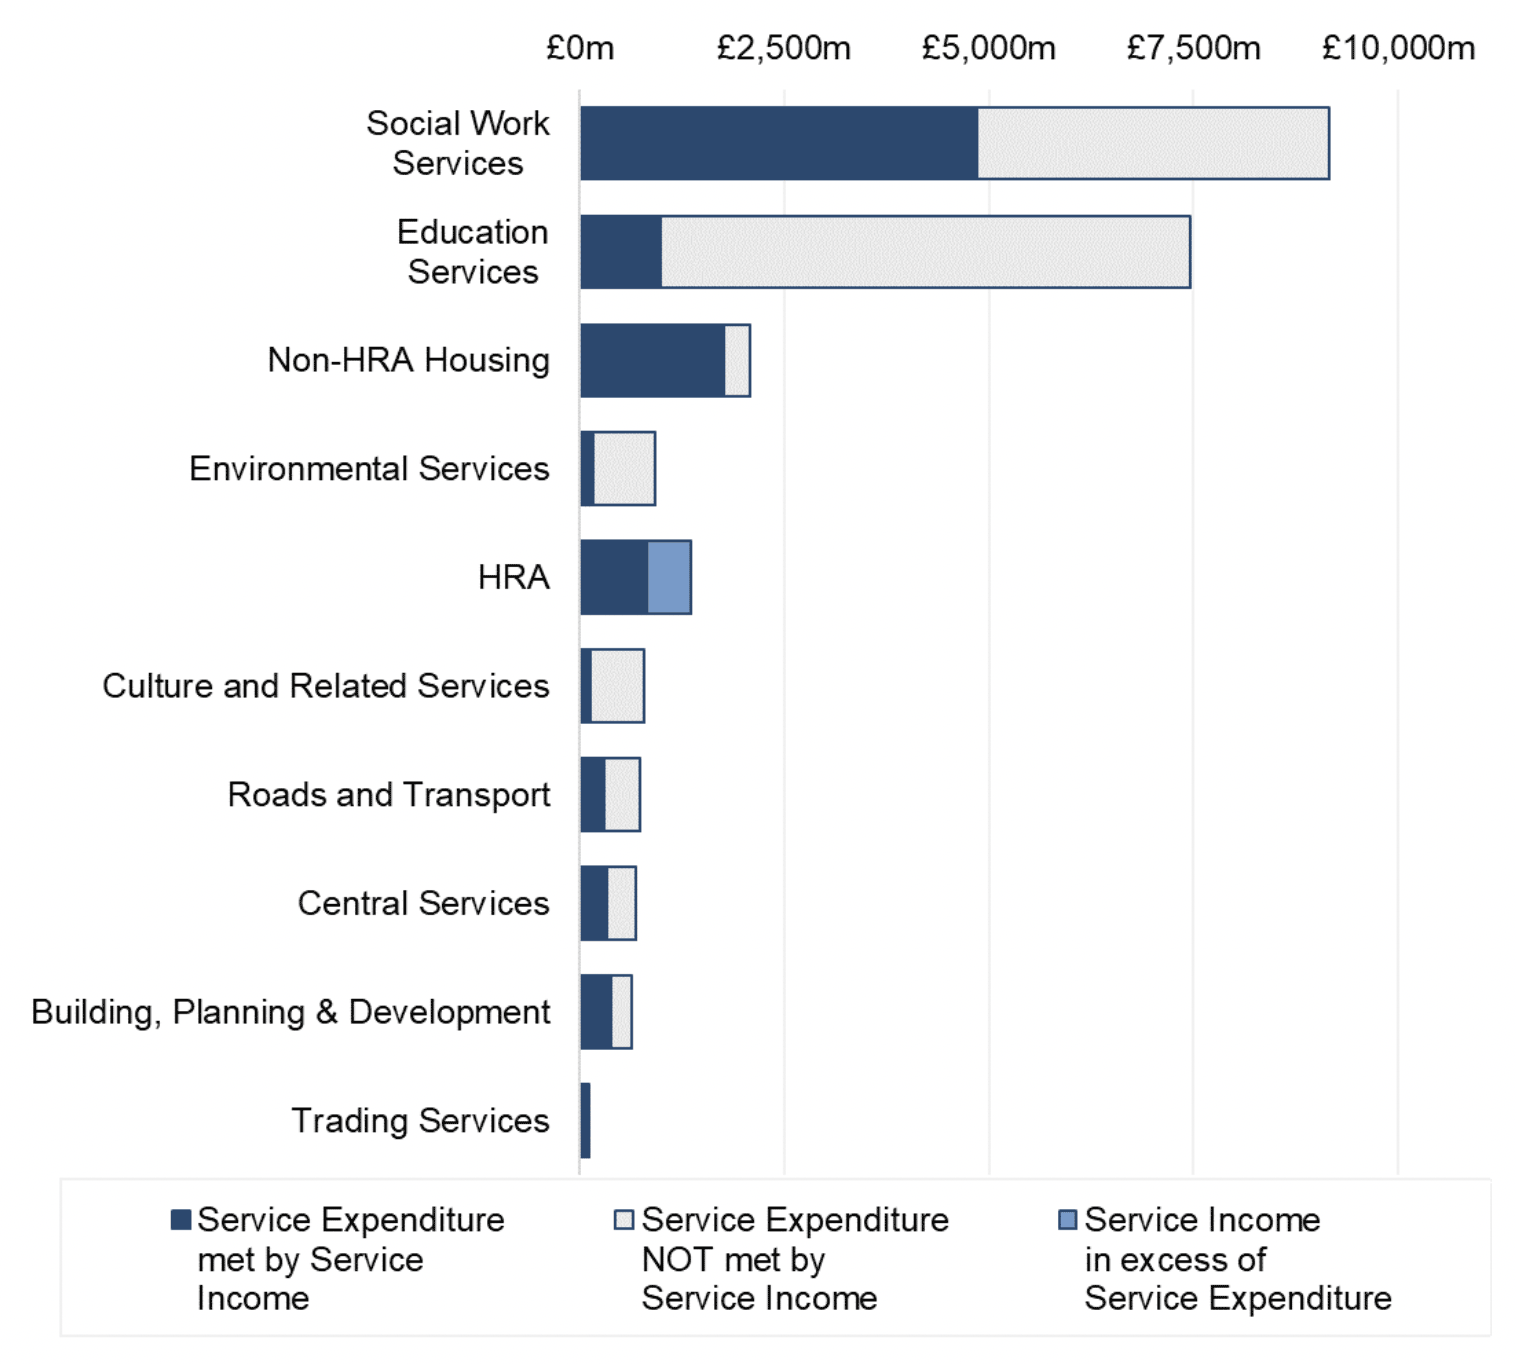
In 2022-23, 45 per cent of service expenditure was met by service income. Chart 2.5 shows the proportion of service expenditure met by service income for each service. This varies significantly between services as they each receive different levels of grants and contributions, and services have differing abilities to generate service income in the form of customer and client receipts.
Service income exceeded service expenditure for HRA and Trading Services, generating surplus income for both services.
Service income was less than service expenditure for all other services, with the amount of service expenditure being funded by service income ranging from 13 per cent for Education Services to 85 per cent for Non-HRA Housing.
Source: LFR 00
2.2 Other Expenditure and Income
Local authorities will also incur some revenue expenditure and income that is not attributable to specific services, such as interest paid or received, statutory repayment of debts, contributions to capital expenditure, proceeds of trading operations and any other operating expenditure.
In 2022-23, local authorities incurred £1,184 million of other expenditure and income. Table 2.5 provides a breakdown of this figure, split by the General Fund and HRA. Total interest paid was £893 million in 2022-23.
| Expenditure / Income Type | General Fund | HRA | Total |
|---|---|---|---|
| Interest Payable and Similar Charges | 733 | 161 | 893 |
| Interest Receivable and Similar Income | -65 | -6 | -71 |
| Statutory Repayment of Debt | -75 | 127 | 53 |
| Capital Expenditure Funded from Revenue | 77 | 186 | 262 |
| Surplus (-) or Deficit (+) from Trading Operations | 46 | 0 | 46 |
| Other Operating Expenditure | 0 | 0 | 0 |
| Total Other Expenditure and Income | 716 | 468 | 1,184 |
Please note the following:
Income figures are presented as negative in this table.
‘Interest Receivable and Similar Income’ includes losses arising from derecognition of financial assets and recognition of credit losses on financial assets.
‘Statutory Repayment of Debt’ includes repayments relating to lending to other statutory bodies and so will differ to the repayment figures in Chapter 5.
Source: LFR A0
For 2021-22, statutory repayment of debt totalled £553 million, whereas the figure for 2022-23 is £53 million. Ministers permitted a statutory flexibility, that could be exercised in either 2021-22 or 2022-23, for local authorities to reprofile the repayment term of service concession arrangements (PPP/PFI contracts), to spread the costs over the asset life rather than contract term and thereby make the charge to Council Tax payers for the capital investment more affordable.
The cumulative charges for service concession arrangements at the point of applying this flexibility would be significantly lower, when spreading the cost over the asset life (usually 40 years), than would have been the case when spreading the cost over the contract term (usually 25 years).
This therefore results in an accounting adjustment for the cumulative effect of the reprofiled debt financing costs for service concession arrangements, with the ‘overpayment’ credited to (increasing) General Fund reserves. In 2022-23, this adjustment was a credit of £75 million during 2022-23, whereas £410 million in debt repayments were made in 2021-22.
2.3 General Funding
General funding, referred to as ‘Taxation and Non-Specific Grant Income’ within local authorities’ accounts, principally consists of the General Revenue Grant (GRG) and local taxation, specifically Non-Domestic Rates (NDR) and Council Tax.
Total general funding available to authorities in 2022-23 was £14,233 million, an increase of 3.2 per cent, or £445 million, from 2021-22. Chart 2.6 shows the total general funding available to local authorities in 2022-23 by type of funding.
Chart 2.6: General Funding in 2022-23 by Source, £ millions
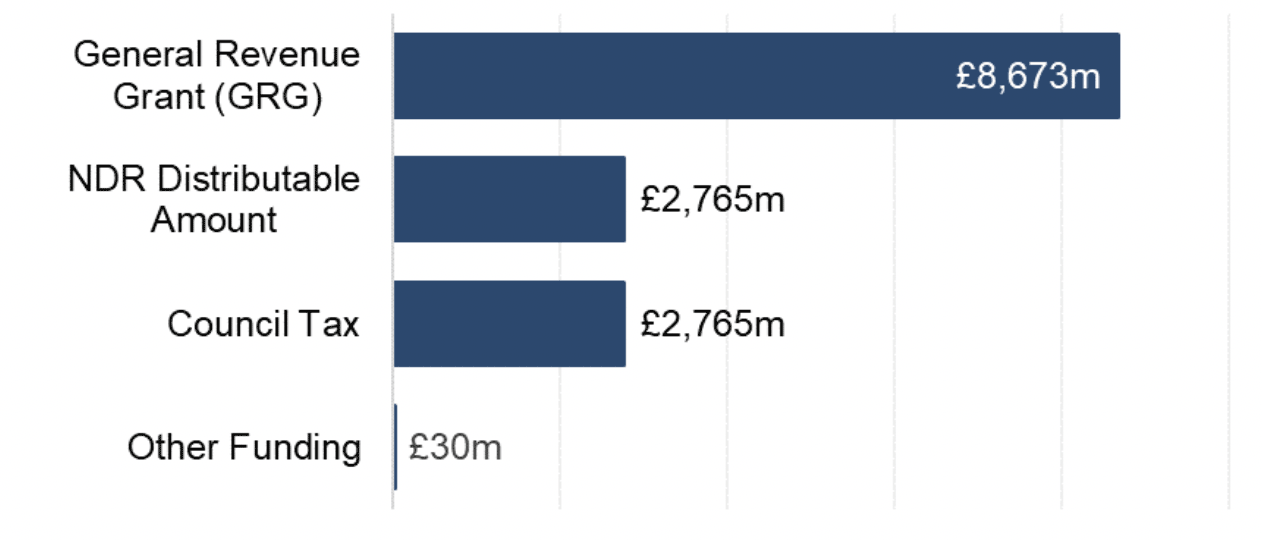
Please note that ‘Other Funding’ includes government grants paid to joint boards and income received through NDR TIF and BRIS schemes (Chapter 2.3.2.3).
Source: LFR A0
General Revenue Grant (GRG) is the general grant paid to local authorities by the Scottish Government, including monies from the UK Government payable to a local authority, and is the main source of funding for local authorities. In 2022-23, GRG accounted for £8,673 million, or 61 per cent, of general funding. See Annex C for how this figure is derived.
NDR accounted for £2,765 million, or 19 per cent, of general funding. The Scottish Government guarantees the combined sum of GRG and NDR funding to local authorities in each financial year. More detail on NDR is provided in Chapter 2.3.2 and more information on the process to determine local government funding from the Scottish Government is available in the Local Government Funding: Process Overview publications.
Council Tax accounted for £2,765 million, or 19 per cent, of general funding in 2022-23 – this is consistent with prior years. More information on Council Tax is provided in Chapter 2.3.1.
Table 2.6 shows the breakdown of general funding figures between 2018-19 and 2022-23. As the combined total of NDR and GRG provided to local authorities is guaranteed, any decrease in the amount of NDR collected is compensated for by a corresponding increase in GRG.
Council Tax has continued the steady increase seen over the last five years, with an increase of 4.7 per cent, or £125 million, from 2021-22.
| General Funding Source | 2018-19 | 2019-20 | 2020-21 | 2021-22 | 2022-23 | % change between 2021-22 & 2022-23 |
|---|---|---|---|---|---|---|
| GRG | 6,885 | 6,937 | 9,308 | 9,014 | 8,673 | -3.8% |
| NDR Distributable Amount | 2,636 | 2,853 | 1,868 | 2,090 | 2,765 | 32.3% |
| Council Tax | 2,376 | 2,493 | 2,581 | 2,640 | 2,765 | 4.7% |
| Other Funding | 13 | 40 | 76 | 44 | 30 | -32.4% |
| Total General Funding | 11,910 | 12,323 | 13,834 | 13,788 | 14,233 | 3.2% |
Please note the following:
GRG figures for 2018-19 and 2019-20 differ from the Finance Circular allocation due to £10m for Teacher’s Pay which was paid as part of the 2019-20 settlement but recorded by local authorities as income in 2018-19.
The 2022-23 GRG figure differs to the Finance Circular allocation. Please see Annex C for details.
‘Other Funding’ includes government grants paid to joint boards and income received through NDR TIF and BRIS schemes.
Source: LFR A0
2.3.1 Council Tax
Council Tax was introduced in Scotland on the 1 April 1993 to replace the Community Charge. It is a tax system based on dwellings and is a component of general funding for local authorities.
There are three factors that determine the amount of Council Tax that a dwelling is liable for:
1. The market value of the dwelling as at the 1 April 1991. Each dwelling is placed into one of eight bands from A to H, with Band A dwellings liable for the lowest rates of Council Tax and Band H attracting the highest.
2. The Band D rate which is set by the local authority, with other bands calculated as a ratio to Band D. The ratios determining the charges for properties in bands E to H were revised in 2017-18.
3. A range of discounts, exemptions, reductions and increases that are available in certain circumstances, or in some cases an increase in Council Tax due to the application of a levy.
The valuation range and ratio for each Council Tax band is given in Table 2.7.
| Band | Valuation Band Ranges as at 1 April 1991 | Ratio to Band D | No. of Chargeable Dwellings as at September 2022 | Proportion of Chargeable dwellings |
|---|---|---|---|---|
| Band A | Under £27,000 | 6/9 | 498,334 | 19.4% |
| Band B | £27,001 to £35,000 | 7/9 | 577,657 | 22.5% |
| Band C | £35,001 to £45,000 | 8/9 | 415,939 | 16.2% |
| Band D | £45,001 to £58,000 | 9/9 | 355,115 | 13.9% |
| Band E | £58,001 to £80,000 | 473/360 | 354,197 | 13.8% |
| Band F | £80,001 to £106,000 | 585/360 | 211,243 | 8.2% |
| Band G | £106,001 to £212,000 | 705/360 | 135,840 | 5.3% |
| Band H | Over £212,000 | 882/360 | 14,032 | 0.5% |
| Total | 2,562,357 | 100.0% |
Please note the following:
“n/a” indicates where a total value is not applicable.
The ratios quoted applied from 2017-18 onwards.
Source: CTaxbase
2.3.1.1 Collection and Yield of Council Tax
Local authorities are responsible for billing and collecting Council Tax. Before the start of each financial year, local authorities issue Council Tax bills to householders in each dwelling. Each bill is calculated by applying the appropriate band rate for the local authority, then applying any discounts, exemptions, reductions or increases – further details are provided in Tables 2.12 and 2.13.
Council Tax Potential Yield refers to the Council Tax yield if all dwellings paid the full rate for their relevant Band and local authority. Chart 2.7 illustrates the gross Council Tax potential yield broken down into the Council Tax billed and the amounts not billed due to discounts and exemptions or where the Council Tax Reduction (CTR) scheme has reduced a household’s Council Tax liability.
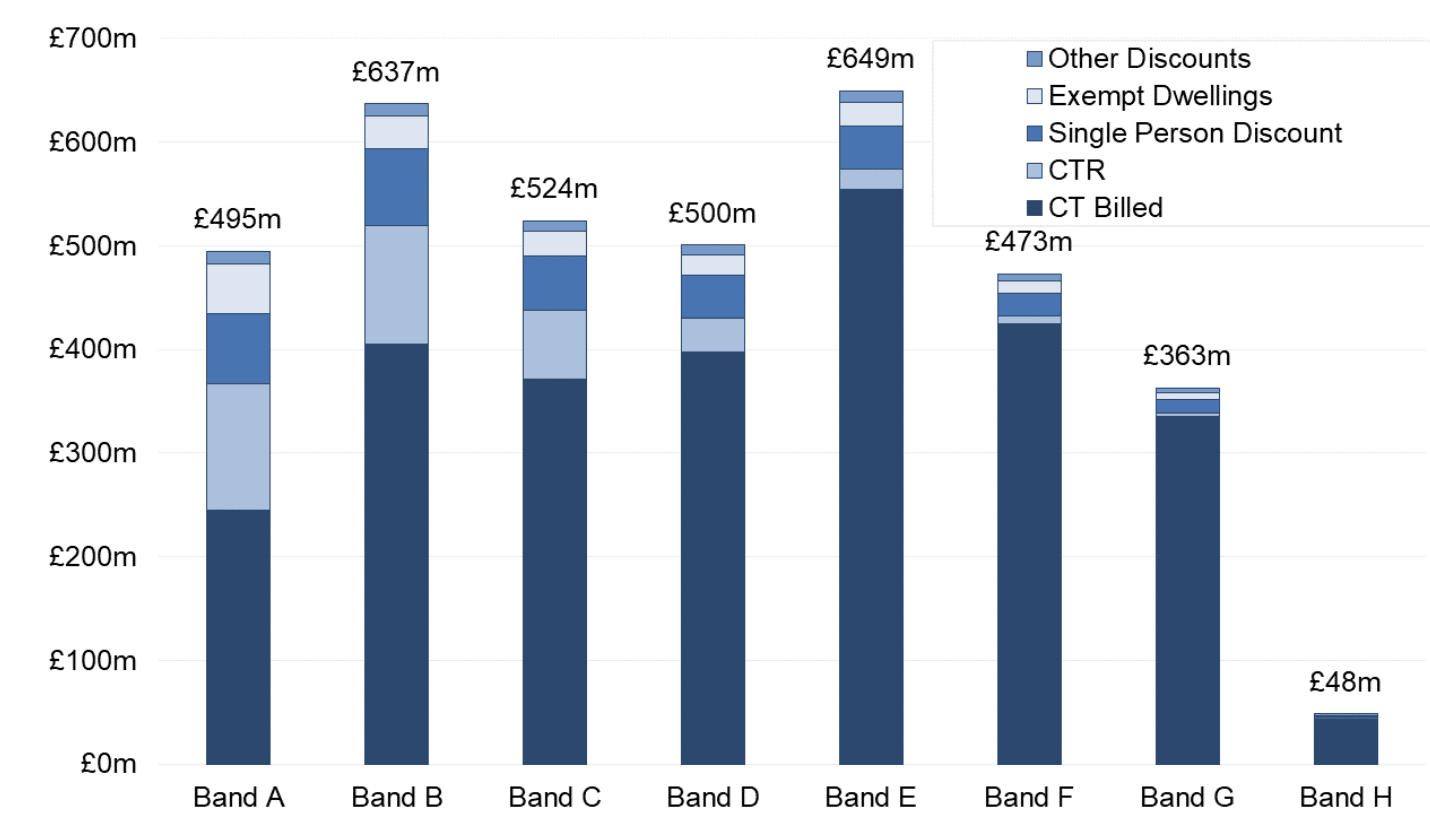
Source: CTaxbase and CTRR
Local authorities collect Council Tax relating to these bills over the year, and also continue to collect late amounts from previous billing years. The provisional in-year Council Tax collection rate in Scotland for 2022-23 was 96.2 per cent – this is the proportion of Council Tax billed for 2022-23 that was collected by 31 March 2023. As published in June 2023, the provisional total amount of Council Tax collected for Scotland after CTR and including late payments of bills from prior years, was £2,728 million. More information about bills issued in 2022-23 and the provisional amounts collected are available in the Council Tax Collection Statistics, 2022-23 publication.
Table 2.8 shows the amount of Council Tax collected by each local authority in 2022-23 based on, as far as possible, their audited annual accounts. The figure is marginally higher at £2,765 million.
| Local Authority | Net Council Tax Income |
|---|---|
| Aberdeen City | 133,137 |
| Aberdeenshire | 158,715 |
| Angus | 54,304 |
| Argyll & Bute | 58,230 |
| City of Edinburgh | 307,480 |
| Clackmannanshire | 24,387 |
| Dumfries & Galloway | 73,462 |
| Dundee City | 60,970 |
| East Ayrshire | 55,488 |
| East Dunbartonshire | 69,229 |
| East Lothian | 63,051 |
| East Renfrewshire | 58,611 |
| Falkirk | 72,923 |
| Fife | 178,996 |
| Glasgow City | 260,233 |
| Highland | 136,667 |
| Inverclyde | 34,146 |
| Midlothian | 53,315 |
| Moray | 48,375 |
| Na h-Eileanan Siar | 12,497 |
| North Ayrshire | 61,989 |
| North Lanarkshire | 130,267 |
| Orkney Islands | 10,572 |
| Perth & Kinross | 92,860 |
| Renfrewshire | 90,254 |
| Scottish Borders | 63,591 |
| Shetland Islands | 10,254 |
| South Ayrshire | 64,110 |
| South Lanarkshire | 148,958 |
| Stirling | 55,111 |
| West Dunbartonshire | 39,313 |
| West Lothian | 83,769 |
| Scotland | 2,765,264 |
Please note that figures relate to income collected in 2022-23, which can include amounts that were billed in previous years.
Source: LFR A0
2.3.1.2 Chargeable Dwellings
Table 2.9 shows the number of dwellings in Scotland for each September from 2017-18 to 2022-23. There were a total of 2.699 million dwellings in Scotland in 2022-23, of which 136,683 were exempt for Council Tax purposes. This gave 2.562 million chargeable dwellings in 2022-23, an increase of around 3 per cent, or around 75,256 dwellings, since 2018-19.
| Financial Year | Total Dwellings | Exempt Dwellings | Chargeable Dwellings |
|---|---|---|---|
| 2018-19 | 2,614,957 | 127,856 | 2,487,101 |
| 2019-20 | 2,636,639 | 131,706 | 2,504,933 |
| 2020-21 | 2,653,732 | 130,845 | 2,522,887 |
| 2021-22 | 2,674,729 | 134,096 | 2,540,633 |
| 2022-23 | 2,699,040 | 136,683 | 2,562,357 |
Source: CTaxbase
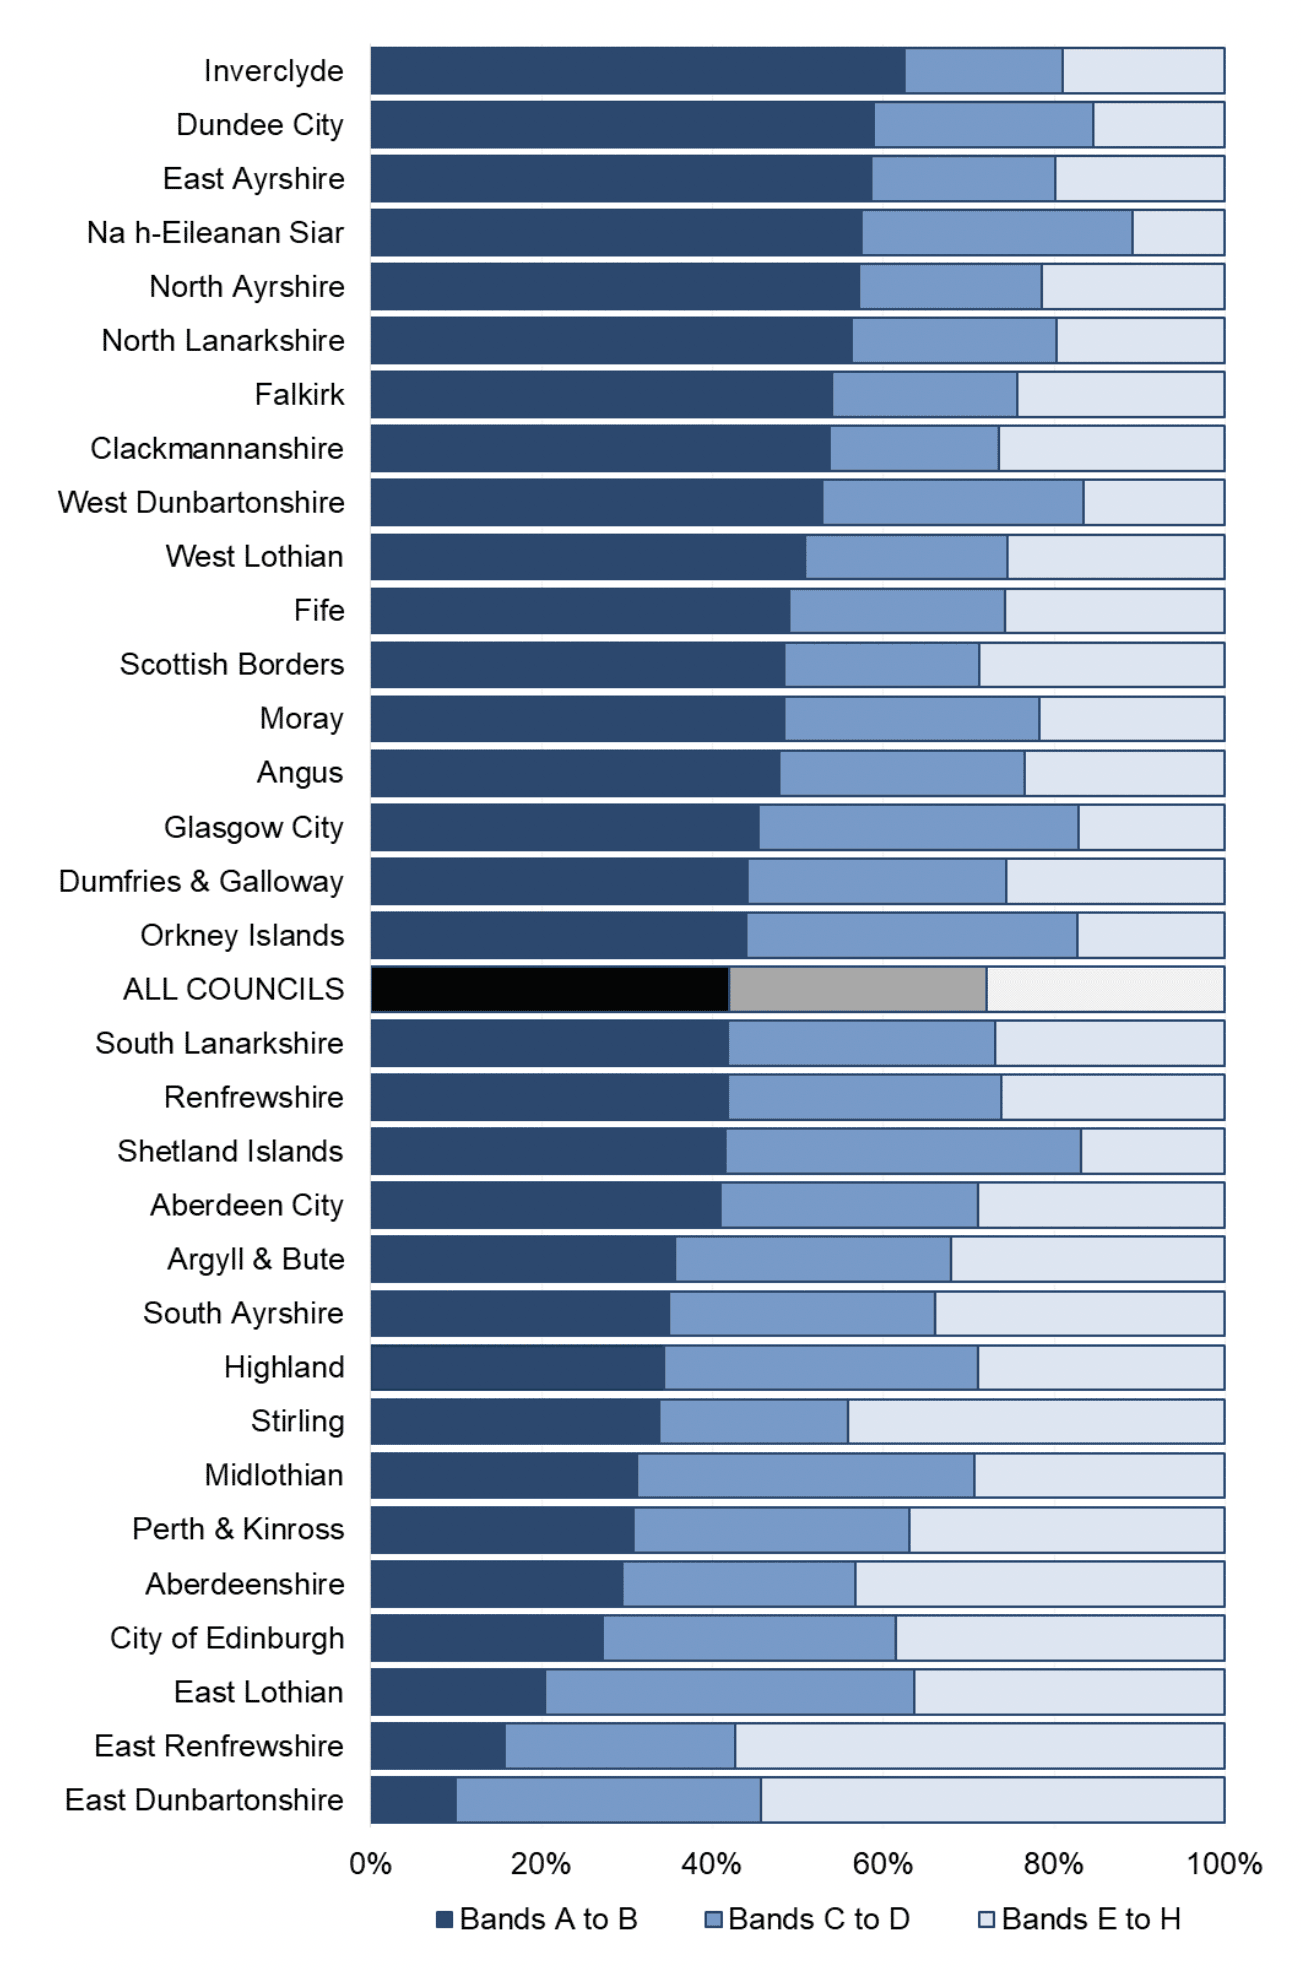
Chart 2.8 shows the distribution of chargeable dwellings across Council Tax bands in each local authority. Across Scotland, just under three-quarters of all chargeable dwellings are in Bands A to D. The distribution varies across local authorities due to variations in property market values. Na h-Eileanan Siar has the largest proportion of dwellings in Bands A to D at 89 per cent, whereas East Renfrewshire has the lowest proportion in Bands A to D at 43 per cent.
The ratios for Bands E to H, as shown in Table 2.7, were revised in 2017-18 and so dwellings in these bands, which make up just over a quarter of total dwellings, are subject to higher charges.
The three local authorities with the highest number of chargeable dwellings were Glasgow City, City of Edinburgh and Fife, making up over a quarter of the chargeable dwellings in Scotland between them. Further data on the number of chargeable dwellings by local authority and Council Tax band can be found in the Council Tax supplementary tables.
Source: CTaxbase
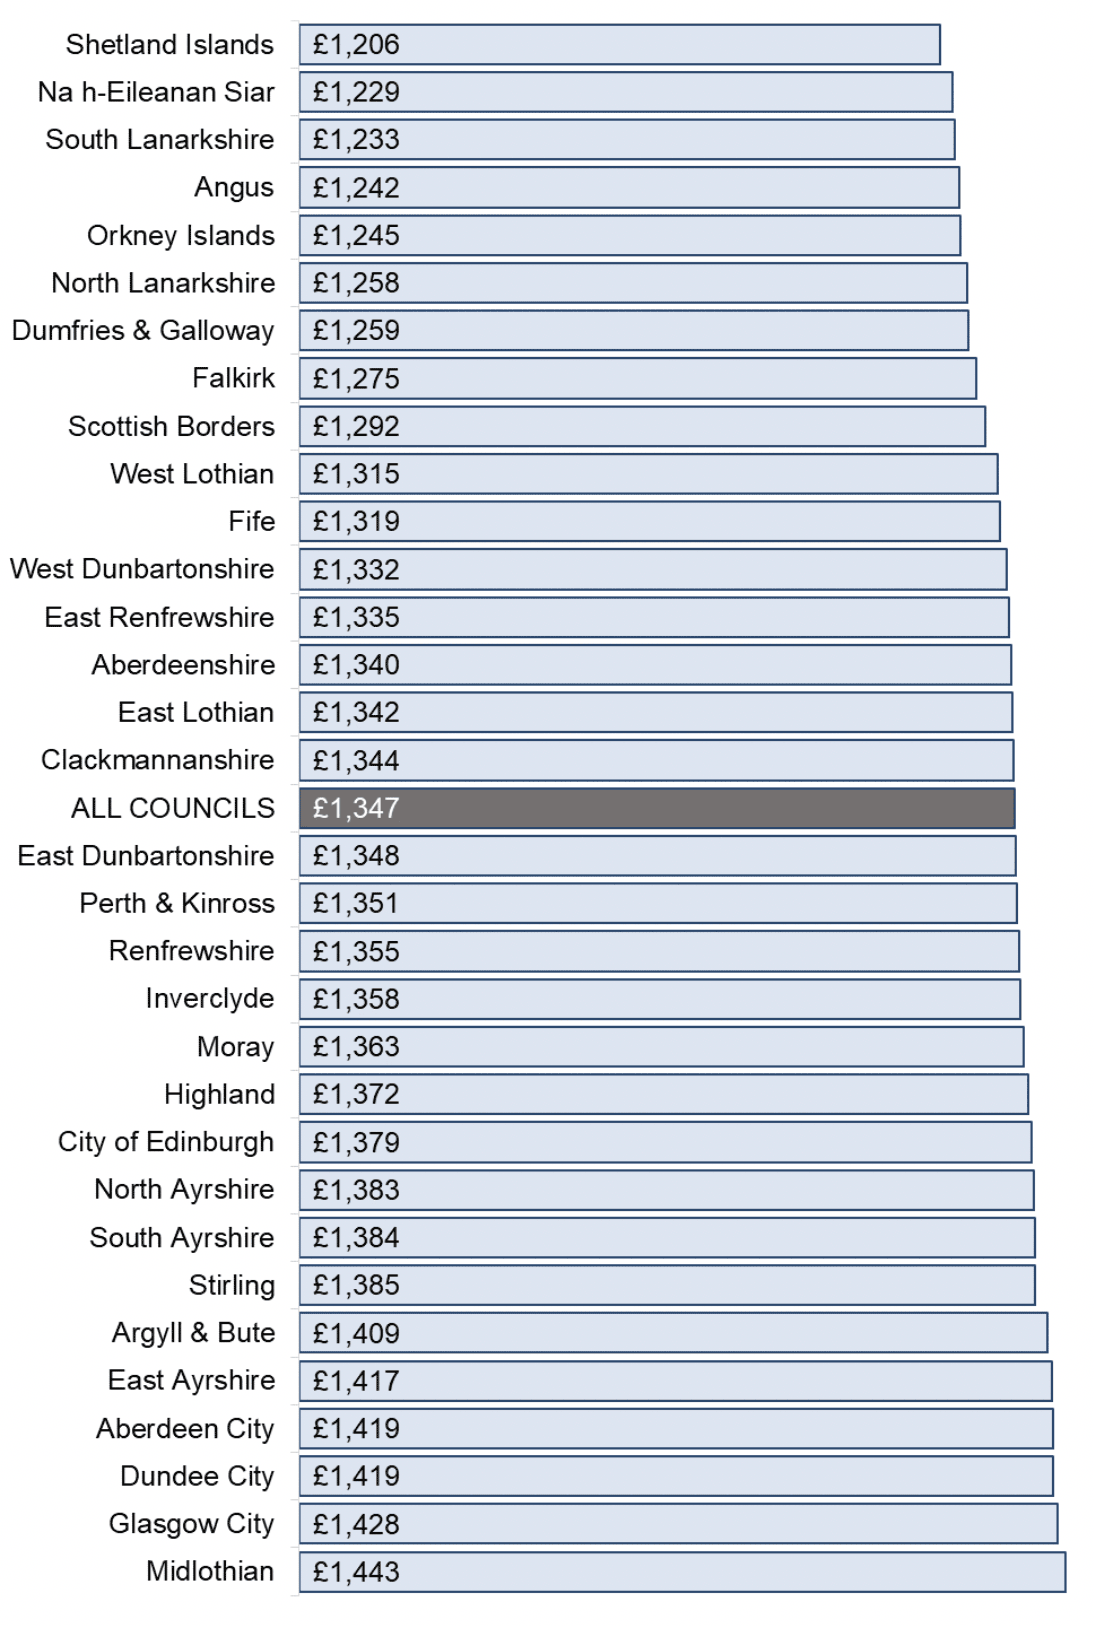
2.3.1.3 Council Tax Rates and Average Bills
Each local authority determines their own Band D rate of Council Tax as part of their budget setting process. The rate for other bands is then calculated as a set ratio of the Band D rate, see Table 2.7, and so each local authority has different Council Tax rates. The 2022-23 Band D Council Tax rates for each local authority are shown in Chart 2.9 ranging from £1,206 in Shetland to £1,443 in Midlothian. The Scotland Average Band D Council Tax Rate was £1,347, compared to £1,308 in 2021-22. This is an increase of 2.98 per cent or £39.
Source: CTAS
From 2007-08 to 2016-17, the Scottish Government and local government worked in partnership to freeze Council Tax rates each year. The one exception is Stirling, who reduced their Band D rate from £1,223 in 2007-08 to £1,209 in 2008-09, and subsequently to £1,197 in 2012-13. The Council Tax freeze caused the Scotland average Band D Council Tax rate to remain steady at £1,149 from 2007-08 to 2016-17 – a fall in real terms.
After nine years of the Council Tax freeze, the Scottish Government secured the agreement of local authorities to cap locally determined Council Tax increases to three per cent in cash terms in both 2017-18 and 2018-19. This continued into 2019-20 and 2021-22, when local government agreed Council Tax increases to be capped at three per cent in real terms, which was 4.79 per cent in cash terms in 2019-20 and 4.84 per cent in 2021-22. All 32 local authorities froze their Council Tax rates for 2021-22.
For 2022-23, the overall increase was 2.98 per cent in cash terms, based on the Scotland Average Band D Council Tax Rate.
The average Council Tax bill per dwelling in 2022-23 was £1,238. This differs from the average Band D rate due to the distribution of dwellings across Council Tax bands, as can be seen in Table 2.7 and Chart 2.7, and the application of discounts.
Table 2.10 shows how the average Council Tax bill for Scotland has changed each year from 2018-19[3].
| Financial Year | Before CTR | After CTR |
|---|---|---|
| 2018-19 | £1,106 | £973 |
| 2019-20 | £1,147 | £1,013 |
| 2020-21 | £1,201 | £1,053 |
| 2021-22 | £1,198 | £1,057 |
| 2022-23 | £1,238 | £1,096 |
Please note that the minor changes between years where Council Tax was frozen are due to a number of factors, including the distribution of dwellings across bands; discounts and exemptions; new construction and removal of demolished housing from the roll.
Source: CTAS, CTaxbase and LFR 12
2.3.1.4 Council Tax Reduction (CTR)
Scotland’s Council Tax Reduction (CTR) scheme was introduced in 2013 following the UK Government’s abolition of Council Tax Benefit (CTB), with responsibility for Council Tax reduction schemes given to local government in England and the Scottish and Welsh Governments.
The CTR scheme reduces the Council Tax liability of lower income households in Scotland, and takes into account a household’s earnings, composition and characteristics. The impact of CTR on the average Council Tax bill is also shown in Table 2.10. After taking these reductions in liability into account, the average bill per dwelling increased by £38, from £1,057 in 2021-22 to £1,096 in 2022-23. These figures are averages and it is important to note that not everyone who pays Council Tax will be eligible for CTR; and that CTR levels will be different depending on individual household circumstances and characteristics.
The Scottish Government provides funding to local authorities to compensate them for the loss in tax receipts associated with the CTR scheme. In 2022-23, CTR funding totalled £351 million.
The amounts distributed to each local authority and the final reduction in liability are shown in Table 2.11. The reduction in liability due to the CTR scheme was around £364.8 million across Scotland in 2022-23. This figure is £13.8 million more than the £351 million funding provided by the Scottish Government. The three local authorities with the largest CTR liabilities are Glasgow City, City of Edinburgh and North Lanarkshire.
| Local Authority | CTR Funding from SG | Final total reduction in liability |
|---|---|---|
| Aberdeen City | 11,330 | 11,541 |
| Aberdeenshire | 9,061 | 9,154 |
| Angus | 5,448 | 5,580 |
| Argyll & Bute | 5,457 | 5,647 |
| City of Edinburgh | 26,678 | 25,993 |
| Clackmannanshire | 3,615 | 3,903 |
| Dumfries & Galloway | 9,128 | 9,742 |
| Dundee City | 12,411 | 13,323 |
| East Ayrshire | 9,403 | 9,879 |
| East Dunbartonshire | 4,744 | 5,055 |
| East Lothian | 5,326 | 5,652 |
| East Renfrewshire | 4,062 | 4,199 |
| Falkirk | 8,293 | 8,892 |
| Fife | 21,486 | 22,403 |
| Glasgow City | 70,828 | 74,017 |
| Highland | 12,880 | 13,326 |
| Inverclyde | 6,475 | 6,841 |
| Midlothian | 4,916 | 5,265 |
| Moray | 3,940 | 4,059 |
| Na h-Eileanan Siar | 1,310 | 1,310 |
| North Ayrshire | 12,109 | 13,070 |
| North Lanarkshire | 23,595 | 24,383 |
| Orkney Islands | 903 | 915 |
| Perth & Kinross | 6,761 | 6,966 |
| Renfrewshire | 13,369 | 13,143 |
| Scottish Borders | 5,580 | 5,574 |
| Shetland Islands | 729 | 729 |
| South Ayrshire | 8,156 | 8,612 |
| South Lanarkshire | 20,398 | 21,917 |
| Stirling | 4,206 | 4,504 |
| West Dunbartonshire | 8,257 | 8,573 |
| West Lothian | 10,147 | 10,621 |
| Scotland | 351,000 | 364,788 |
Source: CTR Extracts and LFR 12
2.3.1.5 Changes to Council Tax Liabilities
Not all dwellings are liable to pay the full rate of Council Tax. Discounts, exemptions and increased rates can be charged for certain types of dwellings, and the CTR scheme is available to support lower income households in meeting their Council Tax liabilities.
Table 2.12 summarises the range of discounts, exemptions and reductions available and the change in liability that applies to each type. Please note that, in some cases, more than one type of discount, exemption or reduction may apply. The examples given in Table 2.12 are typical but not exhaustive. A full explanation of Council Tax discounts and exemptions is available on the Scottish Government website.
Table 2.12: Council Tax Discounts, Exemptions, Reductions and Increases
Please note that in 2013-14, local authorities gained the discretionary power to remove the discount for Second Homes / Long Term Empty, or set a Council Tax increase of 100% on ‘Long Term Empty – More than 12 months’ properties.
Discounts
Type of Support: Single Person Discount
Typical dwellings that are eligible: Chargeable dwellings in which there is only one resident or only one resident is not disregarded.
Reduction in liability: 25% discount
Type of Support: Second Homes
Typical dwellings that are eligible: Chargeable dwellings which are no one's sole or main residence, but are furnished and lived in for at least 25 days during any 12 month period.
Reduction in liability: 10 - 50% discount or discount removed (actual change depends on local authority policy)
Type of Support: Short Term Empty – Less than 12 months (or 24 months for properties for sale or let)
Typical dwellings that are eligible: Empty properties not meeting the criteria of a second home, or subject to a separate exemption.
Reduction in liability: 10 - 50% discount (actual change depends on local authority policy)
Type of Support: Long Term Empty – More than 12 months (or 24 months for properties for sale or let)
Typical dwellings that are eligible: Empty properties not meeting the criteria of a second home, or subject to a separate exemption.
Reduction in liability: Up to 50% discount or an increase of up to 100% (actual change depends on local authority policy)
Type of Support: Occupied entirely by disregarded adults
Typical dwellings that are eligible: Chargeable dwellings occupied entirely by residents who are disregarded for a discount.
Reduction in liability: 50% discount
Exemptions
Type of Support: Occupied
Typical dwellings that are eligible: Dwellings occupied solely by any combination of students, care leavers, those with a severe mental impairment, school leavers or persons under the age of 18.
Reduction in liability: 100% reduction
Type of Support: Unoccupied
Typical dwellings that are eligible: Dwellings which are empty and unfurnished for less than 6 months or empty and under repair for less than 12 months. Dwellings which are empty because their former residents have moved out for the purposes of receiving personal care by reason of old age, disablement or illness.
Reduction in liability: 100% reduction
Reductions
Type of Support: Disability reduction
Typical dwellings that are eligible: Homes that have been adapted for a disabled person.
Reduction in liability: One CT Band, for example an eligible Band D property would be charged the Band C rate. Eligible Band A properties are charged 5/9 of the Band D rate.
Type of Support: CTR (Passported)
Typical dwellings that are eligible: In receipt of Pension Credit (Guarantee), Jobseeker’s Allowance (income based), Employment and Support Allowance (income related) or Income Support.
Reduction in liability: 100% reduction
Type of Support: CTR (Not passported)
Typical dwellings that are eligible: Low income household.
Reduction in liability: Up to 100% reduction (actual change is dependent on a means-test)
Table 2.13 13 shows the number of dwellings eligible for Council Tax discounts and reductions. Of the 2.562 million chargeable dwellings in Scotland, just over one million were eligible for a discount in 2022-23. The most common type of discount was the Single Person Discount, with around two-fifths of chargeable dwellings entitled to the discount in 2022-23. The CTR scheme supports almost half a million dwellings, or around one-fifth of chargeable dwellings, in meeting their Council Tax liability. At September 2022, 68,888 dwellings (three per cent) were classified as second homes or empty properties.
More recent data for September 2023 (Housing Statistics Quarterly Update: September 2023) suggests around 70,278 dwellings are classified as second homes or empty properties.
| Type of Support | 2018-19 | 2019-20 | 2020-21 | 2021-22 | 2022-23 |
|---|---|---|---|---|---|
| Disability reduction | 13,903 | 14,048 | 14,009 | 13,988 | 14,096 |
| Single Person Discount | 978,504 | 988,720 | 1,004,557 | 1,025,094 | 1,037,962 |
| Second Homes | 24,828 | 24,314 | 24,466 | 23,890 | 24,287 |
| Empty Properties | 39,110 | 40,963 | 47,333 | 43,766 | 44,601 |
| Occupied entirely by disregarded adults | 1,374 | 1,517 | 1,500 | 1,460 | 1,434 |
| Dwellings not subject to discount | 1,443,285 | 1,449,419 | 1,445,031 | 1,446,423 | 1,454,073 |
| Council Tax Reduction recipients | 481,100 | 471,790 | 500,620 | 482,060 | 449,905 |
| All chargeable dwellings | 2,487,101 | 2,504,933 | 2,522,887 | 2,540,633 | 2,562,357 |
Please note the following:
Some dwellings may be eligible for more than one type of support, in these cases, the dwelling will be counted under each type of support it is eligible for.
It is not possible for some local authorities to separately identify Second Homes and Long Term Empty dwellings. For these authorities, the total number of Second Homes and Long Term Empty dwellings has been recorded under Second Homes.
Source: CTaxbase and CTR Extract
2.3.2 Non-Domestic Rates (NDR)
Non-Domestic Rates (NDR) are a property tax for which the occupier of a non-domestic property is statutorily liable. A non-domestic property is an individual property used for non-domestic purposes, such as business premises and third and public sector properties.
The principles of NDR were established in the Lands Valuation (Scotland) Act 1854. This Act also provided for the appointment of the Scottish Assessors, who are responsible for determining the classification and valuation of non-domestic and domestic properties and are independent of both the Scottish Government and local authorities.
Non-domestic rates generated £2,792 million of net income in 2022-23, as shown in Table 2.14. This is the total contributable amount of NDR income (NDRI). The contributable amount is equivalent to the gross amount paid by ratepayers, net of any reliefs which are funded by the Scottish Government. However, the contributable amount is not net of any reliefs funded by local authorities themselves, and so it differs from the amount collected from ratepayers (the collectable amount).
Each local authority reports their Provisional Contributable Amount (PCA) to the Scottish Government at the start of the year. This is included in the annual NDR account and published as part of the Scottish Government’s overall annual accounts. The amount to be distributed to each authority as part of the annual local government finance settlement is known as the distributable amount and is set by the Scottish Government before the start of the financial year. In 2022-23, the distributable amount was set at £2,766 million – see Chart 2.6 and Table 2.14.
| NDR Type | 2018-19 | 2019-20 | 2020-21 | 2021-22 | 2022-23 |
|---|---|---|---|---|---|
| NDR Contributable Amount | 2,847 | 2,753 | 1,816 | 2,108 | 2,792 |
| NDR Distributable Amount | 2,636 | 2,853 | 1,868 | 2,090 | 2,766 |
Please note that the NDR Contributable Amounts reflect the final, audited income figures collected by local authorities, except for 2022-23 which are the Notified (provisional outturn) figures as the audits are not yet finalised for all councils. They are net of reliefs paid by Scottish Government, but gross of all local reliefs and top-ups to discretionary amounts paid by councils themselves.
Source: NDRI Audited Returns, Local Government Finance Circulars
Local authorities retain all of the NDRI collected in their area. However, the contributable amount that they report is notionally pooled and then redistributed to councils as the distributable amount of NDRI, allocated to each local authority in proportion to each one’s most recent prior year NDRI mid-year estimate. As the combined total of NDRI and General Revenue Grant (GRG) provided to local authorities is guaranteed by the Scottish Government, any decrease in the amount of NDRI collected is compensated for by a corresponding increase in GRG and vice versa. Any changes from the provisional contributable amount reported to the final outturn contributable amount in any year is accounted for is accounted for in the calculation of future years’ distributable amounts.
The distributable amount is based upon the forecast of the NDRI made prior to the year start by the Scottish Fiscal Commission (SFC), and includes prior year adjustments. This is presented in Figure 4.8 (page 58) of the SFC’s publication ‘Scotland’s Economic and Fiscal Forecasts – December 2022’. The distributable amount is therefore not likely to match exactly the NDRI received in any year, as shown in Table 2.14, nor the total eventual contributions to the pool for any year. Final contributions to the pool are based on councils’ provisional estimates of their contributable amount at the start of the year, their Provisional Contributable Amount (PCA), adjusted by the amount by which the previous year’s final outturn differs from the previous year’s PCA. Final contributions to the pool (and distributions to councils) are set out in the non-domestic rating account.
2.3.2.1 Rateable Values (RVs)
NDR bills are based on the Rateable Value (RV) of a property. The RV is based on a legally defined valuation and broadly corresponds to the notional rental value the property could achieve in the open market if it were vacant and available to let, taking account of the type and nature of the property. As such, it is not necessarily a reflection of the profitability, turnover, or output of the ratepayer.
The RV of a non-domestic property is generally initially established when the property comes into existence, subject to rating exemptions (for instance, agricultural lands and buildings are exempt from rating). Rateable non-domestic properties and their corresponding RVs are listed on the valuation roll, which is maintained by the Scottish Assessors. RVs are periodically updated at non-domestic revaluations. The latest revaluation, assigning updated RVs to all non-domestic properties in Scotland, took effect in April 2023, after the end of the period covered by this publication. Prior to this, there was a revaluation in 2017 and an analysis of changes in the RV of non-domestic properties in Scotland following the 2017 revaluation is available on the Scottish Government website. Revaluations historically took place on a five-year cycle; however, there was a seven-year cycle following the 2010 revaluation and a six-year cycle following the 2017 revaluation, the latest revaluation having been delayed to 2023 due to the Covid-19 pandemic. Future revaluations will take place every three years, as recommended by the Barclay Review.
Table 2.15 shows the types of properties, and associated RV on the valuation roll, by property type at 1 April 2022. The valuation roll is continually updated, and the NDRI for 2022-23 will not be based solely on the snapshot of the valuation roll at April 2022. The composition of the valuation roll as at 30 March 2023 is also shown in Table 2.14b, Table 2.15a and Chart 2.10a in the associated Excel file. The latest valuation roll statistics are available from the Scottish Assessors Association website.
As at 1 April 2022, there were 261,161 properties on the valuation roll, with a total RV of £7.3 billion, as shown in Table 2.15. Industrial subjects and shops were the most prevalent types of property on the valuation roll, making up 21.7 per cent and 20.7 per cent of the number of properties, and 17.4 per cent and 21.6 per cent of the total RV respectively. Offices are the next largest category in terms of numbers and RV. Together, these three categories accounted for 60.1 per cent of properties on the valuation roll, and 53.0 per cent of total RV.
| Category | Number of properties | % of Properties on Valuation Roll | Rateable Value, £ thousands | % of RV on Valuation Roll |
|---|---|---|---|---|
| Advertising | 1,640 | 0.6% | 10,832 | 0.1% |
| Care Facilities | 3,067 | 1.2% | 125,886 | 1.7% |
| Communications | 375 | 0.1% | 24,170 | 0.3% |
| Cultural | 1,335 | 0.5% | 53,400 | 0.7% |
| Education and Training | 3,596 | 1.4% | 560,084 | 7.7% |
| Garages and Petrol Stations | 4,128 | 1.6% | 72,532 | 1.0% |
| Health and Medical | 3,210 | 1.2% | 230,674 | 3.2% |
| Hotels | 5,848 | 2.2% | 283,951 | 3.9% |
| Industrial Subjects | 56,773 | 21.7% | 1,269,823 | 17.4% |
| Leisure, Entertainment, Caravans etc. | 27,466 | 10.5% | 296,480 | 4.1% |
| Offices | 46,100 | 17.7% | 1,025,885 | 14.1% |
| Other | 17,590 | 6.7% | 151,599 | 2.1% |
| Petrochemical | 135 | 0.1% | 109,112 | 1.5% |
| Public Houses | 3,546 | 1.4% | 120,467 | 1.7% |
| Public Service Subjects | 9,720 | 3.7% | 345,283 | 4.7% |
| Quarries, Mines, etc. | 661 | 0.3% | 14,399 | 0.2% |
| Religious | 5,999 | 2.3% | 57,617 | 0.8% |
| Shops | 54,135 | 20.7% | 1,573,134 | 21.6% |
| Sporting Subjects | 14,566 | 5.6% | 32,855 | 0.5% |
| Statutory Undertaking | 1,271 | 0.5% | 937,963 | 12.9% |
| All Non-Domestic Properties | 261,161 | 100.0% | 7,296,148 | 100.0% |
Please note, the number of properties includes properties with a zero rateable value.
Source: Scottish Assessors Valuation Roll
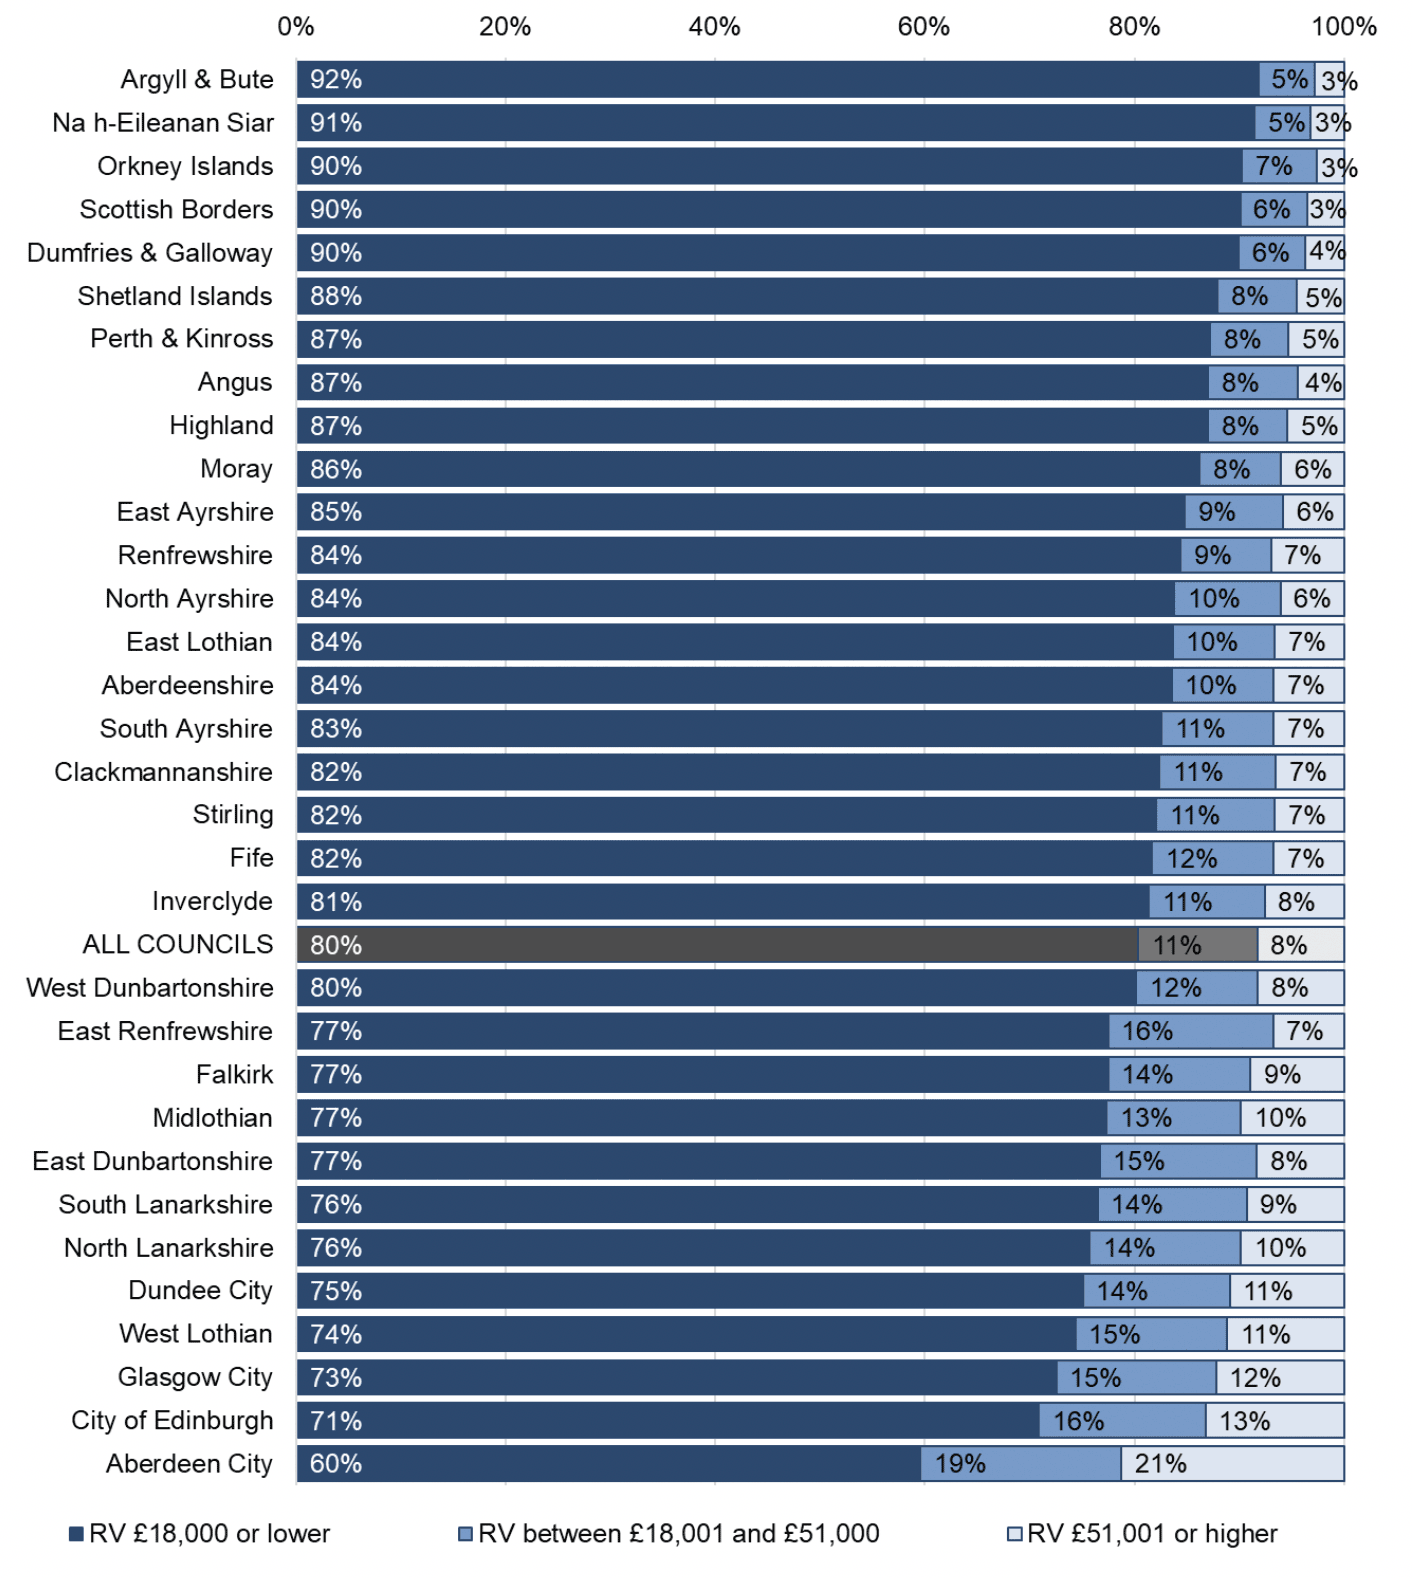
Chart 2.10 provides a breakdown of properties on the valuation roll by local authority and RV band: up to and including £18,000; between £18,001 and up to and including £51,000; between £51,001 and up to and including £95,000; and above £95,000. These RV bands were significant in 2022-23 as £18,000 in RV was the cut-off for properties to be eligible for the Small Business Bonus Scheme (SBBS) (see Chapter 2.3.2.4); £51,000 was the threshold above which the Intermediate Property Rate (IPR) was applied; and £95,000 was the threshold above which the Higher Property Rate (HPR) was applied (see Chapter 2.3.2.2).
Across Scotland, 80 per cent of non-domestic properties had a RV of up to £18,000. Eleven per cent had a RV between £18,001 and up to and including £51,000. Eight per cent had a RV higher than £51,000, of which 3.7 per cent had an RV between £51,001 and £95,000 and 4.6 per cent had an RV above £95,000. The number of properties with a rateable value above £95,000 by local authority is provided alongside the data for Chart 2.10 in the associated Excel file.
Please note the following:
The number of properties includes properties with a zero rateable value.
Some percentages are not displayed on the chart for presentational purposes. Percentages for all bands by local authority are available in the Chart 2.10 tab of the associated Excel file.
Source: Scottish Assessors Valuation Roll
2.3.2.2 NDR Bills
NDR bills are calculated using the RV of the property, multiplied by a poundage set nationally and annually by Scottish Ministers, less any relief or exemption entitlement.
(NDR Bill) Property = (RV) Property x (Poundage) National – (Reliefs) Property.[4]
Up to 2019-20 the Large Business Supplement (LBS) was applied to properties with an RV greater than the LBS threshold, in addition to the rate applied to properties up to the LBS threshold, effectively increasing the poundage on these properties. In each of the three years 2017-18 to 2019-20 the LBS was 2.6p and the RV threshold was £51,000 i.e. properties with an RV in excess of £51,000 were liable for LBS. On 1 April 2020 the LBS was replaced with two new rates – the Intermediate Property Rate (IPR), equal to the Basic Property Rate (the rate applied to properties with an RV up to and including £51,000) plus 1.3p with an RV threshold of £51,000, and the Higher Property Rate (HPR) equal to the Basic Property Rate plus 2.6p with an RV threshold of £95,000 i.e. properties with an RV in excess of £95,000 were liable for HPR.
As NDR bills in Scotland are directly related to the RV of individual non-domestic properties, changes in the total RV occurring within a revaluation cycle, i.e. between revaluation years, impact on the amount of NDR available for collection, as shown in Table 2.16. Note that the version of Table 2.16 in the associated Excel workbook also shows years prior to 2018-19.
Total RV decreased from £7,358 million at the revaluation on 1 April 2017, to £7,296 million on 1 April 2022. Table 2.16 also shows that before the 2017 revaluation, total RV had increased from £6,719 million on 1 April 2015 to £6,796 million on 1 April 2016. This was due to the net impact of several factors, including increases in the tax base from new properties or extensions of existing properties; and decreases as demolished properties are deleted from the valuation roll or as the RV is reduced as a result of appeals. Statistics on the revaluation appeals are published quarterly in the NDR Revaluation Appeals Statistics publication.
Historically, inflation was a key driver of growth in NDRI, as changes in the poundage had previously typically been tied to either the Retail Price Index (RPI) or the Consumer Price Index (CPI). However, in recent years this has not been the case; for 2019-20 Scottish Ministers set the poundage at 49.0p, a below-inflation increase from the year before, and for 2020-21 the poundage was again increased by less than inflation, to 49.8p, although the increase was completely offset by a 1.6% universal relief which was automatically applied to all properties, as a response to the Covid-19 pandemic, effectively delivering a poundage freeze for that year. For 2021-22 the poundage was reduced to 49.0p, the same as in 2019-20, and in 2022-23 it was set at 49.8p, again a below-inflation increase compared to the year before.
At a revaluation, the poundage is reset bearing in mind the resulting total RV change and the amount of revaluation appeals anticipated over the forthcoming cycle. Revaluations in and of themselves are not intended to be revenue-generating, in fact the 2017 revaluation the poundage set by the Scottish Government led to a decrease in anticipated revenue in real terms over the 2017 revaluation cycle.
Table 2.16 presents total RV at the start of each of the past five financial years, and the poundage for that year. The expanded version, available in the associated Excel file, shows that total RV increased from £6,796 million to £7,358 million between 1 April 2016 and 1 April 2017 – mainly as a result of revaluation, with a decrease in the poundage from 48.4p in 2016-17 to 46.6p in 2017-18.
The exemption of certain properties from paying rates, and the existence of relief schemes, such as the SBBS, can significantly reduce the amount paid in NDR bills, and therefore NDRI, see Chapter 2.3.2.4.
| Category | 2018-19 | 2019-20 | 2020-21 | 2021-22 | 2022-23 |
|---|---|---|---|---|---|
| NDRI, £ millions | 2,847 | 2,761 | 1,816 | 2,108 | 2,792 |
| Total RV at 1 April, £ millions | 7,439 | 7,462 | 7,386 | 7,325 | 7,296 |
| Poundage, pence | 48.0 | 49.0 | 49.8 | 49.0 | 49.8 |
| IPR, £ | n/a | n/a | 1.3 | 1.3 | 1.3 |
| IPR threshold, £ | n/a | n/a | 51,000 | 51,000 | 51,000 |
| LBS / HPR, pence | 2.6 | 2.6 | 2.6 | 2.6 | 2.6 |
| LBS / HPR threshold, £ | 51,000 | 51,000 | 95,000 | 95,000 | 95,000 |
Please note the following:
NDRI figures are contributable income and, as such, reflect the final, audited income figures collected by local authorities, except for 2022-23 which are the notified (provisional outturn) figures as the audits are not yet finalised for all councils. They are net of reliefs paid by Scottish Government, but gross of all local reliefs and top-ups to discretionary amounts paid by councils themselves.
“n/a” indicates years prior to the introduction of the IPR where there were no IPR rates or thresholds. The HPR / LBS and the IPR are applied in addition to the poundage for properties with an RV over the HPR / LBS or IPR threshold.
Source: NDRI Audited Returns and Scottish Assessors Valuation Roll
2.3.2.3 Rates Retention Schemes
Two policy initiatives that directly link to the amount of NDR collected are: the Business Rates Incentivisation Scheme (BRIS), since 2023-24 called the Non-Domestic Rates Incentivisation Scheme (NDRIS), and Tax Incremental Financing (TIF).
BRIS was introduced from April 2012 to incentivise local authorities to maximise existing NDRI and attract new economic growth. BRIS allows all local authorities that exceed their annual NDR buoyancy target, the target percentage increase in their tax base, to benefit from receiving additional grant, equal to 50 per cent of any additional NDRI. In effect, this means that only 50 per cent of the additional NDRI attributable to the increased buoyancy is deducted from the GRG.
This increased funding is carried forward between revaluation years, with each year’s increased funding being carried forward to the next year and added to any new retention awarded, assuming the previous year’s income is maintained. In 2021-22, the total amount of additional funding received under this scheme was £1.6 million (relating to 2019-20 payment amounts). The BRIS scheme was suspended for the period 2020-21 to 2022-23, as reliefs introduced during the Covid-19 pandemic significantly decreased NDRI in all local authorities.
The Scottish Government is also piloting TIF which allows local authorities to fund public sector infrastructure, which unlocks private sector investment, contributing to sustainable and inclusive economic growth. This growth is funded from future incremental NDRI that is expected to be generated as a result of attracting more businesses into the area thanks to the upfront public sector enabling investment.
TIF is currently being piloted through secondary legislation under existing provisions of the Local Government Finance Act (1992) in four local authorities: Argyll & Bute, Falkirk, Fife and Glasgow. Of these four pilots, Argyll & Bute, Falkirk and Fife reported TIF income in 2022-23. They collectively retained a total of £2.7 million NDRI in 2022-23.
2.3.2.4 NDR Reliefs
There are a number of types of NDR relief that reduce the NDR bill for properties receiving it. More information on NDR reliefs in 2022-23 can be found in Finance Circular 4/2022, and the NDR Relief Statistics 2022 publication provides details of reliefs awarded as at 1 July 2022.
Table 2.17 shows the amount of relief provided for the main types of relief available for each year between 2018-19 and 2022-23. Local reliefs and the elements of discretionary reliefs funded by local authorities are not included.
The gross amount of relief provided has increased from £733,801 million in 2018-19 to £781,398 million in 2022-23. Key reasons for this increase in total relief costs include:
- changes to the poundage;
- changes to the tax base due to recent growth in overall RV and increase in overall RV at revaluation;
- changes in relief entitlement;
- an increased awareness of relief schemes; and
- the introduction of new reliefs.
Following the 2017 revaluation, a transitional relief scheme was introduced for pubs, hotels and restaurants (capped at a RV threshold of £1.5 million from 2018-19), and for offices in Aberdeen City and Aberdeenshire. A relief for day nurseries and the Business Growth Accelerator (BGA) relief for new and improved properties were both introduced in 2018-19.
In April 2020, two new reliefs were introduced to help businesses impacted by the Covid-19 pandemic: a 1.6% universal relief, and a 100% relief for Retail, Hospitality, Leisure, and Aviation (RHLA).
RHLA relief continued in 2021-22 though it became application-based (rather than automatically awarded, as it had been in 2020-21). In 2022-23 the relief was no longer available for Aviation (becoming the RHL relief) and was continued for the first 3 months only, capped at £27,500 per ratepayer, and was discontinued from 1 July 2022. The 1.6% universal relief was only available in 2020-21.
While the value of the RHLA relief and the 1.6% universal relief in 2020-21 was just over £1 billion, some ratepayers subsequently returned the value of those reliefs to the Scottish Government. As published in Coronavirus (COVID-19): Scottish business support funding summary, the Scottish Government received payments from relief recipients totalling £177.4 million, reflecting the support that was automatically provided through the RHLA relief and 1.6% universal relief in 2020-21 to these ratepayers.
Table 2.17 shows a decrease in the value of reliefs in 2022-23 compared to 2021-22. As noted above, from 1 April 2022, the RHL relief was available for the first 3 months of the year.
| Relief Type | 2018-19 | 2019-20 | 2020-21 | 2021-22 | 2022-23 |
|---|---|---|---|---|---|
| Empty Property Relief | 92,904 | 87,500 | 78,670 | 88,070 | 95,471 |
| Charity Relief | 218,977 | 224,813 | 223,189 | 214,028 | 215,900 |
| Sports Club Relief | 15,739 | 15,747 | 14,783 | 13,140 | 14,717 |
| Disabled Rates Relief | 64,354 | 64,778 | 64,266 | 63,810 | 63,459 |
| SBBS | 261,684 | 278,055 | 279,441 | 271,176 | 281,542 |
| Religious Exemptions | 27,129 | 27,581 | 27,402 | 27,481 | 27,812 |
| Rural Relief | 3,946 | 3,914 | 3,822 | 3,775 | 3,888 |
| Renewable Energy Relief | 7,399 | 7,266 | 6,439 | 8,010 | 8,062 |
| New Start Relief | 447 | 172 | n/a | n/a | n/a |
| Fresh Start Relief | 1,690 | 3,812 | 2,321 | 4,086 | 5,970 |
| Transitional Relief | 11,899 | 5,243 | 36 | 13 | 169 |
| Day Nursery Relief | 9,604 | 9,788 | 9,601 | 9,762 | 10,095 |
| BGA - Unoccupied New Build | 5,660 | 3,468 | 2,973 | 2,304 | 1,905 |
| BGA - New Occupied & Improved | 11,207 | 31,713 | 10,519 | 12,978 | 22,416 |
| Retail, Hospitality, Leisure (and Aviation for 2020-21 and 2021-22) Relief | n/a | n/a | 941,229 | 640,501 | 27,715 |
| 1.6% Universal Relief | n/a | n/a | 60,062 | n/a | n/a |
| Other | 1,161 | 1,211 | 1,609 | 1,568 | 2,276 |
| Gross Amount | 733,801 | 765,062 | 1,726,363 | 1,360,702 | 781,398 |
Please note the following:
Figures include mandatory and discretionary elements of relief where applicable, but exclude backdated payments of relief and exclude councils own contributions to reliefs.
‘Other’ includes Hardship Relief, Enterprise Areas Relief; District Heating Relief; Mobile Mast Relief (from 2018-19); New Fibre Relief (from 2018-19); and Lighthouse Relief (from 2019-20, previously recorded as a deduction).
“n/a” is used for years prior to a relief being introduced or after a relief is discontinued.
Source: NDRI Audited Returns
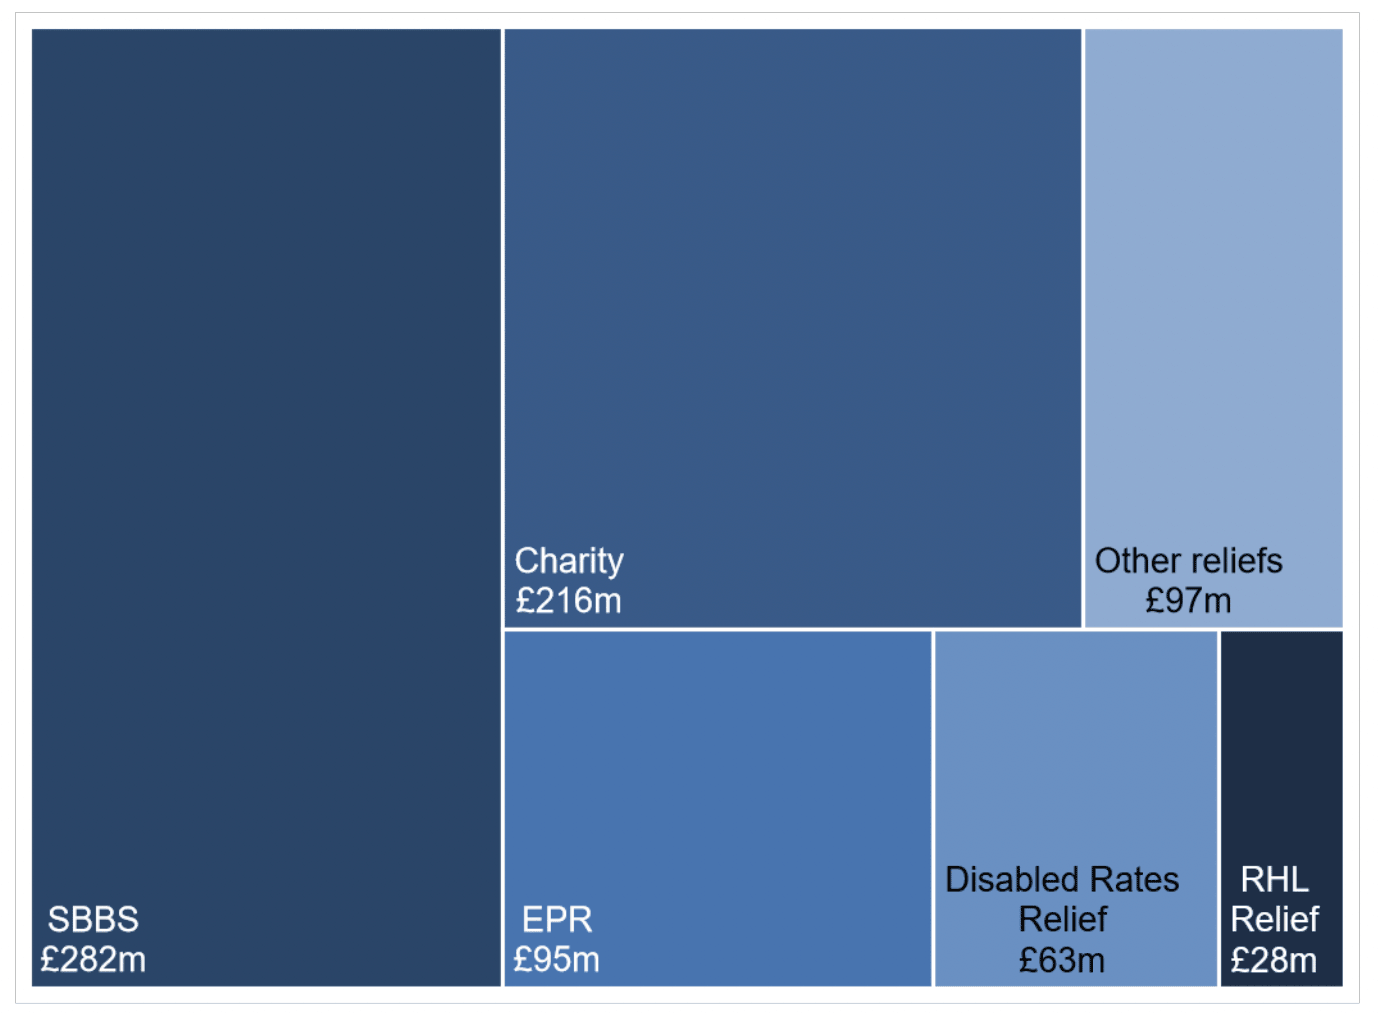
Chart 2.11 shows the values of reliefs awarded during 2022-23. The SBBS, Empty Property and Charity reliefs, including the mandatory reliefs and the parts of the discretionary reliefs which are funded by the Scottish Government, together accounted for £593 million, or around 76 per cent of the total amount of reliefs awarded.
Please note that NDR reliefs reflect the notified income figures collected by local authorities, because the final, audited income figures are not yet available.
Please note that ‘Other’ includes Sports Club Relief; Religious Exemptions; Rural Relief, Renewable Energy Relief; Fresh Start Relief; Transitional Relief; Day Nursery Relief; BGA Reliefs; Hardship Relief; Enterprise Areas Relief; District Heating Relief; Mobile Mast Relief; New Fibre Relief; Reverse Vending Machines Relief; and Lighthouse Relief.
Source: NDRI Notified Returns
2.4 Surplus / Deficit to be met from Reserves
A surplus (-) occurs when a local authority’s revenue expenditure is lower than the amount of service income and general funding available to them. A surplus is added to a local authority’s reserves and carried forward to the next year.
A deficit (+) occurs when a local authority’s revenue expenditure is higher than the amount of service income and general funding available to them. Any deficit must be met from a local authority’s reserves.
The HRA reserve is not permitted to show a deficit at the end of the financial year and if this occurs, local authorities are required to transfer funds from the General Fund to cover this deficit.
Table 2.18 sets out the movement in the General Fund and HRA reserves in 2022-23. At 1 April 2022, local authorities held a total of £3,239 million in their General Fund (including Harbour) and HRA reserves. In year:
- local authorities’ income exceeded their revenue expenditure, resulting in a surplus of £98 million.
- local authorities transferred a total of £15 million out of the General Fund and HRA to other reserves held.
- local authorities’ International Financial Reporting Standard (IFRS) 9 unrealised gains was negligible. IFRS 9 unrealised gains relate to the difference between the fair value of investments compared with their original cost. As the underlying investments have not yet been sold, the net gain is ‘unrealised’ and so is excluded from the revenue reserves balance as this gain is not available to fund future expenditure.
| Movement | General Fund | HRA | Total |
|---|---|---|---|
| Balance as at 1 April 2021 | 3,024 | 215 | 3,239 |
| Add: Surplus (+) or Deficit (-) on provision of services after statutory adjustments | 29 | 70 | 98 |
| Add: Net movements in (+) or out (-) due to transfers between reserves | 91 | -76 | 15 |
| Less: Increase (+) or decrease (-) in IFRS 9 unrealised gains | -36 | 0 | -36 |
| Balance as at 31 March 2022 | 3,179 | 209 | 3,388 |
Please note that balance figures exclude amounts relating to unrealised gains that have been included in revenue reserves applying under IFRS 9: Financial Instruments.
Source: LFR 23
This meant that, overall, the General Fund and HRA increased by £149 million in year, giving a total balance of £3,388 million at 31 March 2023. More information on local authorities’ reserves is provided in Chapter 4.1.
Contact
Email: lgfstats@gov.scot
There is a problem
Thanks for your feedback