Spread of invasive species into Scotland: study
A horizon scanning study involving analysis of pathways of spread of invasive non-native species into Scotland. It considers species having the highest likelihood of arrival and establishment and the magnitude of their potential negative impact on biodiversity and ecosystems over the next 10 years.
Results
Horizon scanning
The compiled long-lists of INNS predicted to arrive, establish and impact biodiversity and ecosystem services, human health and economies are presented in Annexes 3, 4 and 5 respectively. In total 171, 27 and 47 species were included in the long-lists of INNS predicted to have impacts on biodiversity and ecosystem services, human health and economies respectively. The top 10 list, derived through review of the long-list of INNS predicted to have impacts on biodiversity and ecosystems in consultation with NatureScot experts, included two groups of species (flatworms and Dreissena species) alongside a further eight species spanning terrestrial, freshwater and marine environments (Table 2). Five INNS within the top 10 list were freshwater species. Only one marine species was included.
| Species Name | English Name | HS Expert Group |
|---|---|---|
| Anemanthele lessoniana [8] | Pheasant's-tail | Terrestrial plants |
| Corbicula fluminea | Asian clam | Freshwater |
| Dreissena polymorpha | Zebra mussel | Freshwater |
| Dreissena rostriformis bugensis | Quagga mussel | Freshwater |
| Australoplana sanguinea | Australian flatworm | Terrestrial invertebrates |
| Caenoplana variegata (formerly known as C. bicolor) | Southampton flatworm | Terrestrial invertebrates |
| Kontikia andersoni | Brown Kontikia flatworm | Terrestrial invertebrates |
| Obama nungara | Obama flatworm | Terrestrial invertebrates |
| Hydrocotyle ranunculoides | Floating pennywort | Freshwater |
| Muntiacus reevesi | Reeve's muntjac | Terrestrial vertebrates |
| Myriophyllum aquaticum | Parrot's feather | Freshwater |
| Procyon lotor | Raccoon | Terrestrial vertebrates |
| Vaccinium corymbosum (and hybrids) | Highbush blueberry | Terrestrial plants |
| Crepidula fornicata | Mollusc | Marine |
One-third of the INNS on the top 30 list (Table 3) were freshwater species while only three of the species were from the marine environment. There were eight terrestrial invertebrates listed and six terrestrial plants with the remaining three species being terrestrial vertebrates. Most of the top 30 list were assigned the highest impact score of five.
| Species name | English name | HS expert group | Arrival | Estab. | Bio. impact | Overall score |
|---|---|---|---|---|---|---|
| Corbicula fluminea | Asian clam | Freshwater | 5 | 5 | 5 | 125 |
| Dreissena polymorpha | Zebra mussel | Freshwater | 5 | 5 | 5 | 125 |
| Dreissena rostriformis bugensis | Quagga mussel | Freshwater | 5 | 5 | 5 | 125 |
| Gyrodactylus salaris | Salmon fluke | Freshwater | 5 | 5 | 5 | 125 |
| Hydrocotyle ranunculoides | Floating pennywort | Freshwater | 5 | 5 | 5 | 125 |
| Myriophyllum aquaticum | Parrot's feather | Freshwater | 5 | 5 | 5 | 125 |
| Crepidula fornicata | Mollusc | Marine | 5 | 5 | 5 | 125 |
| Agrilus planipennis | Emerald ash borer | Terrestrial invertebrates | 5 | 5 | 5 | 125 |
| Australoplana sanguinea | Flatworm | Terrestrial invertebrates | 5 | 5 | 5 | 125 |
| Caenoplana variegata (formerly known as C. bicolor) | Southampton flatworm | Terrestrial invertebrates | 5 | 5 | 5 | 125 |
| Corythucha arcuata | Oak lace bug | Terrestrial invertebrates | 5 | 5 | 5 | 125 |
| Obama nungara | Obama flatworm | Terrestrial invertebrates | 5 | 5 | 5 | 125 |
| Vespa velutina | Asian hornet | Terrestrial invertebrates | 5 | 5 | 5 | 125 |
| Anemanthele lessoniana | Pheasant's-tail | Terrestrial plants | 5 | 5 | 5 | 125 |
| Baccharis halimifolia [9] | Tree groundsel | Terrestrial plants | 5 | 5 | 5 | 125 |
| Vaccinium corymbosum (and hybrids) | Highbush blueberry | Terrestrial plants | 5 | 5 | 5 | 125 |
| Muntiacus reevesi | Reeve's muntjac | Terrestrial vertebrates | 5 | 5 | 5 | 125 |
| Procyon lotor | Raccoon | Terrestrial vertebrates | 5 | 5 | 5 | 125 |
| Eriocheir sinensis | Chinese mitten crab | Freshwater | 5 | 5 | 4 | 100 |
| Ludwigia grandiflora | Water primrose | Freshwater | 5 | 5 | 4 | 100 |
| Sander lucioperca | Zander | Freshwater | 4 | 5 | 5 | 100 |
| Silurus glanis | Wels catfish | Freshwater | 4 | 5 | 5 | 100 |
| Agarophyton vermiculophyllum (previously Gracilaria vermiculophylla) | Alga | Marine | 5 | 5 | 4 | 100 |
| Homarus americanus | American lobster | Marine | 5 | 5 | 4 | 100 |
| Ips sexdentatus | Terrestrial invertebrates | 5 | 5 | 4 | 100 | |
| Thaumetopoea processionea | Oak processionary | Terrestrial invertebrates | 5 | 5 | 4 | 100 |
| Acer negundo | Box-elder | Terrestrial plants | 5 | 5 | 4 | 100 |
| Ailanthus altissima | Tree of heaven | Terrestrial plants | 5 | 4 | 5 | 100 |
| Elaeagnus pungens | Thorny olive | Terrestrial plants | 5 | 5 | 4 | 100 |
| Nyctereutes procyonoides | Raccoon dog | Terrestrial vertebrates | 5 | 5 | 4 | 100 |
Comprehensive Pathways Analysis
The INNS on the top 10 and top 30 lists were predicted to arrive through a range of pathways (Figure 2). Escape from confinement dominated on both lists with the ornamental and horticultural pathways being the most important pathways in relation to the number of species associated with these pathways.
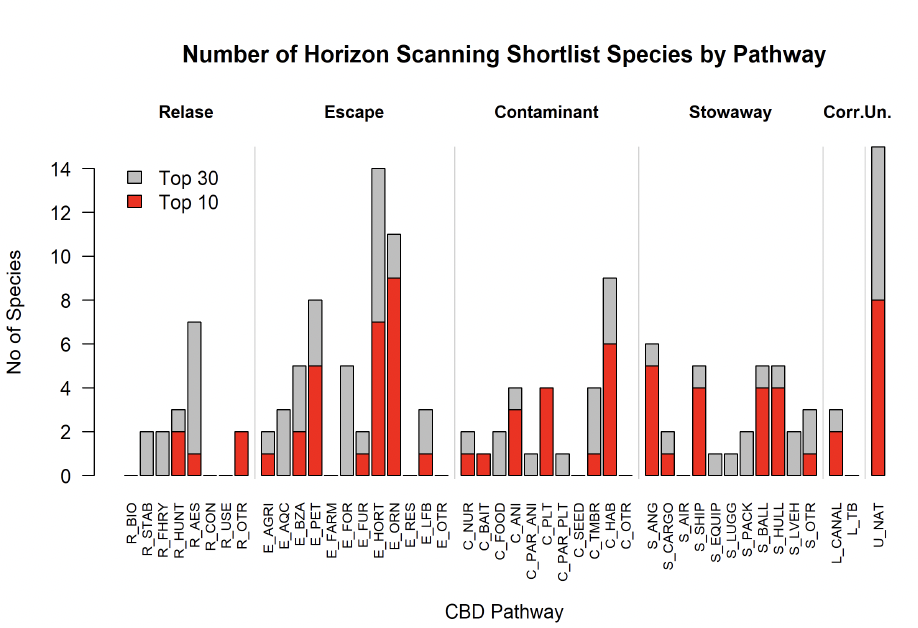
The version of the horizon scanning long list used in the pathway analysis contained three plant species that were later excluded from the long list. This was due to the decision that they were probably now established based on a re-examination of records in the Botanical Society of Britain and Ireland recording database.
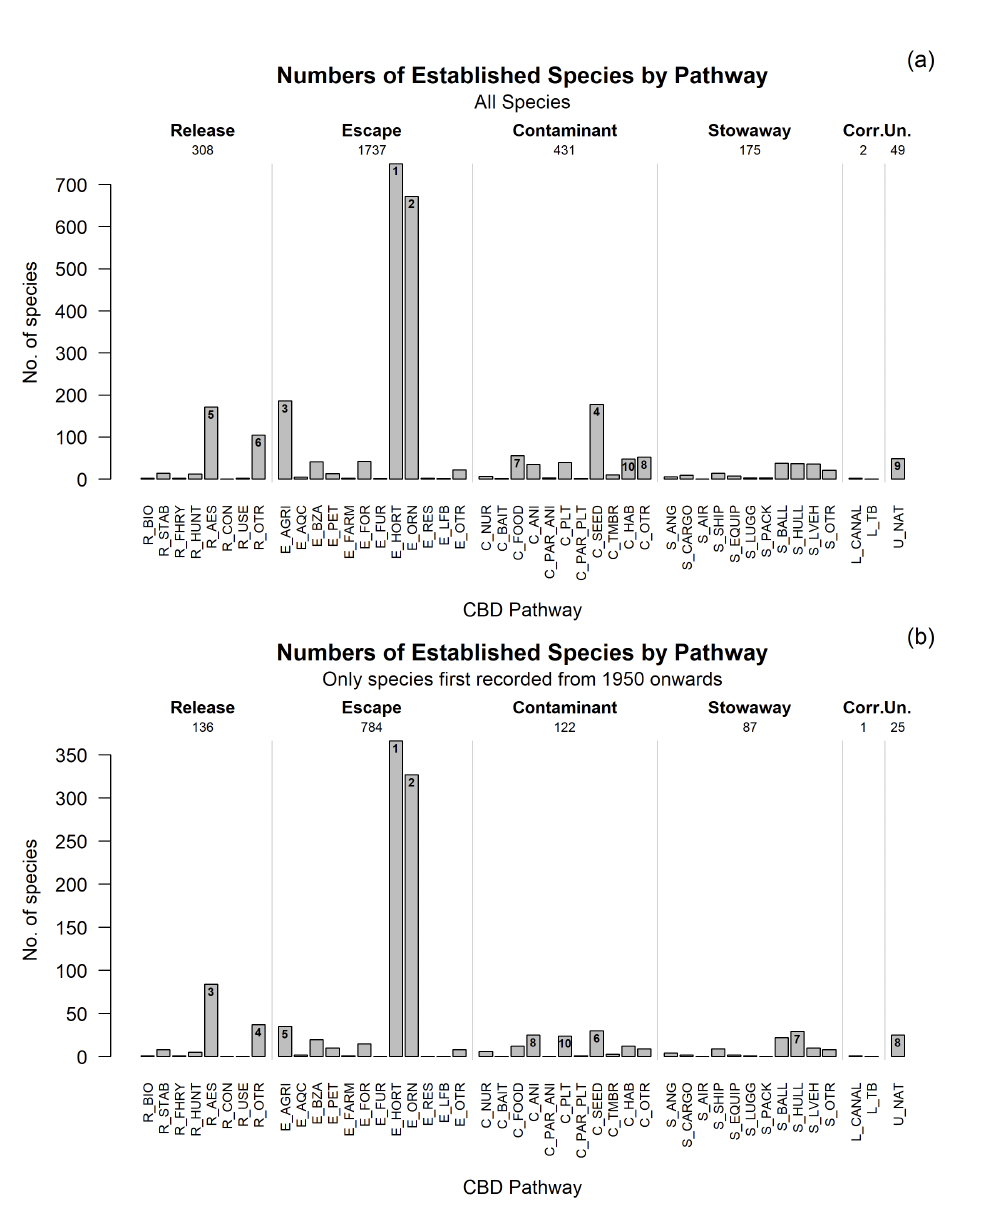
The breakdown of pathways associated with species that are established in Scotland, for all established species (1096 species) and also for only established species that were first recorded in Scotland since 1950 (483 species, hereafter referred to as recently established) is shown in Figure 3. The top 10 pathways for established species and their relative and cumulative contributions are shown in Table 4.
The pathways associated with the highest number of species (for both all established and recently established species) were the horticulture and ornamental pathways ranked 1st and 2nd respectively (Figure 3). These two pathways combined contributed over 50% of the total number of species (52% and 60% for all established and recently established species respectively, see Table 4).
Although notably lower than the horticulture and ornamental pathways, the agriculture, seed contaminant, aesthetic release, and other release pathways were still associated with substantial numbers of established species. These pathways were ranked 3rd, 4th, 5th and 6th for all established species and with 5th, 6th, 3rd and 4th respectively for recently established species. These top six pathways together contributed 76% of total number of species scores.
| Rank | Pathway | No. Species | Proportion | Cumulative Proportion | |
|---|---|---|---|---|---|
| All established species | 1 | Horticulture | 750 | 0.278 | 0.278 |
| 2 | Ornamental | 672 | 0.249 | 0.526 | |
| 3 | Agriculture | 186 | 0.069 | 0.595 | |
| 4 | Seed contaminant | 178 | 0.066 | 0.661 | |
| 5 | Aesthetic release | 171 | 0.063 | 0.724 | |
| 6 | Other release | 105 | 0.039 | 0.763 | |
| 7 | Food contaminant | 56 | 0.021 | 0.784 | |
| 8 | Other contaminant | 52 | 0.019 | 0.803 | |
| 9 | Natural dispersal | 49 | 0.018 | 0.821 | |
| 10 | Habitat material contaminant | 48 | 0.018 | 0.839 | |
| Established species first recorded since 1950 | 1 | Horticulture | 366 | 0.317 | 0.317 |
| 2 | Ornamental | 327 | 0.283 | 0.600 | |
| 3 | Aesthetic release | 84 | 0.073 | 0.673 | |
| 4 | Other release | 37 | 0.032 | 0.705 | |
| 5 | Agriculture | 35 | 0.030 | 0.735 | |
| 6 | Seed contaminant | 30 | 0.026 | 0.761 | |
| 7 | Hull fouling | 29 | 0.025 | 0.786 | |
| 8 | Contaminant of animals | 25 | 0.022 | 0.808 | |
| 8 | Natural dispersal | 25 | 0.022 | 0.829 | |
| 10 | Contaminant of plants | 24 | 0.021 | 0.850 |
In the top 10 ranked pathways the only other pathway in common between the analyses of all established species and recently established species was the natural dispersal pathway which was ranked 9th and 8th (tied) respectively. The remaining pathways in the top 10 ranked pathways for all established species were food contaminant (7th with 56 spp.), other contaminant (8th with 52 spp.) and habitat material contaminant (10th with 48 spp.), while those for the recent established species were; hull fouling (7th with 29 spp.), contaminant of animals (tied 8th with 25 spp.) and contaminant of plants (10th with 24 spp.).
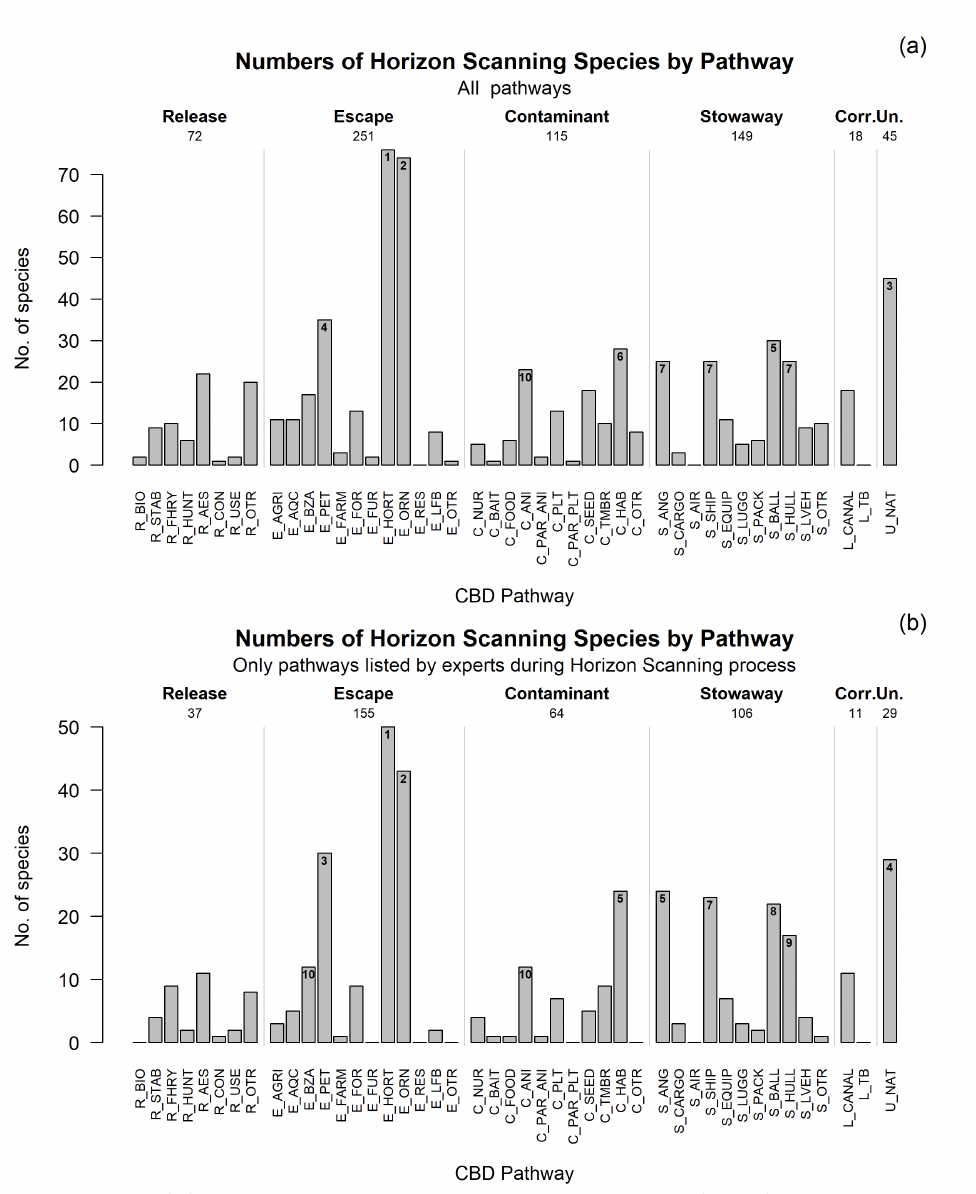
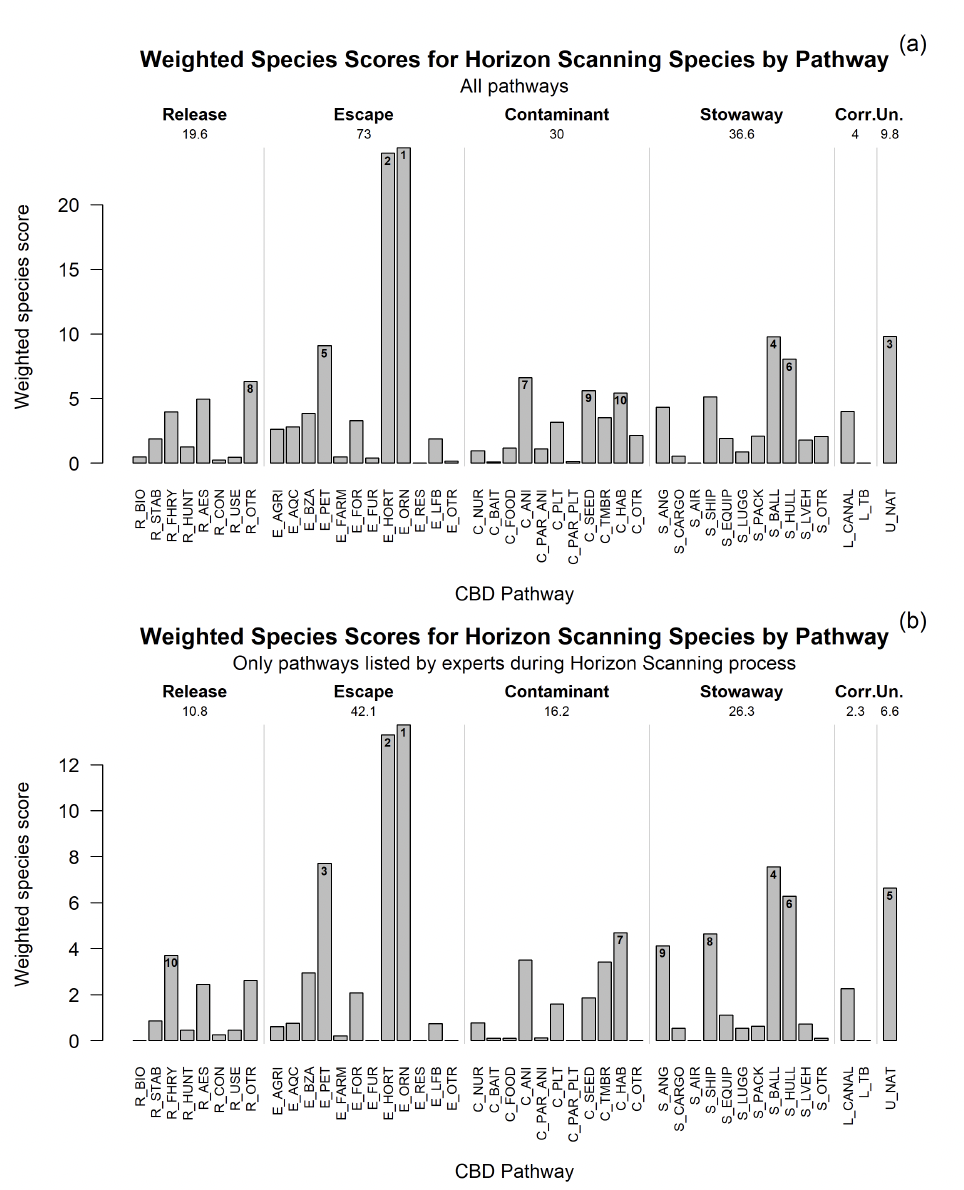
The number of species associated with each pathway for the species on the horizon scanning long list are shown in Figure 4. As with established species, the predominant pathways associated with species on the horizon scanning list were the horticulture and ornamental pathways (Figure 4). This was the case both when using all possible pathway information or only pathways the expert groups considered relevant for Scotland. The extent to which these two pathways dominated, however, was noticeably less for the horizon scanning species with only 23% percent of the total number of species being contributed by these pathways compared with more than 50% for established species (Tables 4 and 5).
After the ornamental and horticultural pathways, the most important pathways in terms of the number of species for horizon scanning species were natural dispersal and pet pathways, though the ranks differed depending on whether the analysis used all pathways or only those provided by the expert groups (ranked 3 and 4 or 4 and 3 respectively). Other pathways that were ranked in the top 10 for the horizon scanning list were, ballast water; habitat material contaminant; fishing equipment; ship excluding ballast water or hull fouling; hull fouling and contaminant of animals, though their exact ranks differed depending upon whether the analysis used all pathways or only expert contributed information on pathways.
Overall, for the 171 horizon scanning species (noting exclusion of three plant species considered established based on a re-examination of records in the Botanical Society of Britain and Ireland recording database) the contributions made by pathways other than horticulture and ornamental were notably larger and more evenly distributed amongst pathways than was the case for the established non-native species, where much of the data was dominated by relatively few pathways. As an example, the stowaway pathway appeared to be associated with a greater proportion of the species from the horizon scanning list than for species already established in Scotland. Indeed, four stowaway pathways (fishing equipment, ship excluding ballast water or hull fouling, ballast water and hull fouling) make the top 10 (Table 5). This is in contrast to the established species where only one stowaway pathway (hull fouling) made the top 10 (7th) and this was only in the analysis restricted to recent established species. In addition, pathways such as pet and natural dispersal were much more important for the horizon scanning species, where they were both high in the top 10, than for the established non-native species where only natural dispersal is in the top 10.
| Rank | Pathway | No. Species | Proportion | Cumulative Proportion | |
|---|---|---|---|---|---|
| All pathways | 1 | Horticulture | 76 | 0.117 | 0.117 |
| 2 | Ornamental | 74 | 0.114 | 0.231 | |
| 3 | Natural dispersal | 45 | 0.069 | 0.300 | |
| 4 | Pet | 35 | 0.054 | 0.354 | |
| 5 | Ballast water | 30 | 0.046 | 0.400 | |
| 6 | Habitat material contaminant | 28 | 0.043 | 0.443 | |
| 7 | Fishing equipment | 25 | 0.038 | 0.482 | |
| 7 | Ship exc. ballast water or hull fouling | 25 | 0.038 | 0.520 | |
| 7 | Hull fouling | 25 | 0.038 | 0.558 | |
| 10 | Contaminant of animals | 23 | 0.035 | 0.594 | |
| Expert pathways | 1 | Horticulture | 50 | 0.124 | 0.124 |
| 2 | Ornamental | 43 | 0.107 | 0.231 | |
| 3 | Pet | 30 | 0.075 | 0.306 | |
| 4 | Natural dispersal | 29 | 0.072 | 0.378 | |
| 5 | Habitat material contaminant | 24 | 0.060 | 0.438 | |
| 5 | Fishing equipment | 24 | 0.060 | 0.498 | |
| 7 | Ship excluding ballast water or hull fouling | 23 | 0.057 | 0.555 | |
| 8 | Ballast water | 22 | 0.055 | 0.609 | |
| 9 | Hull fouling | 17 | 0.042 | 0.652 | |
| 10 | Botanical gardens & Zoos | 12 | 0.030 | 0.682 | |
| 10 | Contaminant of animals | 12 | 0.030 | 0.711 |
Analysis using weighted number of species
The relative importance of pathways using the weighted species score was similar to that using the unmodified number of species scoring, though rankings of some pathways changed slightly (Figure 5). This appears to be the case when considering all established species or only established species that were first recorded after 1950.
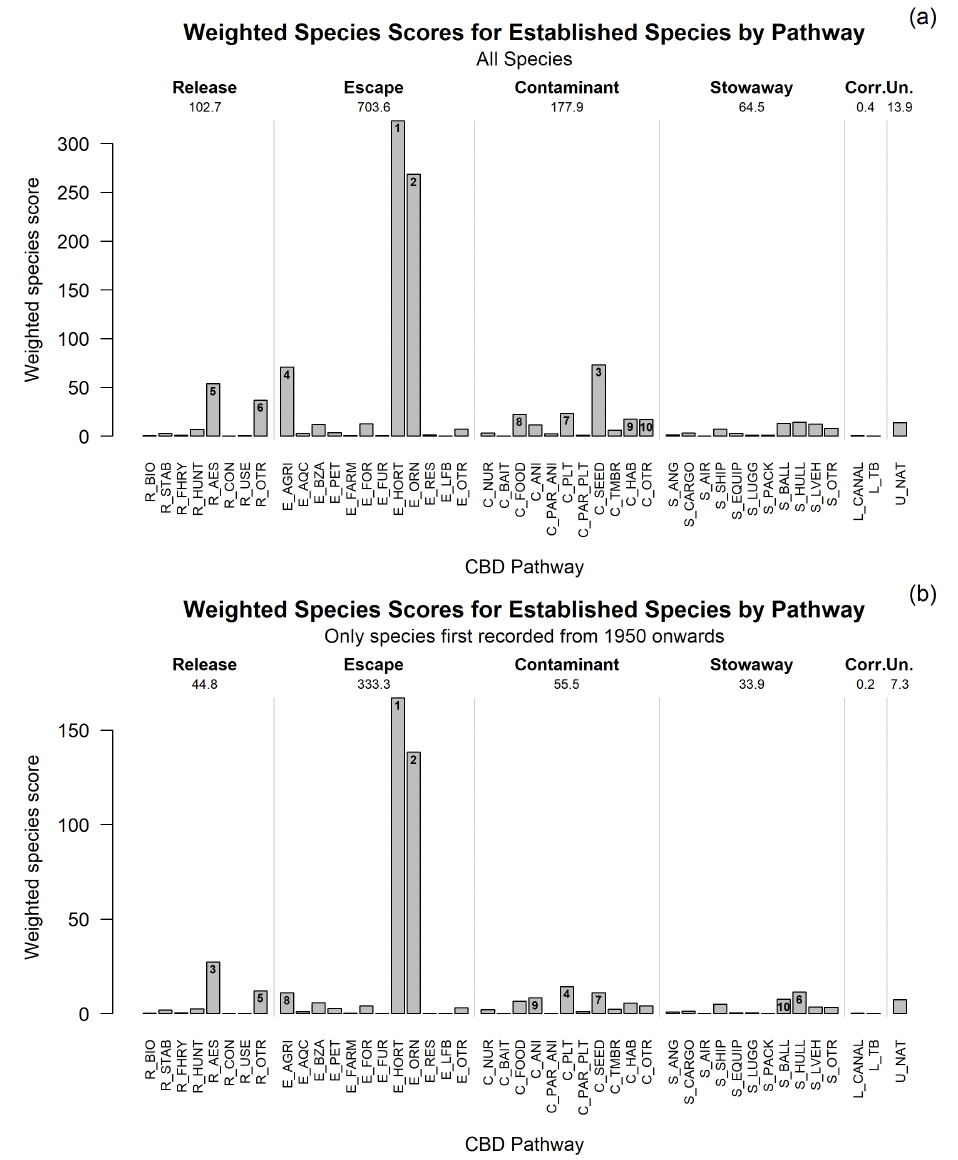
The horticulture and ornamental pathways were the most important pathways, ranked 1st and 2nd respectively. Together these pathways contributed a notable proportion of the total weighted species scores. The contribution of these pathways appeared to be slightly greater when using the weighted species score, with them explaining 56% (all established) and 64% (recently established) of the total weighted scores compared with 53% and 60% for the unmodified number of species scores (Tables 4 and 6).
For all established species the pathways in the top 10 using the weighted scores were almost the same as when using the unmodified total number of species, though the ranks changed slightly, and the natural dispersal category was lost while the contaminant of plants was gained. The agriculture and seed contaminant pathways switched ranks (ranked 4th and 3rd respectively), while the food contaminant and other contaminant pathways were ranked lower (now 8th and 10th) and habitat material contaminant increased to 9th position.
The natural dispersal category was also lost from the top 10 for the recently established species, though in this case the new pathway in the top 10 was the ballast water pathway which appeared at 10th place. For recently established species the other changes in the top 10 using weighted species score instead of the raw total number of species is the reduction in ranks of the other release (4th to 5th), agriculture (5th to 8th) and the contaminant of animals pathways (8th to 9th) along with the increase in ranks of the contaminant of plants (10th to 4th) and hull fouling pathway (7th to 6th).
The proportion of data cumulatively explained by pathways in the top 10 was relatively independent of whether the rankings used the raw number of species or weighted species scores, with the values now being 85% and 86% for all established species and recent established species respectively (Table 6).
| Rank | Pathway | Weighted No. Species Score | Proportion | Cumulative Proportion | |
|---|---|---|---|---|---|
| All established species | 1 | Horticulture | 323.6 | 0.304 | 0.304 |
| 2 | Ornamental | 268.4 | 0.253 | 0.557 | |
| 3 | Seed contaminant | 73.3 | 0.069 | 0.626 | |
| 4 | Agriculture | 70.8 | 0.067 | 0.693 | |
| 5 | Aesthetic release | 53.8 | 0.051 | 0.743 | |
| 6 | Other release | 37.0 | 0.035 | 0.778 | |
| 7 | Contaminant of plants | 23.6 | 0.022 | 0.800 | |
| 8 | Food contaminant | 22.3 | 0.021 | 0.821 | |
| 9 | Habitat material contaminant | 17.5 | 0.016 | 0.838 | |
| 10 | Other contaminant | 17.1 | 0.016 | 0.854 | |
| Established species first recorded since 1950 | 1 | Horticulture | 166.9 | 0.351 | 0.351 |
| 2 | Ornamental | 138.3 | 0.291 | 0.642 | |
| 3 | Aesthetic release | 27.4 | 0.058 | 0.700 | |
| 4 | Contaminant of plants | 14.4 | 0.030 | 0.730 | |
| 5 | Other release | 12.2 | 0.026 | 0.756 | |
| 6 | Hull fouling | 11.4 | 0.024 | 0.780 | |
| 7 | Seed contaminant | 11.2 | 0.023 | 0.803 | |
| 8 | Agriculture | 11.1 | 0.023 | 0.827 | |
| 9 | Contaminant of animals | 8.4 | 0.018 | 0.845 | |
| 10 | Ballast water | 7.6 | 0.016 | 0.860 |
Although the general patterns in the relative contributions of the pathways were similar between the two scoring metrics (raw number of species and weighted species score) for the data for horizon scanning species, the exact rankings for pathways did vary more (Figure 6). The horticulture and ornamental pathways were still the top 2 pathways ranked 1st and 2nd respectively. Together, these pathways explained a notable proportion of the total weighted score (28% and 26%) for all pathways and only expert supplied pathways, respectively (Table 7). These values were similar to those obtained using the raw number of species to rank pathways which was 23% for both. The other pathways, and their relative ranks, within the top 10 were less consistent.
Based on all pathways data for the horizon scanning species three pathways, seed contaminant, angling and ship excluding ballast water or hull fouling, were lost from the top 10 and two gained, other release (8th) and seed contaminant (9th), when changing the scoring metric from the raw number of species to the weighted species scores. A similar situation was found for the rankings using only the expert supplied pathways where two pathways dropped out of the top 10, botanical gardens & zoos and contaminant of animals, and one, fishery in the wild (10th), gained.
| Rank | Pathway | Weighted No. Species Score | Proportion | Cumulative Proportion | |
|---|---|---|---|---|---|
| All pathways | 1 | Ornamental | 24.4 | 0.141 | 0.141 |
| 2 | Horticulture | 24.0 | 0.139 | 0.280 | |
| 3 | Natural dispersal | 9.8 | 0.057 | 0.336 | |
| 4 | Ballast water | 9.8 | 0.057 | 0.393 | |
| 5 | Pet | 9.1 | 0.053 | 0.446 | |
| 6 | Hull fouling | 8.0 | 0.047 | 0.492 | |
| 7 | Contaminant of animals | 6.6 | 0.038 | 0.530 | |
| 8 | Other release | 6.3 | 0.037 | 0.567 | |
| 9 | Seed contaminant | 5.6 | 0.032 | 0.599 | |
| 10 | Habitat material contaminant | 5.4 | 0.031 | 0.631 | |
| Expert pathways | 1 | Ornamental | 13.7 | 0.132 | 0.132 |
| 2 | Horticulture | 13.3 | 0.128 | 0.259 | |
| 3 | Pet | 7.7 | 0.074 | 0.333 | |
| 4 | Ballast water | 7.6 | 0.073 | 0.406 | |
| 5 | Natural dispersal | 6.6 | 0.064 | 0.469 | |
| 6 | Hull fouling | 6.3 | 0.060 | 0.530 | |
| 7 | Habitat material contaminant | 4.7 | 0.045 | 0.575 | |
| 8 | Ship excluding ballast water or hull fouling | 4.6 | 0.045 | 0.619 | |
| 9 | Fishing equipment | 4.1 | 0.040 | 0.659 | |
| 10 | Fishery in the wild | 3.7 | 0.036 | 0.694 |
Biodiversity impact and overall horizon scanning score
The breakdown of pathways based upon total biodiversity impact scores (Figure 7) and the overall horizon scanning scores (Figure 8) were very similar to those obtained based on the uncorrected number of species with generally the same pathways being shown as most important (Tables 8-9).
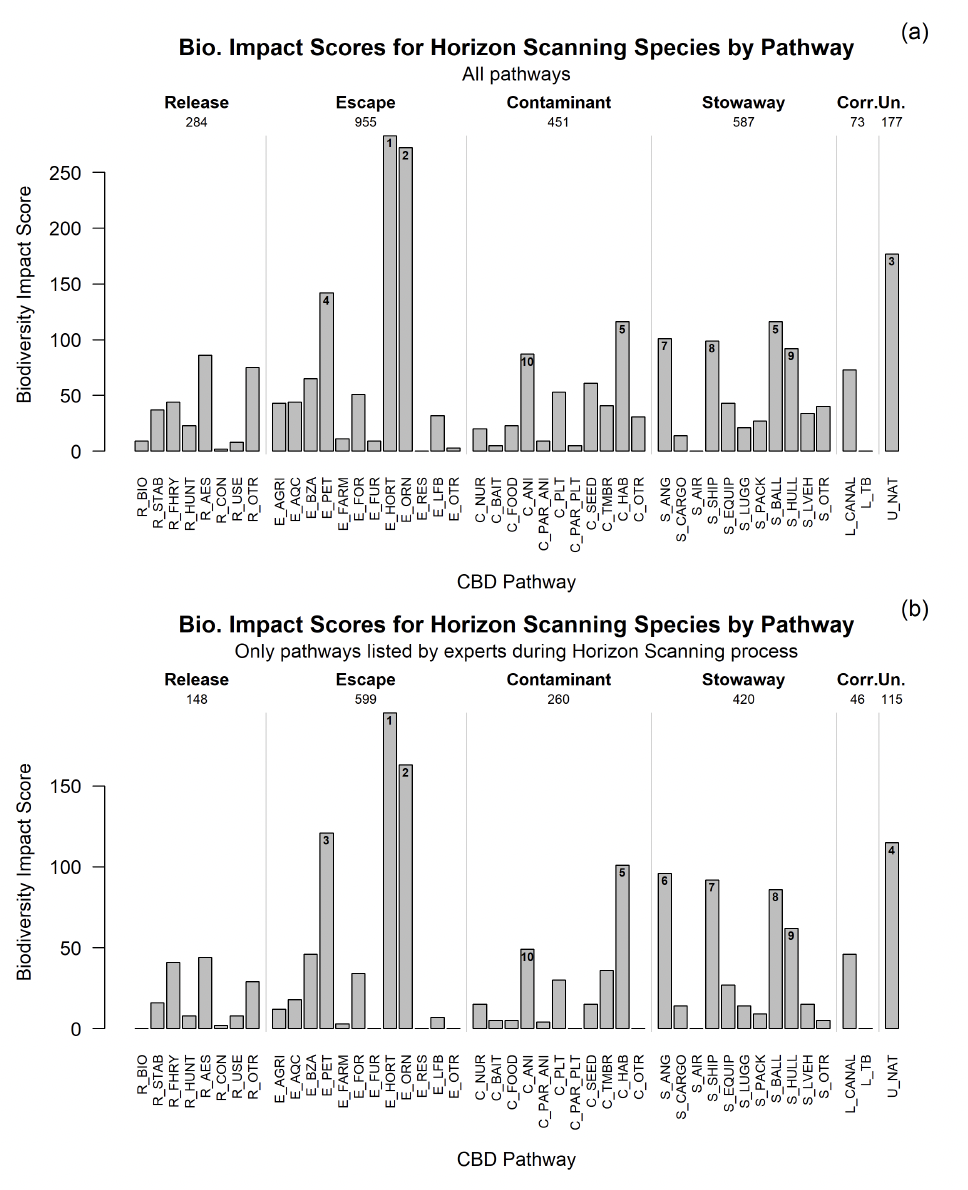
| Rank | Pathway | Biodiversity Impact Score | Proportion | Cumulative Proportion | |
|---|---|---|---|---|---|
| All pathways | 1 | Horticulture | 283 | 0.112 | 0.112 |
| 2 | Ornamental | 272 | 0.108 | 0.220 | |
| 3 | Natural dispersal | 177 | 0.070 | 0.290 | |
| 4 | Pet | 142 | 0.056 | 0.346 | |
| 5 | Habitat material contaminant | 116 | 0.046 | 0.392 | |
| 5 | Ballast water | 116 | 0.046 | 0.438 | |
| 7 | Fishing equipment | 101 | 0.040 | 0.478 | |
| 8 | Ship excluding ballast water or hull fouling | 99 | 0.039 | 0.517 | |
| 9 | Hull fouling | 92 | 0.036 | 0.553 | |
| 10 | Contaminant of animals | 87 | 0.034 | 0.588 | |
| Expert pathways | 1 | Horticulture | 195 | 0.123 | 0.123 |
| 2 | Ornamental | 163 | 0.103 | 0.225 | |
| 3 | Pet | 121 | 0.076 | 0.302 | |
| 4 | Natural dispersal | 115 | 0.072 | 0.374 | |
| 5 | Habitat material contaminant | 101 | 0.064 | 0.438 | |
| 6 | Fishing equipment | 96 | 0.060 | 0.498 | |
| 7 | Ship excluding ballast water or hull fouling | 92 | 0.058 | 0.556 | |
| 8 | Ballast water | 86 | 0.054 | 0.610 | |
| 9 | Hull fouling | 62 | 0.039 | 0.649 | |
| 10 | Contaminant of animals | 49 | 0.031 | 0.680 |
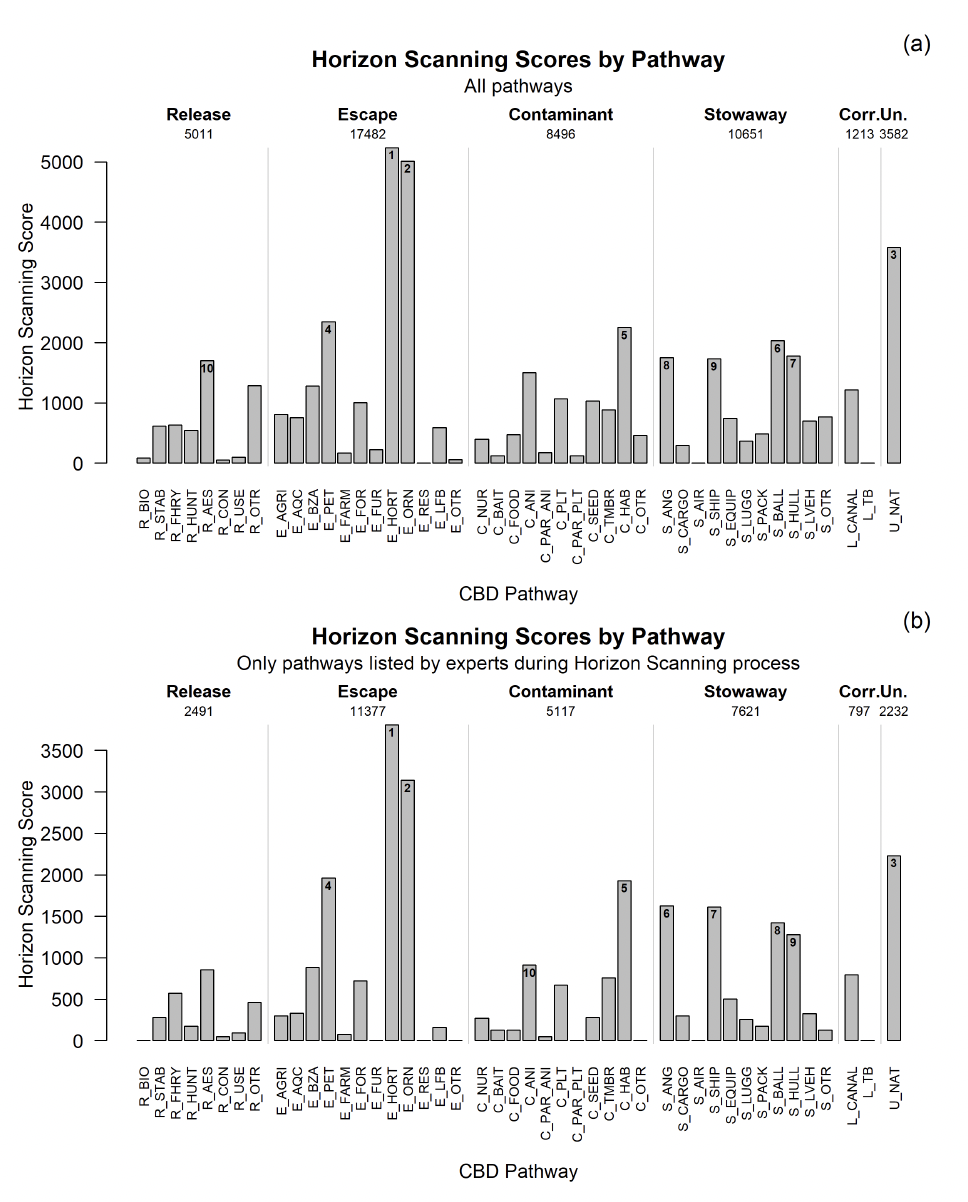
| Rank | Pathway | Horizon Scanning Score | Proportion | Cumulative Proportion | |
|---|---|---|---|---|---|
| All pathways | 1 | Horticulture | 5237 | 0.113 | 0.113 |
| 2 | Ornamental | 5012 | 0.108 | 0.221 | |
| 3 | Natural dispersal | 3582 | 0.077 | 0.298 | |
| 4 | Pet | 2345 | 0.051 | 0.348 | |
| 5 | Habitat material contaminant | 2250 | 0.048 | 0.397 | |
| 6 | Ballast water | 2033 | 0.044 | 0.441 | |
| 7 | Hull fouling | 1780 | 0.038 | 0.479 | |
| 8 | Fishing equipment | 1751 | 0.038 | 0.517 | |
| 9 | Ship excluding ballast water or hull fouling | 1734 | 0.037 | 0.554 | |
| 10 | Aesthetic release | 1698 | 0.037 | 0.591 | |
| Expert pathways | 1 | Horticulture | 3806 | 0.128 | 0.128 |
| 2 | Ornamental | 3138 | 0.106 | 0.234 | |
| 3 | Natural dispersal | 2232 | 0.075 | 0.310 | |
| 4 | Pet | 1960 | 0.066 | 0.376 | |
| 5 | Habitat material contaminant | 1930 | 0.065 | 0.441 | |
| 6 | Fishing equipment | 1626 | 0.055 | 0.496 | |
| 7 | Ship excluding ballast water or hull fouling | 1614 | 0.054 | 0.550 | |
| 8 | Ballast water | 1421 | 0.048 | 0.598 | |
| 9 | Hull fouling | 1277 | 0.043 | 0.641 | |
| 10 | Contaminant of animals | 911 | 0.031 | 0.672 |
Correlations between rankings
The relative importance of the pathways, particularly for the higher ranking pathways was similar between all and recently established species (Figure 9a), with a reasonably high correlation coefficient (τ = 0.821). This suggests that the rankings of the pathways associated with the recently established species are similar to those associated with all of the established species, although there are differences as represented by the points lying further away from the dotted 1:1 line (Figure 9a). The rankings obtained using weighted scores were also found to be highly correlated (τ = 0.869) with rankings using the raw number of species (Figure 9b). Similarly, for horizon scanning species the rankings were highly correlated (τ = 0.819) when comparing rankings using all pathway data against that using only expert supplied pathways (Figure 9c), though there was more divergence from the 1:1 for the pathways near the bottom of the rankings (i.e., least important).
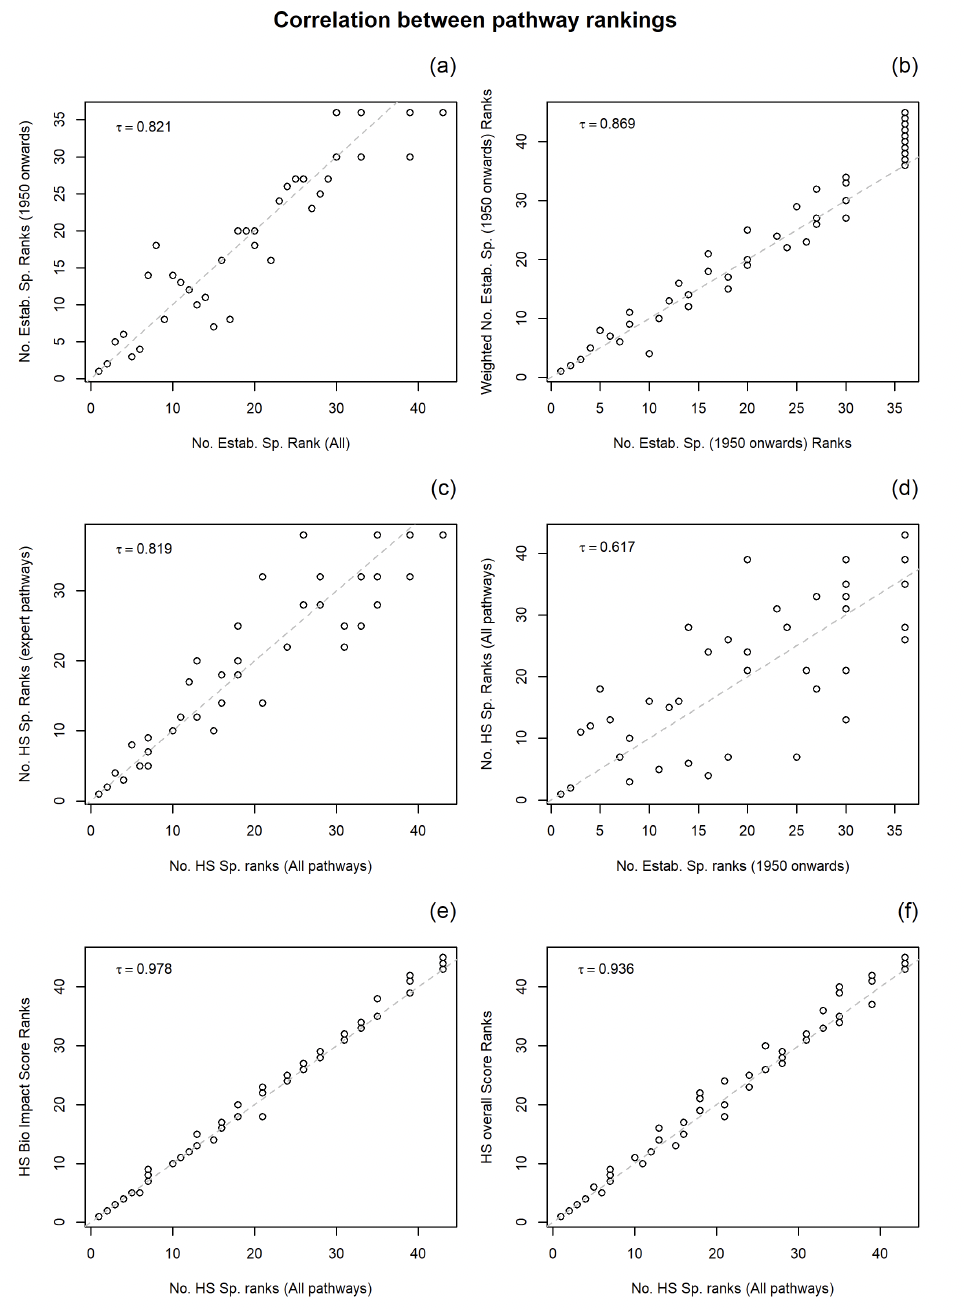
Although there was a correlation (τ = 0.617) between the pathway ranks for recently established species and the horizon scanning species, it was much lower than that for the other pairing and the plot for this pair showed much scatter around the 1:1 line (Figure 9d). The rankings obtained using the biodiversity score and overall horizon score were very highly correlated (τ = 0.978 and 0.936, respectively) with the ranks that used the raw number of species (Figures 9e and 9f).
Contact
There is a problem
Thanks for your feedback