Offshore renewable developments - developing marine mammal dynamic energy budget models: report
A report detailing the Dynamic Energy Budget (DEB) frameworks and their potential for integration into the iPCoD framework for harbour seal, grey seal, bottlenose dolphin, and minke whale (building on an existing DEB model for harbour porpoise to help improve marine mammal assessments for offshore renewable developments.
This document is part of a collection
6 Grey seal DEB model
6.1 Model parameters
Table 6 shows the parameter values used in most of the simulations described in this chapter. Details of how these values were derived are outlined below.
| Parameter names | Code name | Value | Description | Source |
|---|---|---|---|---|
| Resource density | ||||
| R | Rmean | 1.63 | Annual mean resource density | See text |
| abeta | a_beta | 23.65 | Shape parameters of beta distribution defining stochasticity in resource density | See text |
| bbeta | b_beta | 19.35 | See text | |
| amplitude | 0.1 | Parameter defining the amplitude of seasonal variation in resource density | See text | |
| offset | 184 days | Parameter determining when during the year Rmean has its maximum value | See text | |
| Timing of life history events | ||||
| min_age | min_age | 3 years | Minimum age for reproduction | |
| mean_birthday | mean_birthday | 23 November | Mean pupping date for Farne Islands grey seals | Boyd (1984) |
| TP | Tp | 240 days | Gestation period | Hall and Russell (2018) |
| TL | Tl | 18 days | Age at weaning (duration of lactation) | Hall and Russell (2018) |
| TR | Tr | 100 days | Age at which calf’s resource foraging efficiency is 50% | See text |
| max_age | max_age | 40 years | Maximum age | Hall and Russell (2018) |
| max_age_calf | 345 days | Maximum modelled age of pup | ||
| moult_duration | moult_duration | 20 days | Duration of moult | |
| Reserves | ||||
| ρ | rho | 0.5 | Target body condition for adults | Pomeroy et al. (1999), Lang et al. (2011) ( |
| ρc | rho_C | 0.7 | Target body condition for pups | Pomeroy et al. (1999) |
| θF | Theta_F | 0.2 | Relative cost of maintaining reserves | Hin et al. (2019) |
| Growth | ||||
| L0 | L0 | 89.8 cm | Length at birth | |
| L∞ | Linf | 184 cm | Female maximum length | |
| k | k | 0.0005 | Modified von Bertalanffy growth function: growth rate parameters Von Bertalanffy growth function: length at age zero | McLaren (1993) |
| x0 | x0 | -58.04 | ||
| b | b | 0.27 | ||
| ω1 | omega1 | 1.5x10⁻⁴ kg/cm | Structural mass-length scaling constant | Hauksson (2007) |
| ω2 | omega2 | 2.575 | Structural mass-length scaling exponent | Hauksson (2007) |
| Energetic rates | ||||
| σM | Sigma_M | 2.5 | Field metabolic maintenance scalar | Sparling and Fedak (2004) |
| σG | Sigma_G | 30 MJ/kg | Energetic cost per unit structural mass | Derived using the approach of Hin et al. (2019) |
| ε | epsi | 25.8 MJ/kg | Energy density of reserve tissue | Reilly et al. (1996) |
| ε- | epsi_minus | 23.2 MJ/kg | Catabolic efficiency of reserves conversion | |
| ε+ | epsi_plus | 35.5 MJ/kg | Anabolic efficiency of reserve conversion | |
| ε+pups | epsi_plus_pups | 28.5 MJ/kg | Anabolic efficiency of reserve conversion for pups | |
| μs | mu_s | 0.2 | Starvation mortality scalar | Hin et al. (2019) |
| η | eta | 40 | Steepness of assimilation response | See text |
| ϒ | upsilon | 1.62 | Shape parameter for effect of age on resource foraging efficiency | See text |
| K | Kappa | 0.8 | Proportion of the daily assimilated energy allocated to growth | See text |
| moult_reduction | 0.5 | Reduction in resource assimilation during moult | Paterson et al. (2012) | |
| moult_duration | 20 days | Duration of moult | ||
| Pregnancy | ||||
| fert_success | fert_success | 1 | Probability that implantation will occur | See text |
| decision_day | decision_day | 200 | Day of pregnancy when female decides whether or not to continue | See text |
| Lactation | ||||
| φL | phi_L | 8.85 | Lactation scalar | See text |
| σL | Sigma_L | 0.86 | Efficiency of conversion of mother’s reserves to calf tissue | Lockyer (1993) |
| TN | Tc | 17 days | Pup age at which female begins to reduce milk supply | See text |
| lact_feed | lact_feed | N/A | Day of lactation when female starts foraging | |
| R_prop_lactation | R_prop_lactation | N/A | Female foraging efficiency during lactation | |
| ξM | xi_m | 2 | Non-linearity in female body condition-milk provisioning relation | See text |
| pw_fast | pw_fast | 21 days | Duration of post-weaning fast | |
| Mortality | ||||
| foetal_mortality | foetal_mortality | 0.0 | Background foetal mortality | |
| α1 | alpha1 | 0.007 | Coefficients of age-dependant mortality curve | Thomas et al. (2019) |
| α2 | alpha2 | 1.3 x 10⁻⁴ | ||
| β1 | beta1 | 0.01 | ||
| β2 | beta2 | 10-7 | ||
| ρS | rho_s | 0.1 | Starvation body condition threshold | See text |
| μs | mu_s | 0.2 | Starvation mortality scalar | See text |
| Disturbance | ||||
| Distdur | days.of.disturbance | Number of days on which disturbance occurs | See text for values | |
| Diststart | first_day | First day of disturbance period | See text for values | |
| Distend | Last_day | Last day of disturbance period | See text for values | |
| Disteffect | disturbance.effect | 0.25 | Reduction in resource density caused by disturbance | |
| AgeDist | age.affected | Age threshold defining which age class of simulated animals is affected by the disturbance | See text | |
6.1.1 Resources
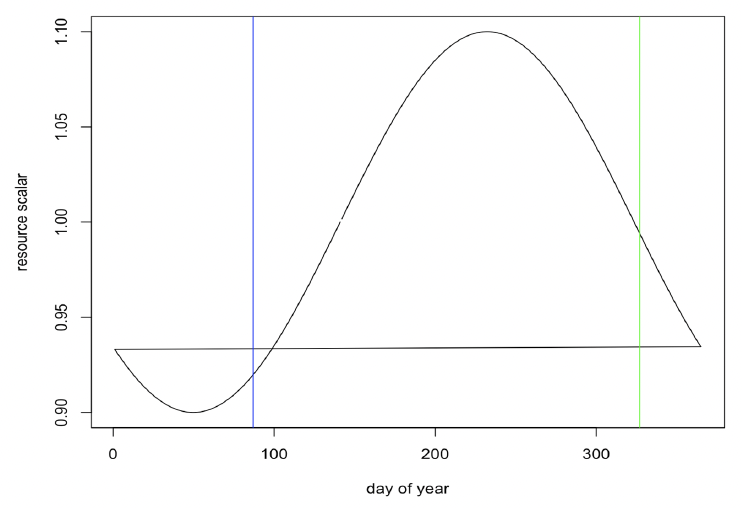
Resource density (R) The observed variations in the body condition of female grey seals in the UK over the course of the year suggest that resource density varies seasonally. For example, (Boyd, 1984) found that female grey seals did not increase their weight from the end of lactation until the moult, approximately 4 months later, and Hall and McConnell (2007) found that grey seals pups did not increase their weight over the same calendar period. These results suggest that resource density is relatively low during this period. Presumably, resource density increases thereafter so that reproducing females can accumulate the reserves they need to fuel lactation. We therefore assumed that resource density varies cyclically over the year, with maximum resource density occurring at around the mid-point of pregnancy. For animals with a birthday of around 23 November, this would equate to a peak in resource density in mid-August and a minimum value in mid-February. The predicted pattern of resource density for such animals is shown in Figure 19.
For each simulation, mean resource density was set to a value that resulted in a population growth rate close to the value of 1.01 reported for the UK grey seal population (Sinclair et al. 2020).
6.1.2 Timing of life history events
We used a mean pupping date for each modelled population and assigned a specific birth date for each simulated female. These dates were symmetrically distributed around the mean pupping date. Simulations were started at the start of the 2nd year of life so that we could include the effects of resource density on the survival of a female’s pups to age 1 year in the calculation of individual fitness.
All females that were at least 3 years old were assumed to become pregnant each year, with implantation occurring 125 days (= 365 - gestation period) after that individual’s birthday.
Gestation period (TP) We used a value of 240 days (~ eight months) as suggested by Hall and Russell (2018).
Lactation period/age at weaning (TL) We used the value of 18 days for age at weaning suggested by Hall and Russell (2018).
6.1.3 Reserves and growth
Reserve threshold (ρ) (Boyd 1984) measured the total body weight and sculp (skin + blubber) weight of 72 adult female grey seals collected from the Farne Islands over the course of a year. Mean core weight (body weight – sculp weight) did not vary over the year, once the weight of any foetus was accounted for. Total body weight was at a minimum at the end of lactation and did not begin to increase until after implantation of the embryo; thereafter it increased to a maximum in mid-August, when sculp weight was around 42% of total body weight. Pomeroy et al. (1999) documented a mean decline in weight of 67 kg over the course of lactation for females whose mean weight at the start of lactation was 185 kg. Lang et al. (2011) estimated that lipid made up 31-34% of the total mass of Canadian grey seal females 3 days post-partum. We calculated that the equivalent post-partum values were 33-36% lipid. Hanson et al. (2019) found that lipid made up only 27% of the post-partum mass of UK grey seals. However, these animals lost significant amounts of protein during lactation, whereas the Canadian animals lost very little. This suggests that, at least for UK grey seals, tissue other than blubber is also used as reserves. We therefore set ρ to a value of 0.5.
Reserve threshold for pups (ρC) The mean weight of grey seal pups at North Rona increased from around 16 kg at birth to around 43.5 kg at weaning (Pomeroy et al. 1999). We assumed that almost all of this increase was in reserve tissue, since the increase in core tissue predicted from our modification of McLaren’s (1993) growth curve was only ~ 1 kg. This suggests that ρ at weaning is around 0.65, and we used a slightly higher value (0.7) as the target level for pups.
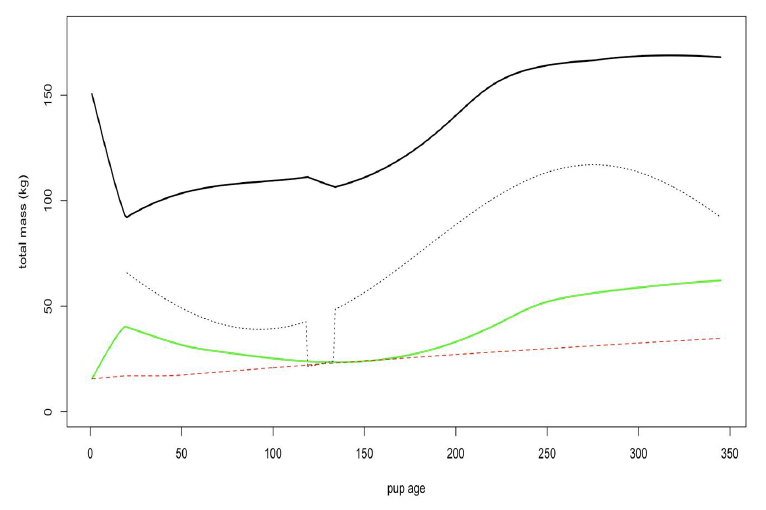
Figure 20 shows predicted variation in the total body mass of a female and her calf over the course of 1 year using these values.
Relative cost of maintaining reserves (ΘF) We were unable to find any published data that would allow a value specific to grey seals to be calculated for this parameter. We therefore used the value of 0.2 assumed by Hin et al. (2019).
Structural length and structural mass (L0, L∞, ω1, ω2, k, xo,) (McLaren, 1993) fitted this modified Von Bertalanffy growth curve to data from 527 female grey seals sampled at the Farne Islands:
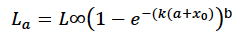
where a is age in days, k = 0.182/365, b = 0.27 and x0 = (- 0.59 x 365). The estimated size at birth (L0) from this equation is 99.3 cm, which is within the range of 90-105 cm reported by Bonner (1981). However, when combined with the formula used below to estimate structural mass, the estimated mass at birth is 21 kg, much higher than the values reported by Pomeroy et al. (1999). Resetting x0 to (– 0.4 x 365) provided a more realistic estimate of 16.1 kg for birth weight, and a value of 89.8 cm for L0.
We modelled foetal growth in terms of TP and L0 as:
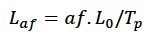
Where af is foetal age in days.
Hauksson (2007) estimated the following relationship between structural length and mass for grey seals from Iceland:
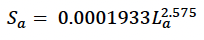
However, mass in this equation includes some reserve tissue. We therefore modified Hauksson’s (2007) equation to:
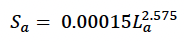
which, when combined with estimates of Fa from the DEB model, gave a predicted mean post-partum mass for mature females of 181.5 kg, close to the values reported by Hanson et al. (2019).
Modelling growth (Κ) The model developed by Hin et al. (2019) assumes that growth in length and core mass continues unabated, regardless of energy intake. This is clearly not the case in grey seals. For example, the weight-at-age of yearling grey seals is highly variable (Hall and McConnell 2007), presumably as a result of variations in foraging success among individuals. We, therefore, assumed that growth in grey seals may be reduced if energy intake is less than the combined costs of metabolism, growth and reproductive activities (pregnancy and lactation). We modelled these circumstances using a modification of the Kappa rule which is a fundamental component of classic DEB models (Kooijman 2010). We assumed that an individual will allocate a proportion of the assimilated energy (It) it acquires on a particular day to growth (including growth of the foetus, because this is treated as part of the female’s core mass), up to a maximum of (1-Κ).It . If this amount of energy is less than the energy required for growth, the growth rate of the female and her foetus is reduced accordingly. The balance of the energy intake is allocated to metabolism. If this is insufficient to cover all of the costs of metabolism, reserves must be metabolised. Values of Κ < 0.5 indicate that growth is prioritised over metabolism. Because there is no empirical information that can be used to estimate a value for K we explored the implications of a wide range of values for this parameter. Mean reproductive success (total number of female offspring born to a female that survived to age 1 year) increased as K approached 1, implying that individuals adopting this trait would come to dominate in any population. Most simulations were conducted with a value of 0.8 for K. However, in Chapter 7 we explore the implications of values of K between 0.7 and 0.9.
Field metabolic maintenance scalar (σM) Sparling et al. (2006) measured the RMR of captive adult and juvenile grey seals based on oxygen consumption and estimated that this was, on average, 1.95x that predicted by Kleiber’s equation. Sparling and Fedak (2004) measured the Diving Metabolic Rate (DMR) of captive grey seals and found that this was 1.7x the RMR predicted by Kleiber’s equation. They note that predictions of FMR of 2-3x the Kleiber value “might be higher than they are in reality”. Most simulations were carried out using a value of 2.5x Kleiber for the entire life history of simulated animals because Reilly et al. (1996) estimated that the FMR of lactating female grey seals was 2.3x Kleiber, and Paterson et al. (2019) estimated that the FMR of moulting phocid seals was also 2.3x Kleiber. However, in Chapter 7 we explore the implications of higher and lower values for this parameter.
Energetic cost per unit structural mass (σG) We calculated growth efficiency using the same approach as Hin et al. (2019) and an energy density for foetal tissue of 6.5 MJ/kg (the mean of the values for new-born harp and grey seal pups reported by Worthy and Lavigne (1987)). This produced a value of 25 MJ/kg for σG.
Catabolic and anabolic efficiency of reserve conversion (ε-, ε+, ε+pups) Results from studies of the weight loss of fasting pinnipeds, described in more detail in Harwood et al. (2019), indicate that the energy density of phocid reserve tissue is 20-25 MJ/kg. In the absence of any direct measurements of these parameters for adult grey seals, we followed Hin et al. (2019) and used a range of values that were 90% of the energy density of reserve tissue for ε- and 40% higher for ε+. Pups convert the lipid rich milk supplied by their mothers to reserve tissue and this process is probably more efficient than the conversion of normal food. We calculated the cost of this process from Reilly et al.’s (1996) estimate that the mean daily energy expenditure of grey seal pups is 13.5 MJ. This includes the costs of metabolism, growth in core tissue and accumulation of reserves. We calculated the mean costs of metabolism and core growth using the DEB model and subtracted these costs from 13.5 MJ to estimate the additional costs of accumulating reserves, which was 2.67 MJ/kg. This suggests that ε+ for pups is 11-13% higher than the energy density of reserves.
Steepness of assimilation response (η) We were unable to find any data in the literature that could be used to set a feasible range for this parameter. We explored the implications of values between 5 and 40 and found that mean reproductive success was maximized when η = 40.
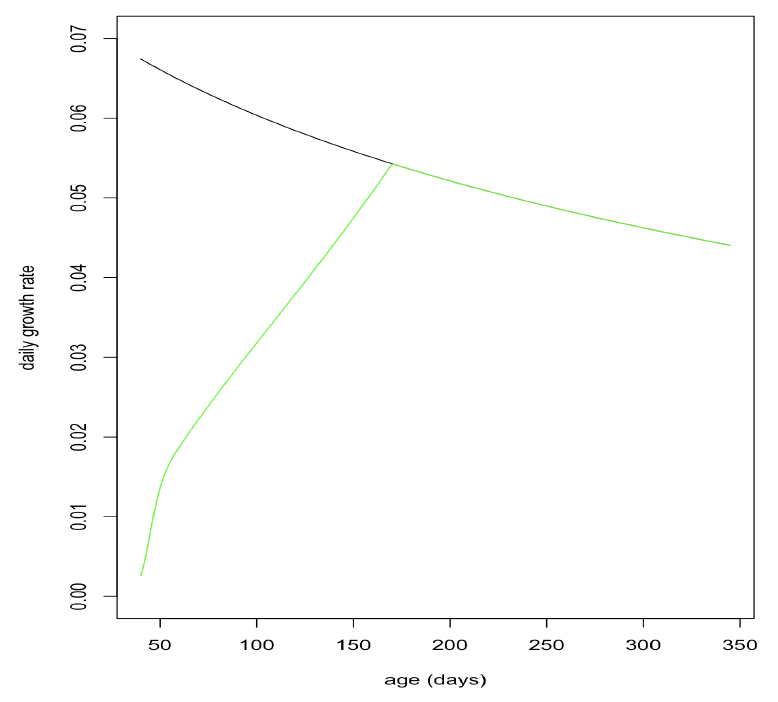
Effect of age on resource foraging efficiency (Υ, TR, pw_fast): Grey pups undertake a post-weaning fast of approximately 21 days (Noren et al. 2008). After this, they continue to lose weight for the next 3 months (Hall and McConnell 2007) but regain their initial weight around the age of 6 months. We assumed that foraging efficiency was 0 up to the age of 39 days (TL + 21) and experimented with various combinations of TR and Υ to see if we could duplicate Hall and McConnell’s (2007) observations while still ensuring that female feeding efficiency was close to 100% by the time they were 5 years old.
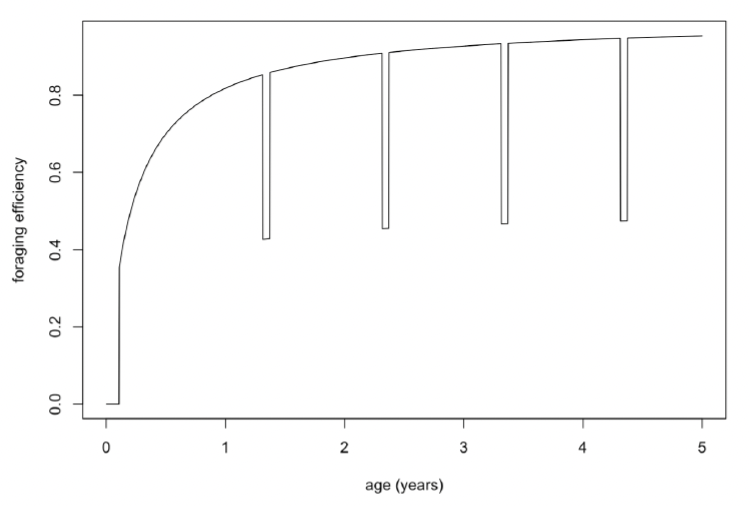
Moult duration and reduction in foraging during moult: To take account of the fact that seals spend more time hauled out when they are moulting (Paterson et al., 2012), and are therefore likely to acquire less energy, we reduced foraging efficiency by 50% for 10 days before and after implantation. Figure 22 shows the resulting variation in foraging efficiency over the first 5 years of life.
6.1.4 Pregnancy
Pregnancy threshold (decision_day) Smout et al. (2019) documented a relationship between a female grey seal’s mass at the end of lactation and the likelihood of giving birth in the following breeding season. The threshold mass that resulted in a 0.5 probability of giving birth was lower if prey abundance was greater than average in the subsequent year. The relationship is:
P{pupping}t+1 = exp(ap + bbεtWj,t)/(1 + exp(ap + bbεtWj,t))
where Wj,t is female mass at weaning in year t. Because Mj,t+1 = δεtWj,t this can be rewritten as:
P{pupping}t+1 = exp(ap + (bb /δ)Mj,t+1)/(1 + exp(ap + (bb /δ)Mj,t+1))
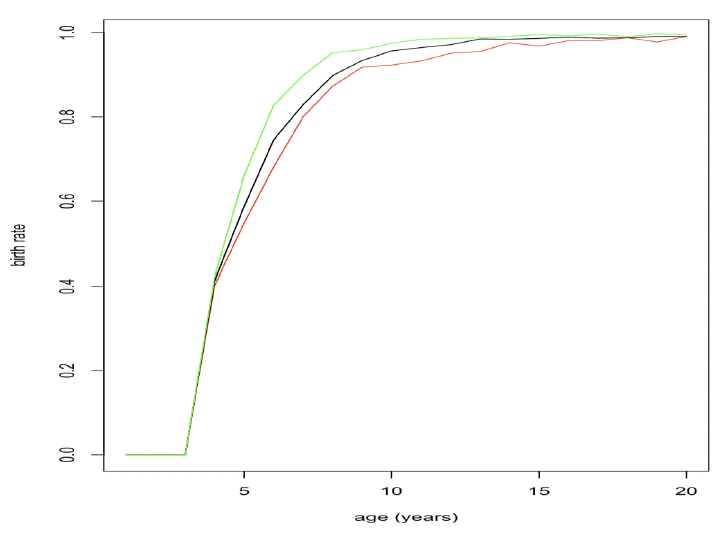
where Mj,t+1 is predicted female post-partum mass in year (t+1), β indicates mass loss during lactation (0.65 at the two colonies studied by Smout et al. 2019), with a tight 95% credible interval), δ is mass gain during pregnancy (estimated as 1.4 at both colonies) and εt is a year effect related to sandeel density or the strength of the North Atlantic Oscillation. Figure 23 shows how resource density affects age-specific birth rates using this relationship.
Given that changes in body mass from the end of lactation until implantation are relatively small (Boyd 1984), the decision to give birth to a pup is probably made some time during pregnancy, rather than at implantation. However, the exact time at which females should make this decision is not entirely obvious and we considered the implications of a making that choice at a number of different points during pregnancy.
6.1.5 Lactation
Efficiency of conversion of mother's reserves to calf/pup tissue (σL): Lang et al. (2011) estimated that approximately 70% of the energy obtained by grey seal pups from milk was converted into tissue. However, this “storage efficiency” includes the costs of maintenance. We therefore used the value of 0.86 from Hin et al. (2019).
Effect of calf/pup age on milk assimilation (TC , ξC) There appears to be little variation in the amount of milk provided to the calf over the duration of lactation, suggesting that TC should be close to TL. We chose values of (TL -1) days and 0.95 for these parameters.
Effect of female body condition on milk provisioning (ξM) Although it would be possible to estimate an appropriate value for this parameter from the raw data generated by Pomeroy et al. (1999) and Bowen et al. (2006), those data are not presented in the relevant papers thus precluding this analysis. Because females are “anticipating” a large reduction in their body condition during lactation we explored the implications of a range of values and found that ξM = 2 best reproduced observed changes in milk delivery.
Lactation scalar (ΦL) All of a grey seal pup’s energy requirements during the lactation period must be supplied by milk. As noted above, Reilly et al. (1996) estimated that grey seal pups expend 13.5 MJ/day during lactation. If pups achieve their target body condition of 0.7 at the end of lactation they will have gained 31 kg. Using this value in Hin et al.’s (2019) formula gives ΦL = 8.85 if ε = 25.8 MJ/kg.
6.1.6 Mortality
Age-dependent mortality rate We followed the approach used by Hin et al. (2019) and estimated changes in the probability of survival with age using the approach developed by Barlow & Boveng (1991). The following function describing the variation in daily survival with age:
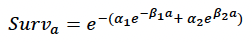
where a is age in days, was fitted to the annual age-specific grey seal survival rates estimated by Thomas et al. (2019). Their population model includes a density-dependent term for first-year survival, and we used the maximum value (0.478) because they assumed density-dependence operates via reduced prey availability. This value is very close to the product of survival from birth to weaning of 0.831 reported by Pomeroy et al. (1999) for grey seal pups at North Rona and the estimate of survival from weaning to age 1 obtained by Hall et al. (2001). Figure 24 shows the resulting relationship between age and cumulative survival, with:
α1 = 0.007
β1 = 0.01
α2 = 0.00013
β2 = 0.000001
and a maximum age of 40 years. The life expectancy of each simulated female was calculated by choosing a random number between 0 and 1 and determining the age in days at which cumulative survival equalled this value.
Starvation body condition threshold (ρs) The body condition of female grey seals declines to around 0.15 at the end of lactation, which would suggest a value of 0.1 for ρs. However, the implications of other values for this parameter are explored in Chapter 7.
Starvation-induced mortality rate (μs) No empirical information that could provide a species-specific value of this parameter for grey seals is available. As a starting point for exploratory modelling we used the value of 0.2 proposed by Hin et al. (2019) but we also explore the implications of other values.
6.2 Model results – pattern-oriented modelling
We compared the DEB models outputs with information from Hall and McConnell (2007), Hanson et al. (2019) and Smout et al. (2019) on the total mass and body condition of calves and adult females at different stages of their life cycle.
Hall and McConnell (2007) found that grey seal pups from the Isle of May lost mass and total body fat during the first 5-6 months of life after leaving the breeding colony, but pups that survived beyond 6 months regained their lost mass. Simulated animals showed a similar pattern of change in total weight and body condition, losing 30% of their weight and most of their reserves in the first 6 months of life. They recovered all of this lost weight over the subsequent 6 months and were 33% heavier than when they left the breeding colony by their first birthday. However, their body condition was substantially higher at this age than the 12% total body fat observed by Hall and McConnell (2007). This suggests that the target body condition for young animals may be lower than for adults.
Hanson et al. (2019) measured changes in the mass of lactating female grey seals at two UK colonies (North Rona and the Isle of May) over a number of years. They found that, on average, the mass of females at the end of lactation was 66% of their post-partum mass. This is very similar to the average change in mass over the course of lactation estimated by Smout et al. (2019) using the same data but a different analytical approach (see below). The mass of simulated grey seal females at the end of lactation was 69% of their post-partum mass, suggesting that the DEB model may underestimate the costs of lactation. This is reflected in the fact that the average weaned weight of simulated pups (32 kg) was lower than the mean weight of weaned pups from the Isle of May colony (~45 kg) studied by Bennett et al. (2007). However, it is not clear whether the pups in Bennett et al.’s (2007) study were a representative sample of all weaned pups.
The model used by Smout et al. (2019) to estimate the effects of female weight at the end of lactation on the probability of giving birth in the following year, described in Section 4.1, also provided an estimate of the average increase in weight over the same period. This was determined by the product of the two parameters δ and εt. δ was estimated to be 1.4 at the Isle of May and 1.34 at North Rona which varied from year to year but, from Figures 3 and 4 of Smout et al. (2019) it appears to have averaged around 1.09 for Isle of May seals and 1.12 for North Rona seals, resulting in an average predicted post-partum mass that was 1.5 x mass at weaning in the previous year. The equivalent value from the DEB model was 1.45.
6.3 Simulating the effect of disturbance
Disturbance was simulated by reducing resource density by a proportion Disteffect on the days on which disturbance was predicted to occur. This has the effect of reducing assimilated energy by the same amount. We modelled the effect of increasing numbers of days of disturbance in the following periods of the annual cycle:
- from the date on which pups are weaned to the day of embryonic implantation (equivalent to the “high” impact period used for harbour seals);
- from implantation to the day on which a decision whether or not to continue a pregnancy is made (equivalent to the “low” impact period used for harbour seals); and
- from this decision day to the mean birthday (equivalent to the “medium” impact period used for harbour seals).
The disturbance effect parameter (Disteffect) was set to either 0.14 or 0.25, based on the values derived from direct observations of tagged harbour seals and harbour porpoises respectively.
We investigated the effects of disturbance on pup survival and birth rate for 1,000 mature adults (20 years of age), and on 1,000 10 year-old females to assess the consequences of the relatively higher cost of pregnancy and lactation for smaller individuals.
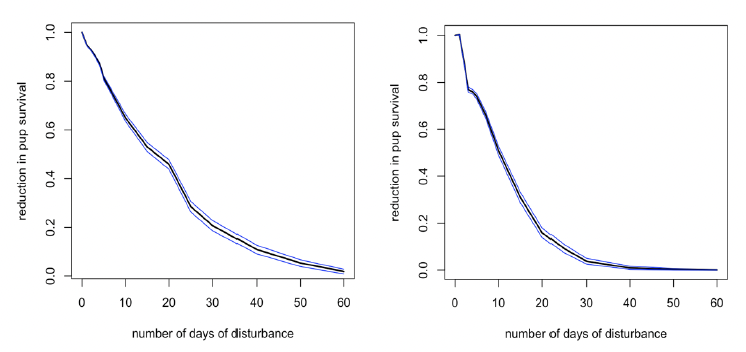
6.3.1 Weaning to implantation
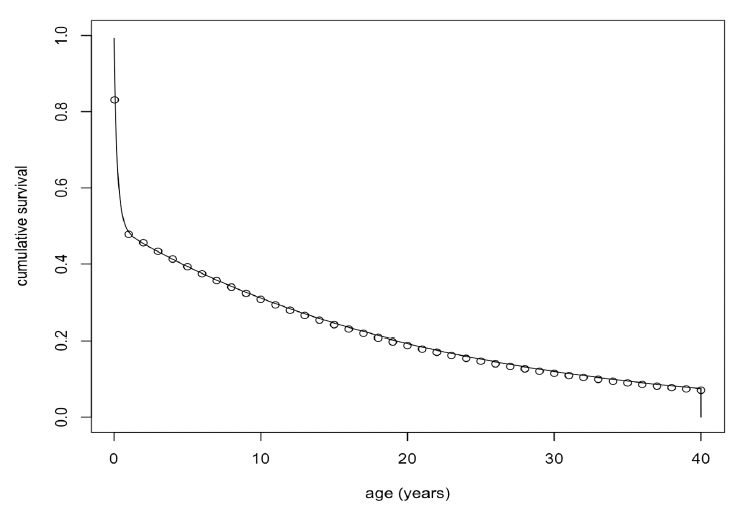
Disturbance in this period (equivalent to December to late March for Farne Islands’ seals) had no effect on birth rate. However, the survival of pups born to fully-grown females (>20 years old) declined steadily with increasing levels of disturbance (Figure 25) and was 0 if disturbance exceeded 60 days if Disteffect =0.14 and if it exceeded 40 days with Disteffect = 0.25. Disturbance had a similar effect on the survival of pups born to younger females, but pup survival was reduced to 0 if disturbance exceeded 15 days, because the undisturbed survival of their pups was lower. For these females there was also a small effect on birth rate, which was reduced by 5% if disturbance exceeded 50 days.
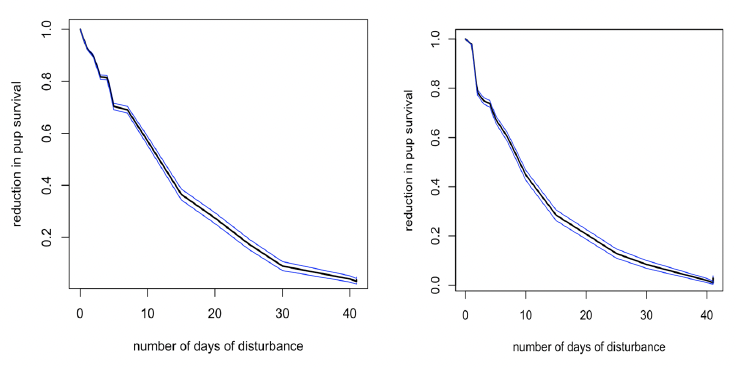
6.3.2 Implantation to “decision day”
Disturbance during this period (equivalent to late March to the end of August for Farne Islands’ seals) had no effect on birth rate for mature females, but it did result in a reduction in pup survival (Figure 26). However, the reduction was slightly less than that caused by disturbance in the immediate post-weaning period.
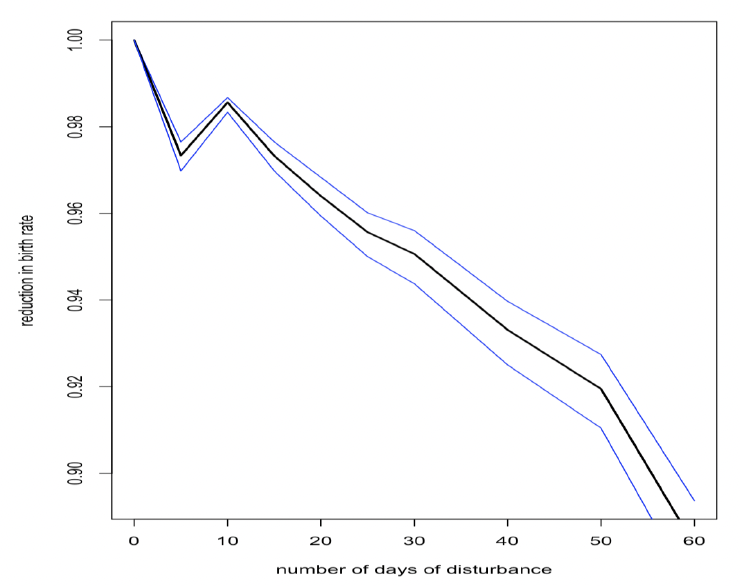
Disturbance during this period also has a small effect on the birth rate of younger females (Figure 27), but the population consequences of this will be trivial because of the high mortality rate experienced by pups born to these females.
6.3.3 “Decision day” to birth of pup
The main effect of disturbance at this time (August to mid-November for Farne Islands’ grey seals) is to reduce the body condition of females at parturition. As a result, their pups are weaned at a lower mass and this affects their subsequent survival, as shown in Figure 28. Pup survival generally declines to zero if the number of days of disturbance exceeds 40 days. However, this would require disturbance to occur on every day during this period.
Contact
Email: ScotMER@gov.scot
There is a problem
Thanks for your feedback