Local Government Candidates Survey 2022
A voluntary demographic survey of candidates running in the Scottish Local Government elections of 2022
This document is part of a collection
4. Previous Political Experience
Candidates were asked whether they had stood for election to a council in the past. Of all who offered a valid response the largest group (49%) were those who had never stood for election to a council previously, followed by those who had previously stood and were elected (33%) and finally those who had previously stood and were not elected (18%) (Figure 1).
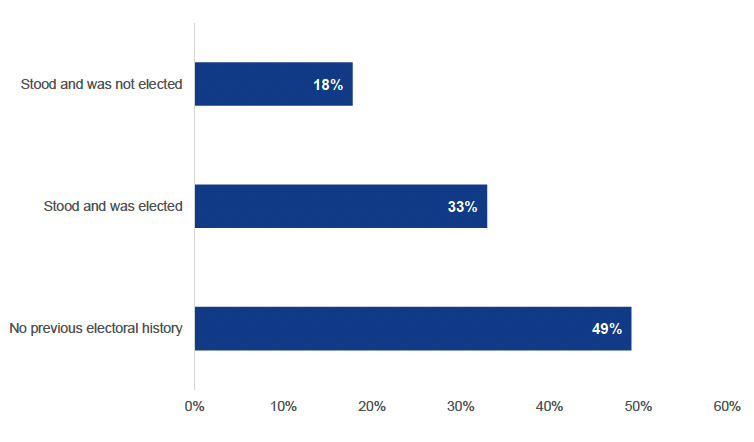
Of those who had previously stood and been elected the total number of years served ranged from less than six months (resulting from a by-election) to forty two years. The average number of years served was 9 years.
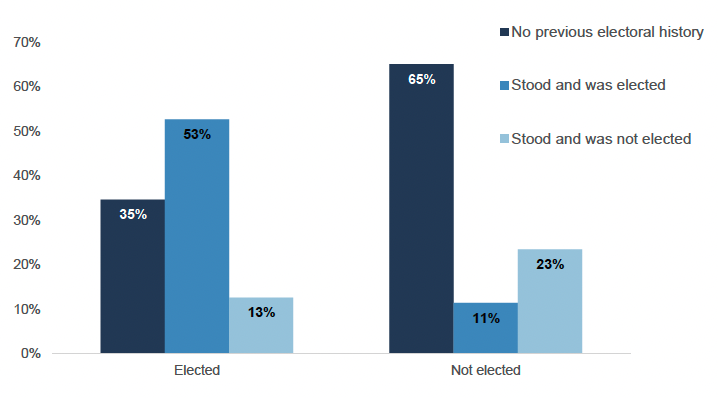
As can be seen in figure 2 above, of those that were not elected in this election the majority (65%) had never stood for election in the past, whereas of those that were successfully elected the majority (53%) had previously stood and been elected in the past.
All candidates were also asked a question regarding their broader political experience, results of which can be seen in the table below (Table 3). Please note that candidates could select more than one option.
| Previous Political Experience |
Responses |
|---|---|
| Been a Community Councillor |
18% |
| Been a Member of the Scottish, UK or European Parliament |
1% |
| Worked as a paid or unpaid party/campaign worker or MSP/MP employee or held party office |
48% |
| Been a public appointee, such as a board member of a public body |
10% |
| None of the above |
23% |
The results suggest that the largest responses were that individuals had worked as a paid or unpaid party/campaign worker, MSP/MP employee or held party office (48%), had none of the noted previous political experience (23%) and having been a Community Councillor (18%).
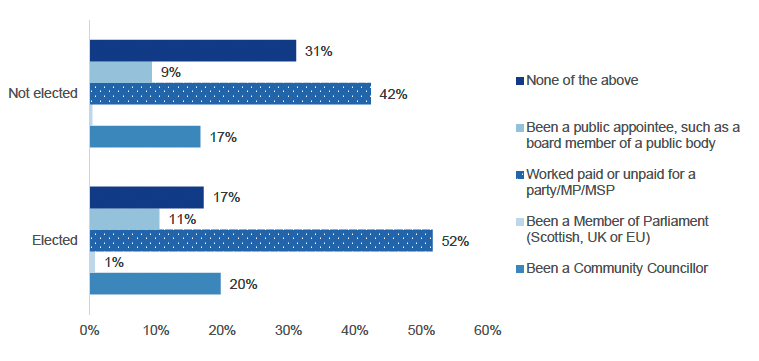
Figure 3 above displays how previous political history was distributed by those who were elected and those who were not. The largest group across both outcomes was having worked paid or unpaid for a party, MP or MSP.
Contact
Email: Arfan.Iqbal@Gov.Scot
There is a problem
Thanks for your feedback