Local Government Candidates Survey 2022
A voluntary demographic survey of candidates running in the Scottish Local Government elections of 2022
This document is part of a collection
9. Sexual Orientation
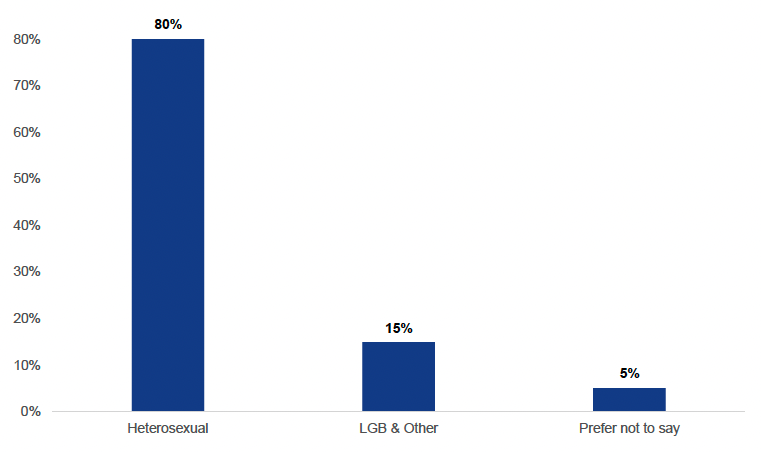
Candidates were asked to describe their sexual orientation with 80% identifying as straight/heterosexual, 15% as lesbian, gay, bisexual or other and 5% preferring not to say.
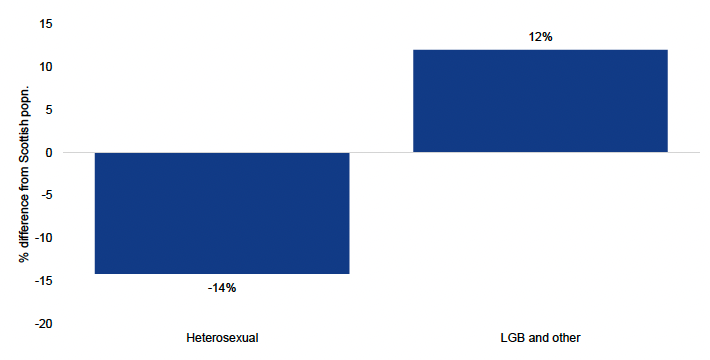
Comparing this to the national picture as identified by the SSCQ dataset we can see that, as per figure 14 below that there was a difference of 12 percentage points compared to the overall population.
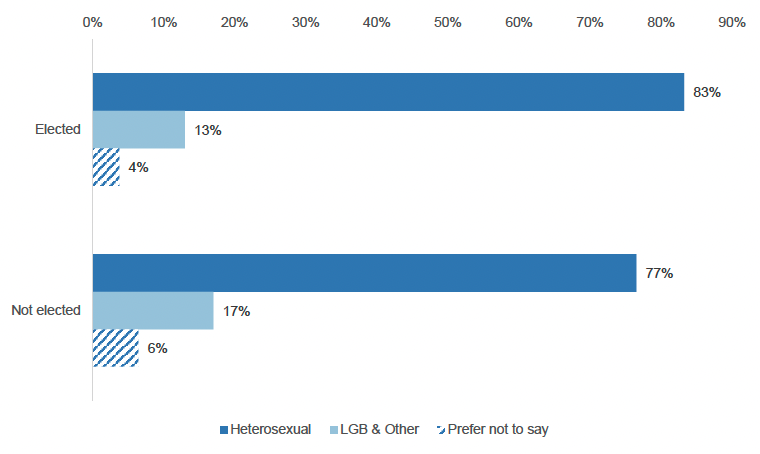
When comparing the profile of elected versus unelected candidates we can see that individuals identifying as heterosexual made up 83% of the elected group, followed by individuals identifying as lesbian, gay, bisexual or in some other away at 13%. For the unelected group individuals identifying as heterosexual made up 77% of the group, followed by individuals identifying as lesbian, gay, bisexual or in some other away at 17%.
Contact
Email: Arfan.Iqbal@Gov.Scot
There is a problem
Thanks for your feedback