iMatter Survey 2022: demographic data exploration
Independent report by Webropol providing detailed information and analysis of staff experience in health and social care across Scotland, broken down by protected characteristics (as stated in Equality Act 2010). This report compiles data from the 2021 and 2022 iMatter survey.
Intersectionality
Intersectionality - Overview
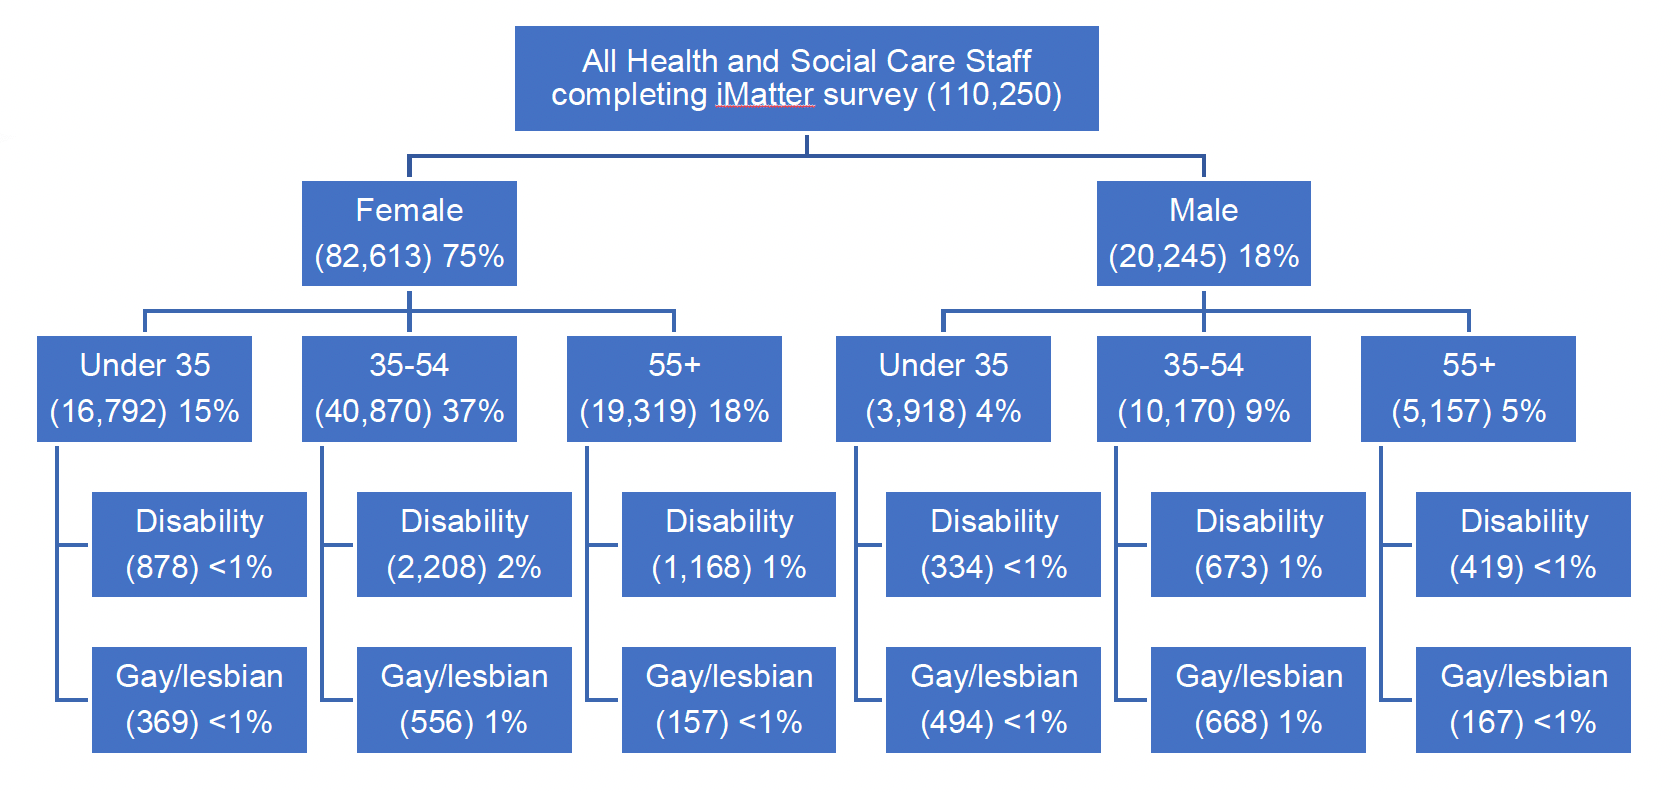
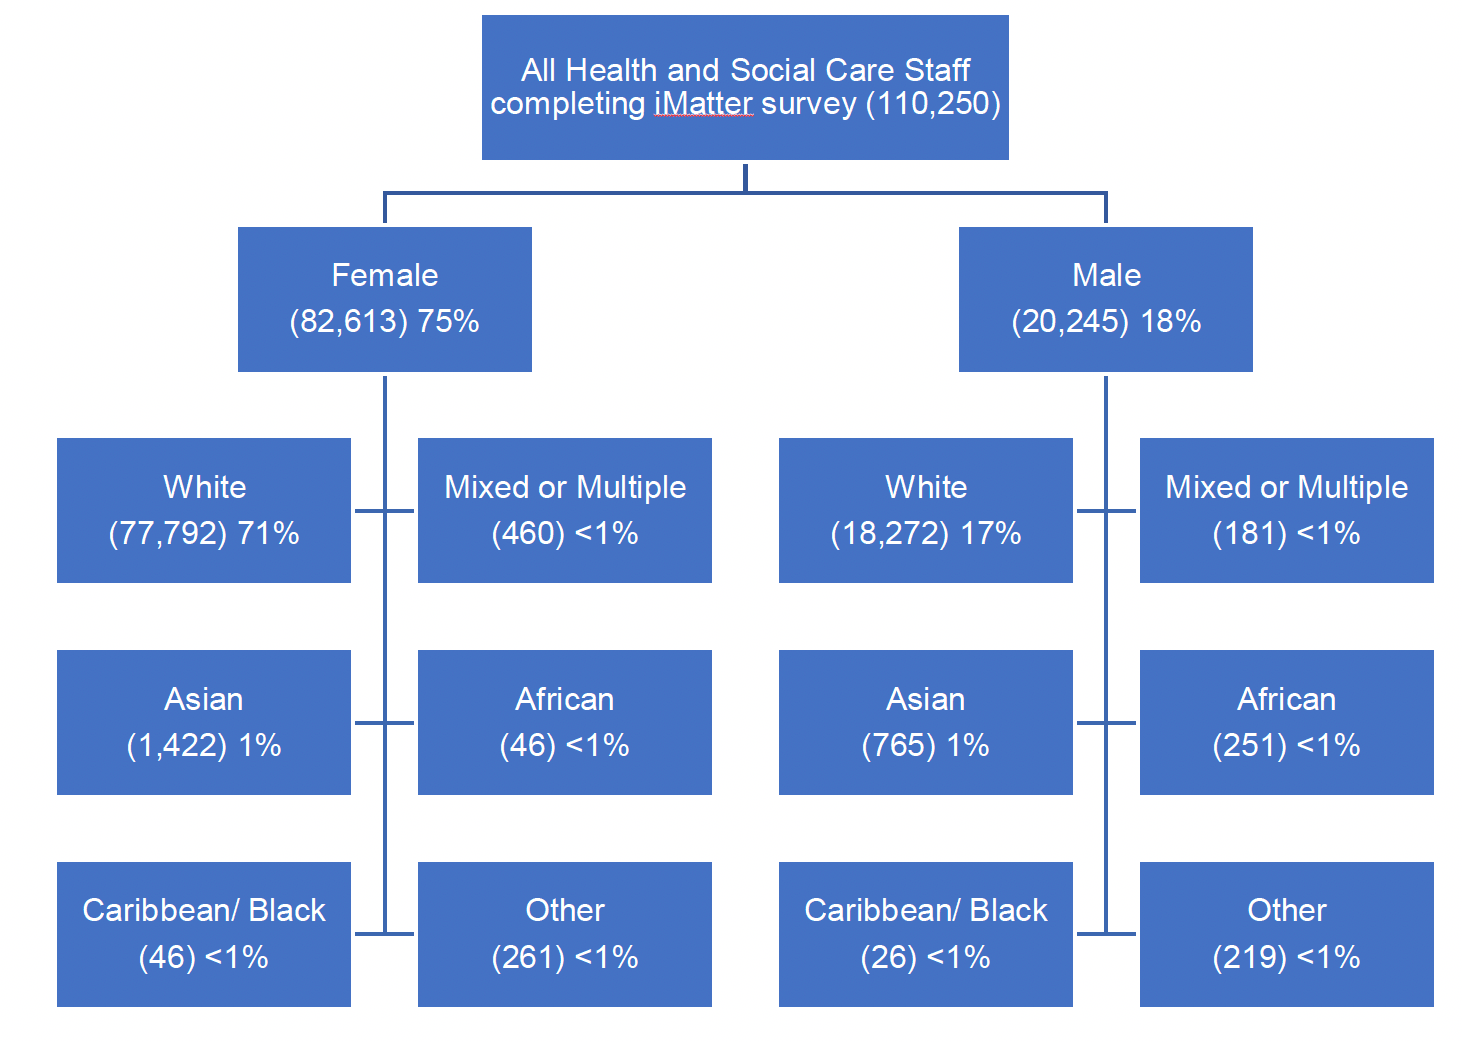
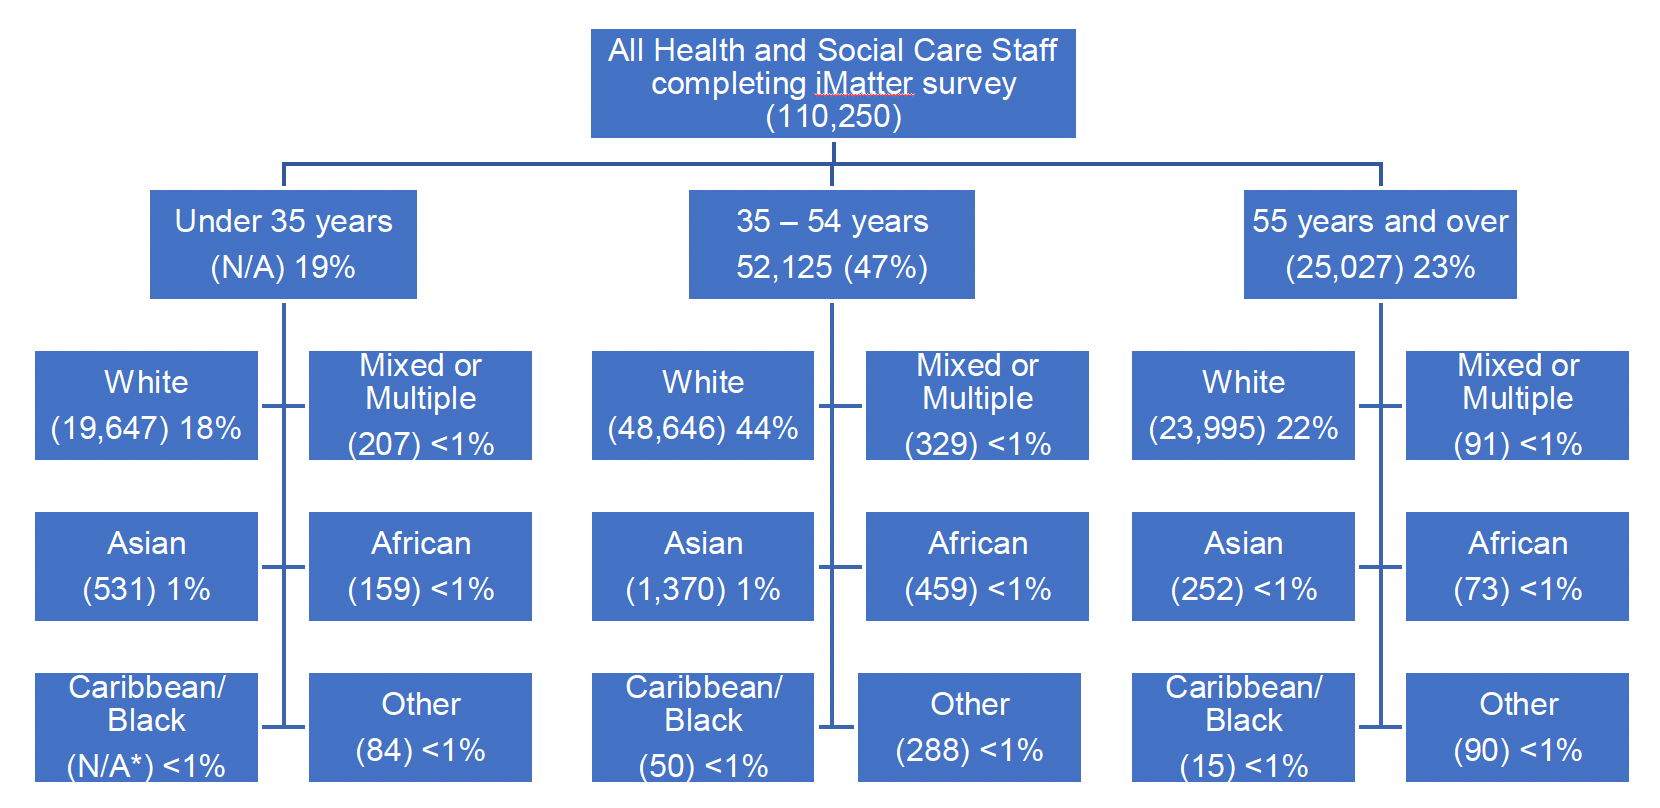
This section contains information on the size of various intersectional groups, by combining more than one demographic characteristic, for example, age and sex.
For each we show both the number of staff identifying within this group from their iMatter survey responses and the percentage of the total responding to iMatter. These percentages are therefore assumed to be indicative of the incidence of these groups across all Health and Social Care staff.
Many of the intersectional groups comprise less than 1% of the Health and Social Care staff and are therefore very much minority groups. Others, whilst still a small share of the total workforce are larger groups that can be explored in more detail.
The same information is included within Appendix 3 in accessible table format.
* Small bases sizes are not shown to protect anonymity
Intersectional Profiles
Within intersectional data there are variations between groups. These are summarised below and further details are included within Appendix 3.
Compared to males, female staff are more likely to be:
- Divorced (+4 percentage points [pp])
- Straight/heterosexual (+5pp)
- White (+4pp)
- Church of Scotland (+6pp)
Compared to older staff, younger staff are more likely to be:
- Female (82% of staff under 25 years are female, compared to 73% of those aged 65 years and over
- Gay, lesbian or bisexual (4% of staff aged under 25 years are gay/lesbian and 7% are bisexual, compared to 1% and <1% of those aged 55 years and over)
- Never (not yet) married, divorced or widowed (30% of those aged 25 – 34 years are married, 1% are divorced and <1% are widowed, 64% of those aged 45 – 64 years are married, 17% of those aged 55 – 64 are divorced and 12% of those aged over 65 years are widowed)
- Without religion (75% of those aged under 25 years have no religion. This falls continually across the age groups to 33% of those aged 65 years and over having no religion.)
Staff who consider themselves disabled are more likely to be:
- Female (75% of those who are disabled are female, compared to 81% of those not disabled)
- Gay, lesbian or bisexual (+3pp for gay/lesbian and +4pp for bisexual)
- Not heterosexual/straight (-8pp)
- Never (not yet) married/been in a civil partnership (36% of disabled staff compared to 29% of staff who are not disabled)
- Older (58% are aged 45 years and over, compared to 54% of those who are not disabled)
Compared to heterosexual/straight staff, gay/lesbian staff are more likely to be:
- Male (55% are male, compared to 19% of those who are heterosexual/straight)
- Under 35 years (+ 16pps: 36% of those who are gay/lesbian are under 35 years, compared to 20% of those who are heterosexual/straight)
- Not married or in a civil partnership (61% of those who are Gay/lesbian are not married/in a civil partnership, compared to 28% of those who are heterosexual/straight)
- Disabled (+6pp with 12% of those who are gay/lesbian being disabled and 6% of those who are heterosexual/straight)
- Without religion (73% of those who are gay/lesbian have no religion, considerably higher than the 55% of those who are heterosexual/straight)
Compared to heterosexual/straight staff, bisexual staff are more likely to be:
- Under 35 years (62% are under 35 years, compared to 20% of those who are heterosexual/straight)
- Trans or have a trans history (+3pps)
- Not married or in a civil partnership (64% compared to 28% of those who are heterosexual/straight)
- Disabled (+13pp, from 6% of those who are heterosexual/straight to 19% of staff who are bisexual)
- Without religion (76% of bisexual staff have no religion compared to 55% of those who are heterosexual/straight
Compared to heterosexual/straight staff, staff who self-describe are more likely to be:
- Male (+9pp)
- Trans or have a trans history (+8pp)
- Not married or in a civil partnership (+18pp; 46% are not married/in a civil partnership compared to 28% of those who are heterosexual/straight)
- Disabled (+9pp)
- Asian or other non-white ethnicity (+2pp)
Compared to non-trans staff, staff who are trans or have a trans history are more likely to be:
- Not married or in a civil partnership (+11pp)
- Under 35 years (31% are under 35 years, compared to 22% of staff who are not trans/do not have a trans history)
- Disabled (+13pp)
Contact
Email: hwfexperience@gov.scot
There is a problem
Thanks for your feedback