Achievement of Curriculum for Excellence (CfE) levels: 2022/23
Achievement of Curriculum for Excellence (CfE) levels: 2022/23 provides information on national performance in literacy and numeracy, based on all pupils in publicly funded Primary 1, Primary 4, Primary 7 and Secondary 3 classes, and for all pupils based in special schools/units.
This document is part of a collection
Chapter 4: Achievement of CfE Levels by pupil characteristics
Key Findings
- Female pupils continue to outperform male pupils across all literacy organisers at all stages.
- Across all stages and organisers, the proportion of pupils achieving the expected level was lower for pupils with an Additional Support Need than for those without.
- For most stages and organisers the proportion of pupils achieving the expected level was lower for pupils with English as an Additional Language than for those for whom English is the main language.
- The percentage of pupils achieving the expected CfE levels in numeracy was generally highest for pupils of Asian-Chinese ethnic background.
- For most stages and organisers the proportions of pupils achieving the expected level were highest for pupils from accessible rural areas and lowest for pupils from remote small towns.
4.1 Achievement of CfE Levels by Sex
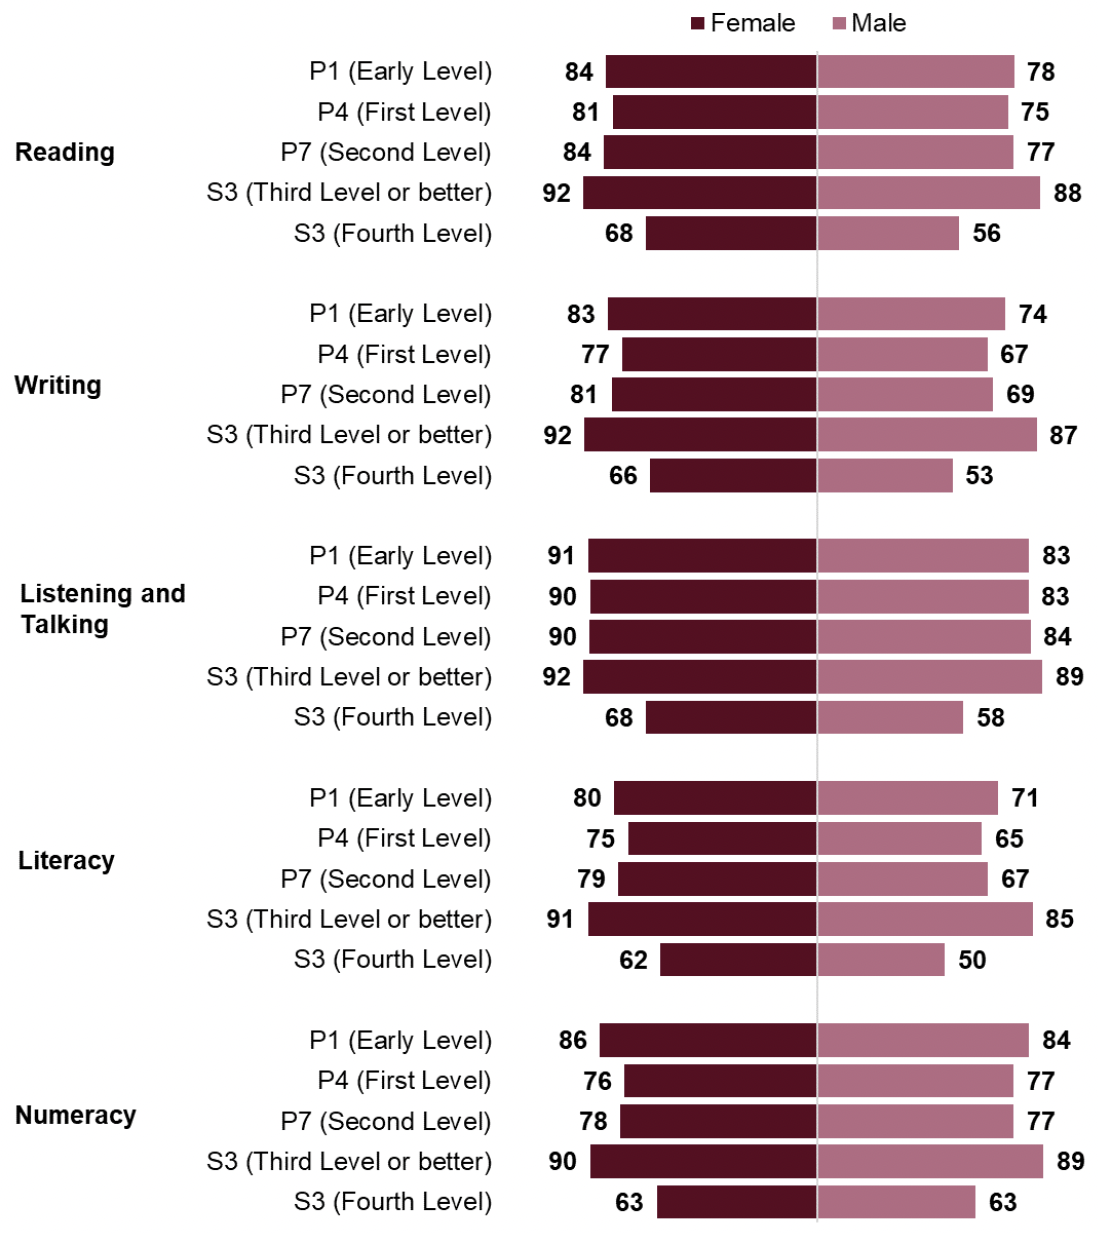
Chart 5 shows performance in literacy and numeracy by sex for each organiser and stage.
In 2022/23, female pupils outperformed male pupils across all literacy organisers at all primary stages and at S3. At each stage the biggest difference was in writing. Female pupils also outperformed male pupils in numeracy in P1, P7 and S3. This pattern of differences in levels of performance between male and female pupils has been largely consistent since 2016/17.
For literacy, female pupils outperformed male pupils by nine percentage points in P1, 10 percentage points in P4 and 11 in P7. A broadly similar pattern was observed in previous years. The gap in literacy performance by sex amongst S3 pupils at Third Level or better was six percentage points.
Across all stages the smallest difference in performance by sex was in numeracy. In 2022/23, female pupils outperformed male pupils by two percentage points at P1 and by one percentage point in P7 and S3. However, male pupils performed slightly better than female pupils at P4.
Compared to 2021/22 (see Table 3 in the supplementary tables), the proportion of pupils achieving the expected CfE levels in 2022/23 has increased across all primary stages and organisers, for both male and female pupils.
The sizes of these increases were broadly similar for male and female pupils. However, compared to 2018/19, the proportions of P7 male pupils achieving Second level are now higher by between two and three percentage points across the organisers. Female pupils in P7 have also recovered to 2018/19 levels but have not yet moved above them.
4.2 Achievement of CfE Levels by Ethnicity
For context, the majority of pupils in the Achievement of CfE Levels data collection were White – Scottish (73 per cent of all pupils), followed by White – non-Scottish (13 per cent of all pupils). The remaining ethnic groups each made up two per cent or less of all pupils. The relative sizes of these groups of pupils should be kept in mind when interpreting results.
In 2022/23, the percentage of primary school pupils achieving the expected CfE Level in literacy and numeracy increased across most ethnic groups compared to 2021/22 (see Table 4 in the supplementary tables). The main exceptions were pupils with an Asian – Chinese or Asian – Other background in P1.
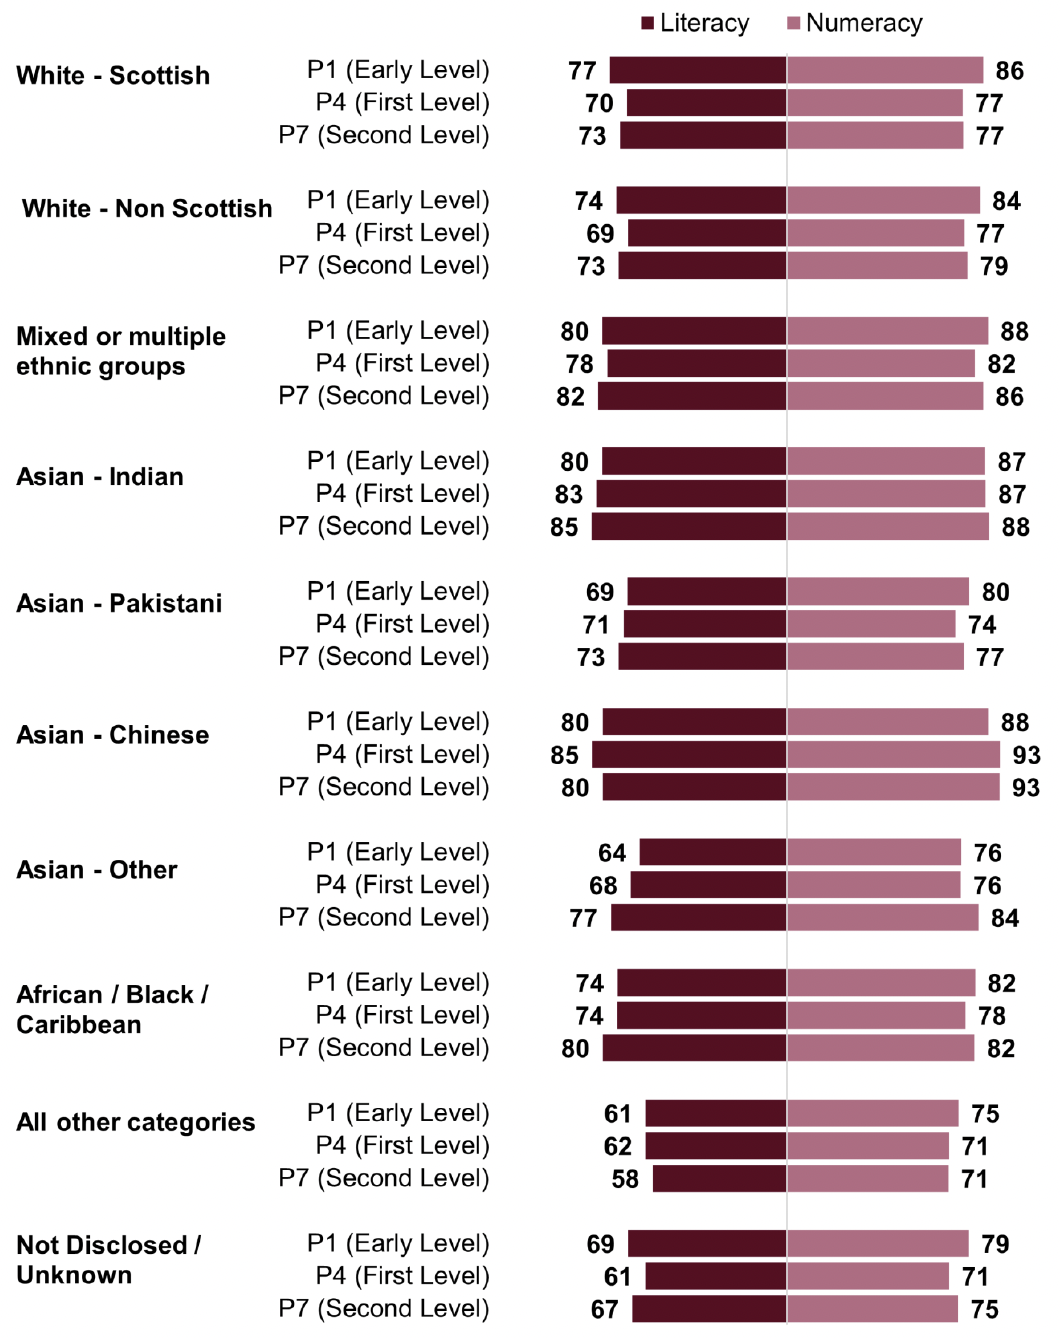
Performance in numeracy was highest for pupils of an Asian – Chinese background, across all primary stages. This pattern has been consistent since 2016/17. In 2022/23, 88 per cent of Asian – Chinese pupils achieved the expected level in P1 whilst 93 per cent of Asian – Chinese pupils achieved the expected level in both P4 and P7.
In P1, performance in literacy was highest for pupils from mixed or multiple ethnic backgrounds, Asian – Chinese and Asian – Indian (all 80 per cent); pupils from Asian – Chinese backgrounds performed best at P4 (85 per cent) and Asian – Indian pupils performed best in P7 (85 per cent).
Chart 6 shows performance in literacy and numeracy by ethnicity for each primary stage.
At S3 (Third Level or better), performance in literacy was highest for pupils from Asian – Indian and Asian – Pakistani backgrounds. In numeracy performance was highest for pupils from Asian – Indian and Asian – Chinese backgrounds (Table 2 below).
| Ethnicity | Reading | Writing | Listening & Talking | Literacy | Numeracy |
|---|---|---|---|---|---|
| White - Scottish | 90 | 89 | 91 | 88 | 89 |
| White - Non Scottish | 90 | 90 | 91 | 88 | 91 |
| Mixed or multiple ethnic groups | 94 | 93 | 94 | 92 | 94 |
| Asian - Indian | 97 | 96 | 97 | 95 | 98 |
| Asian - Pakistani | 96 | 95 | 96 | 94 | 96 |
| Asian - Chinese | 95 | 94 | 94 | 92 | 98 |
| Asian - Other | 92 | 92 | 93 | 91 | 96 |
| African / Black / Caribbean | 92 | 93 | 94 | 91 | 95 |
| All other categories | 82 | 82 | 82 | 80 | 90 |
| Not Disclosed / Unknown | 79 | 78 | 79 | 76 | 85 |
| All pupils | 90 | 89 | 91 | 88 | 90 |
4.3 Achievement of CfE Levels by Additional Support Need (ASN) status
For context, the percentage of pupils recorded as having an Additional Support Need increased throughout the stages: 13, 29, 37 and 41 per cent for P1, P4, P7 and S3 pupils respectively.
The number of pupils identified with additional support needs (ASN) has increased markedly over a number of years and there continues to be year on year increases (see Table 1.5 of the pupil census supplementary tables). These increases were likely due in part to continued improvements in recording and the introduction of the additional need types 'Child plans' and ‘Other’ in 2011. This should be kept in mind when interpreting Achievement of CfE Levels data by Additional Support Needs.
Chart 7 shows that the percentage of pupils achieving the expected CfE level was higher for pupils recorded as not having an Additional Support Need (ASN) compared to pupils with a recorded ASN, across all stages and organisers.
Considering the four organisers – reading, writing, listening and talking and numeracy - the difference in performance in P1 was lowest for numeracy (20 percentage points). At both P4 and P7 stages, the difference was lowest for listening and talking (both 21 percentage points).
At S3 (Third Level or better), the lowest difference was in listening and talking (13 percentage points), with 96 per cent of pupils with no ASN achieving this level, compared to 83 per cent of pupils with a recorded ASN.
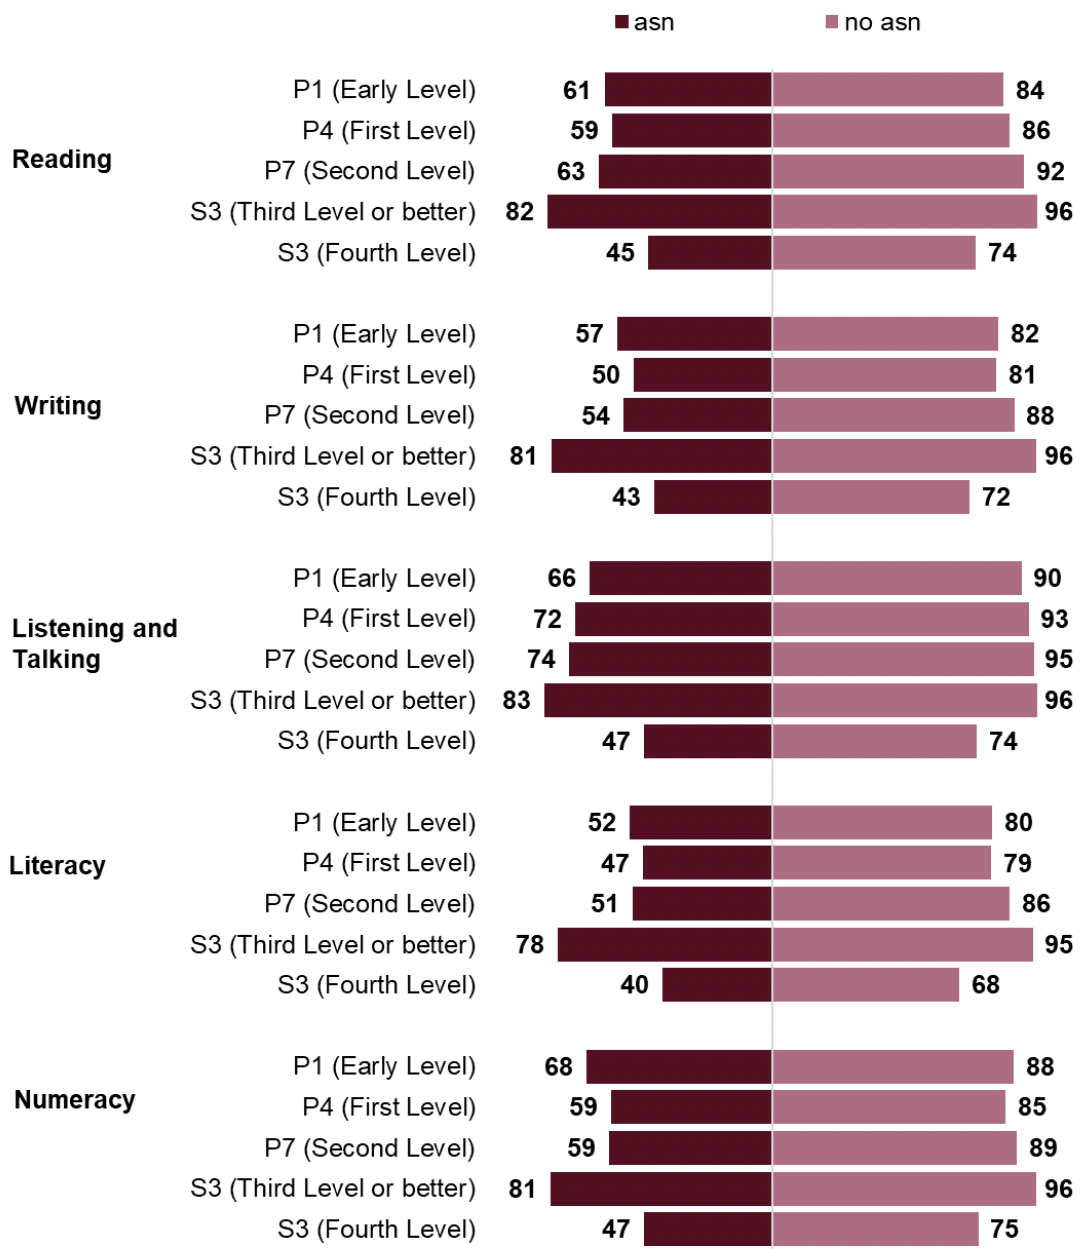
The greatest difference in performance between primary pupils with a recorded ASN and primary pupils with no recorded ASN was in writing for all three stages (25 percentage points for P1, 31 percentage points for P4 and 34 percentage points for P7).
At S3 (Third Level or better), the greatest difference in performance was also in writing (15 percentage points).
Time series data (available in Table 6 in the supplementary tables) shows that the percentage of primary pupils achieving expected CfE levels in 2022/23 was greater than in 2021/22 across all stages and organisers both for pupils with a recorded ASN and for those without. For all primary stages and for S3 Third Level or better, the sizes of these increases were either the same or slightly larger for those with a recorded ASN than for those without.
4.4 Achievement of CfE Levels by English as an Additional Language (EAL) status
For context, around seven per cent of pupils in the 2022/23 data collection were recorded as having English as an Additional Language (EAL).
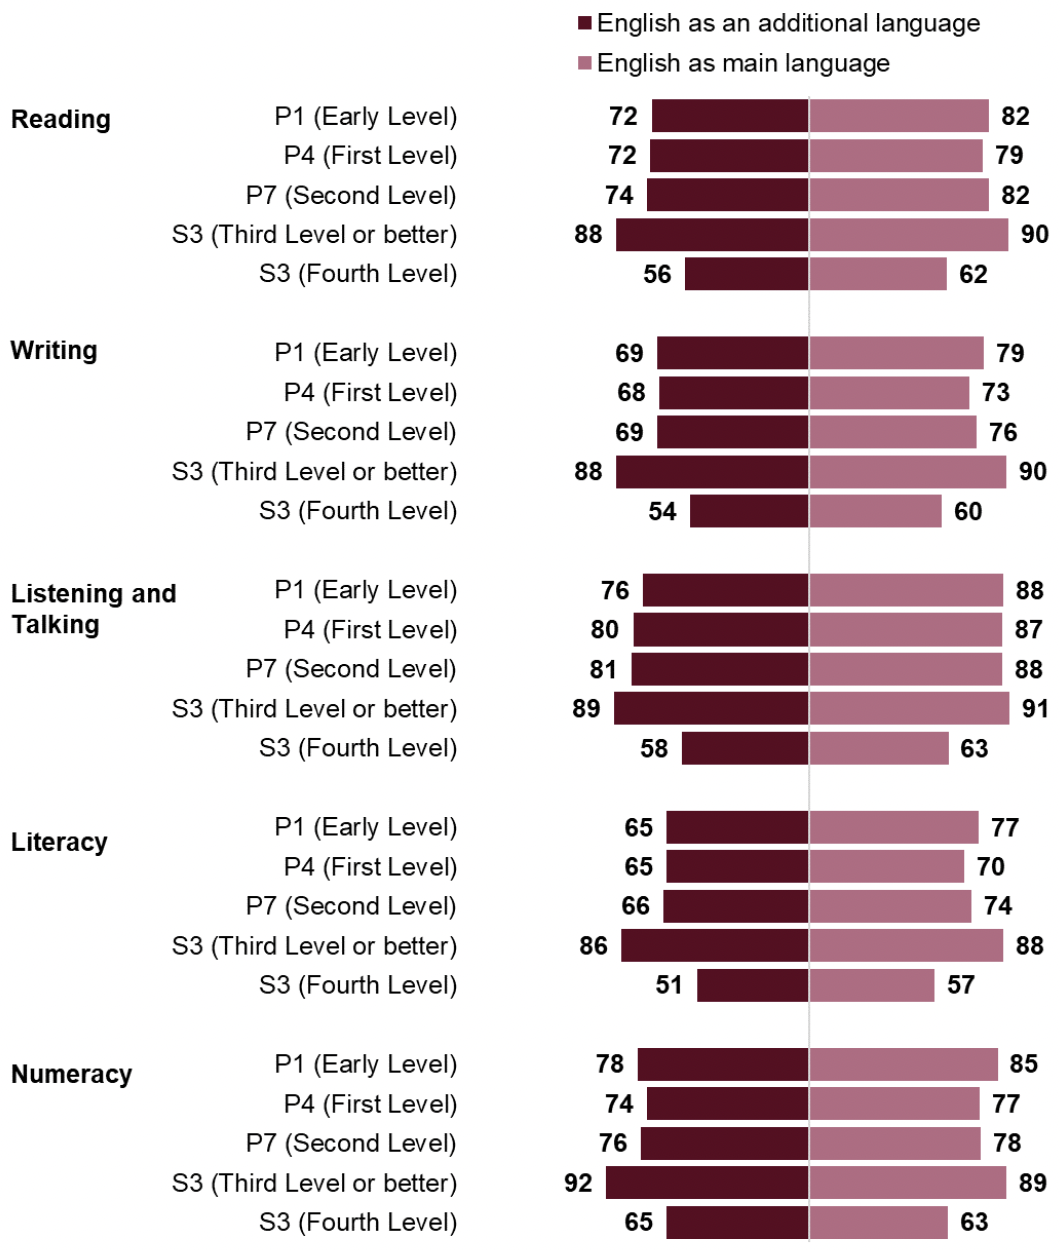
The percentage of pupils achieving the expected CfE level was higher for pupils with English as their main language than for those with English as an additional language across most stages and organisers (Chart 8).
In 2022/23, the gap in performance between EAL pupils and pupils with English as their main language was lowest in numeracy. At primary stages the gaps in numeracy performance ranged from one percentage point for P7 pupils to eight percentage points for P1 pupils. However, S3 pupils with EAL outperformed their counterparts by three percentage points at Third Level or better.
EAL pupils performed better in listening and talking than they did in the other literacy organisers at all three primary stages (76, 80 and 81 per cent for P1, P4 and P7 respectively); with the same pattern being observed in the overall results for all pupils. However, the largest gap in performance between EAL and English as main language was also in listening and talking (12 percentage points at P1).
Compared to 2021/22, the proportions of P4 and P7 school pupils achieving the expected levels in literacy and numeracy increased for both pupils with English as their main language and pupils with English as an Additional Language. In P1 the proportions increased for pupils with English as their main language but remained at around the same as in 2021/22 for pupils with English as an Additional Language.
For S3 pupils (Third level or better) the proportions of pupils achieving the expected levels in literacy and numeracy increased for pupils with English as an additional language, by four percentage points in literacy and by one percentage point in numeracy.
When compared to 2018/19, the proportion of EAL pupils achieving the expected levels had increased across all organisers for pupils in P4, P7 and S3 (both levels). For P1 pupils it had increased in Listening and Talking, decreased in Writing and Numeracy and remained the same in Reading (See Table 7 in the supplementary tables).
4.5 Achievement of CfE Levels by Urban Rural Classification
The Urban Rural Classification used in this publication has six classifications as shown in Table 3. The pupils in the Achievement of CfE Levels 2022/23 data collection were distributed as follows:
Table 3: Percentage of pupils in P1, P4, P7 and S3 combined by Urban Rural Classification, 2022/23
- Other urban areas - 34%
- Large urban areas - 34%
- Accessible rural areas - 15%
- Accessible small towns - 8%
- Remote rural areas - 5%
- Remote small towns - 2%
- Unknown - 2%
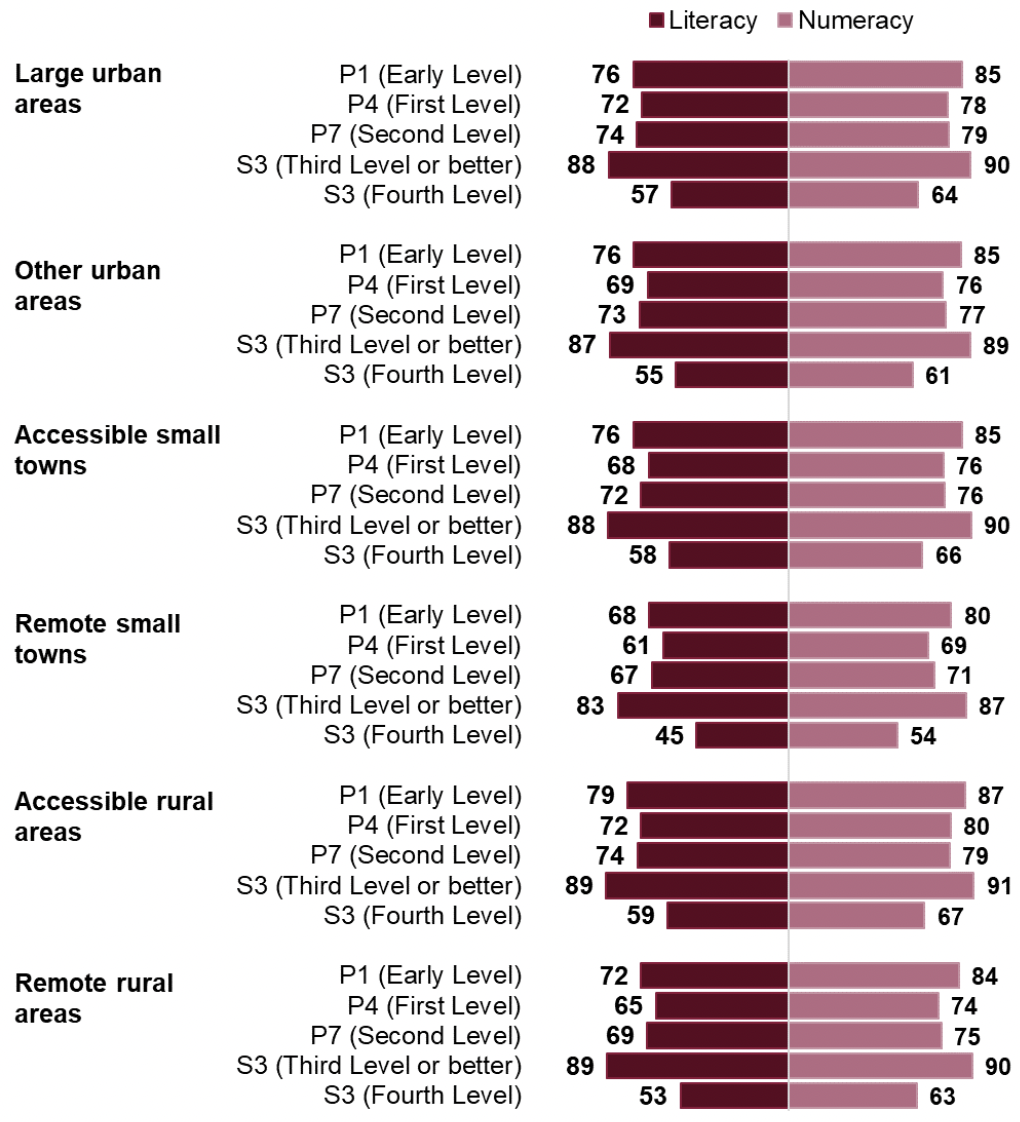
Chart 9 shows a summary of the percentage of pupils achieving expected CfE levels in literacy and numeracy, by Urban Rural Classification and stage. Detailed results by Urban Rural Classification can be found in the supplementary tables.
In P1 and P4, performance across all organisers was highest for pupils from accessible rural areas and lowest for pupils from remote small towns (excluding pupils for whom the Urban Rural Classification was ‘Unknown’).
In P7 performance was again lowest for pupils from remote small towns across all organisers. Performance was highest for pupils from accessible rural areas and large urban areas across all organisers.
In 2022/23, the percentage of primary school pupils achieving the expected CfE levels in literacy and numeracy increased across almost all urban and rural categories, compared to 2021/22. In the small number of cases where they did not increase they remained unchanged (See Table 5 in the supplementary tables).
In S3, as in the primary stages, the percentage of pupils achieving Third Level or better was lowest in remote small towns across all organisers. It was highest in remote rural areas for reading and listening & talking, in accessible rural areas for numeracy, and in remote rural areas and accessible rural areas for writing.
As generally seen at other stages and levels, the proportion of S3 pupils achieving Fourth Level was lowest in remote small towns and highest in accessible rural areas, across all organisers.
Contact
Email: school.stats@gov.scot
There is a problem
Thanks for your feedback