Publication - Statistics
Achievement of Curriculum for Excellence (CfE) levels: 2022/23
Achievement of Curriculum for Excellence (CfE) levels: 2022/23 provides information on national performance in literacy and numeracy, based on all pupils in publicly funded Primary 1, Primary 4, Primary 7 and Secondary 3 classes, and for all pupils based in special schools/units.
This document is part of a collection
Summary
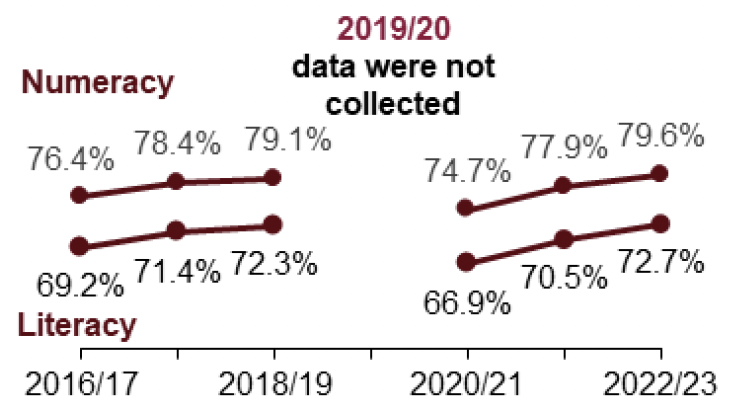
Trend
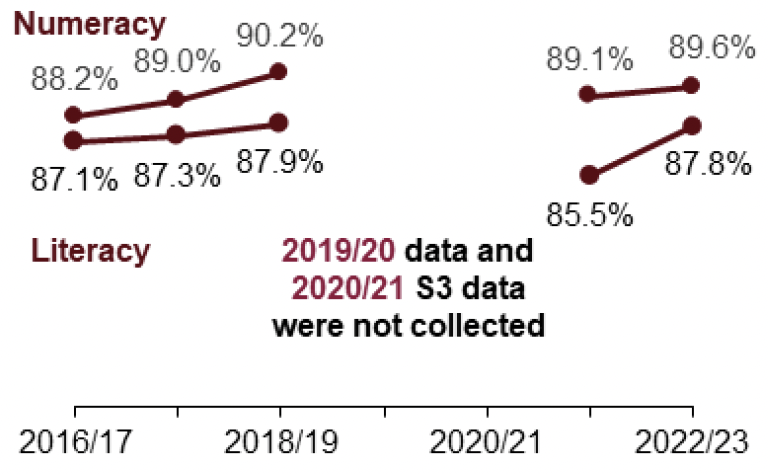
The percentage of pupils achieving the expected CfE Level has increased in 2022/23 across all organisers and stages, as compared to 2021/22. For P1, P4 and P7 combined both literacy and numeracy have risen slightly above 2018/19 levels whilst for S3 (Third Level or better) they remain slightly lower.
Key Staistics
- Around 80% of primary school pupils achieved the expected CfE Level for reading.
- Around 87% of primary school pupils achieved the expected CfE Level for listening and talking.
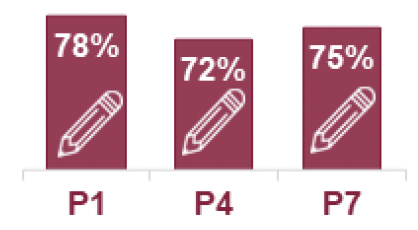
- For writing, 78% of pupils achieved the expected CfE Level in P1. This compares to 72% in P4 and 75% in P7.
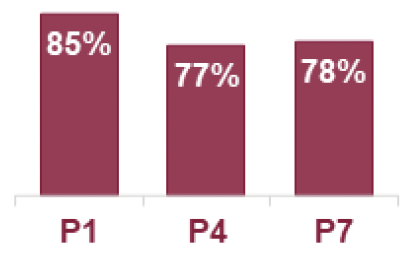
- For numeracy, 85% of pupils achieved the expected CfE Level in P1. This compares to 77% in P4 and 78% in P7.
- Around nine out of ten S3 pupils achieved Third Level or better for listening & talking (91%), reading (90%) and writing (89%).
- Around nine out of ten S3 pupils achieved Third Level or better for numeracy (90%).
- Female pupils outperform male pupils across almost all stages and organisers.
- Across all stages and organisers the proportion of pupils achieving the expected level was lower for pupils with an Additional Support Need than for those without.
- Across all stages and literacy organisers the proportion of pupils achieving the expected level was lower for pupils who have English as an Additional Language than for pupiIs who do not.
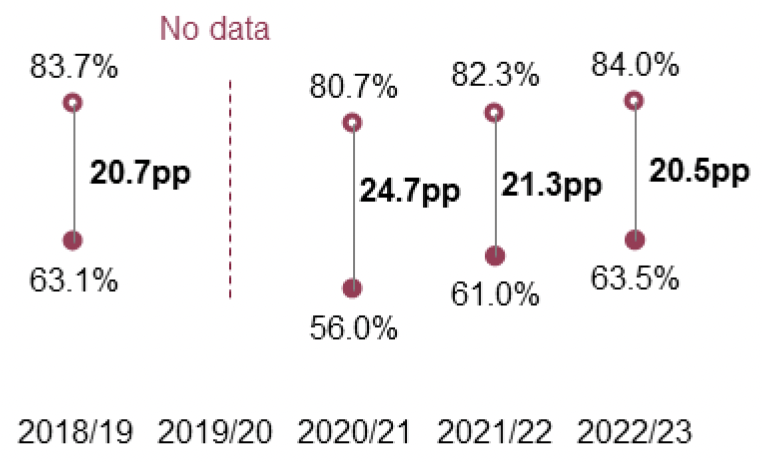
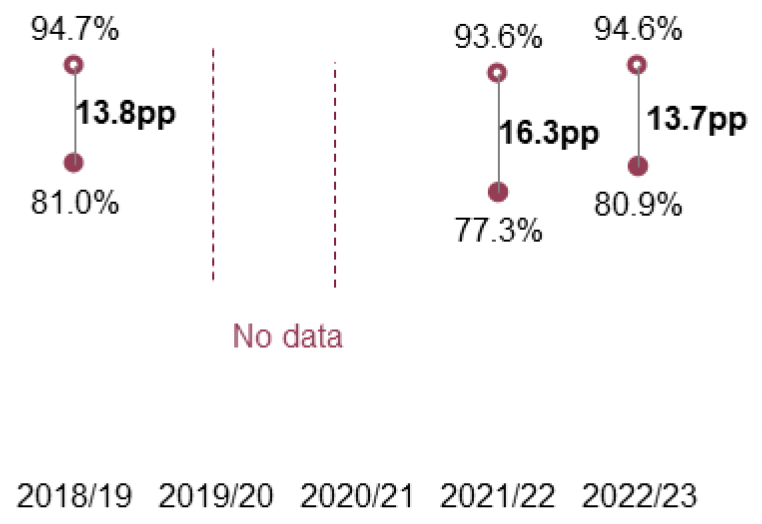
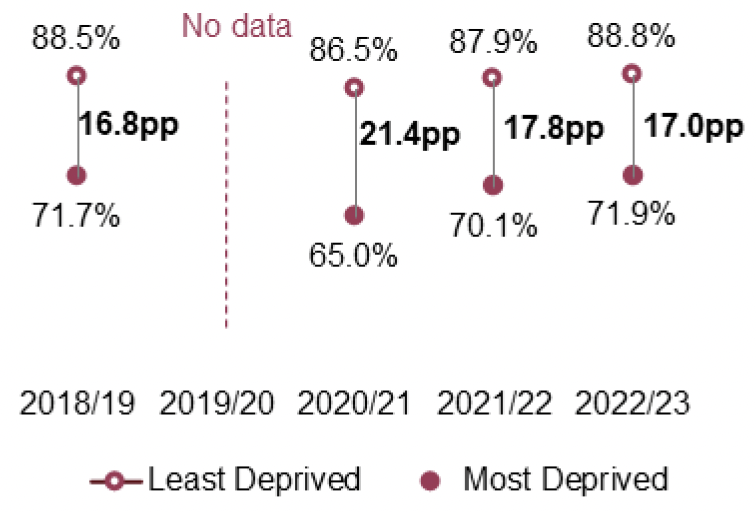
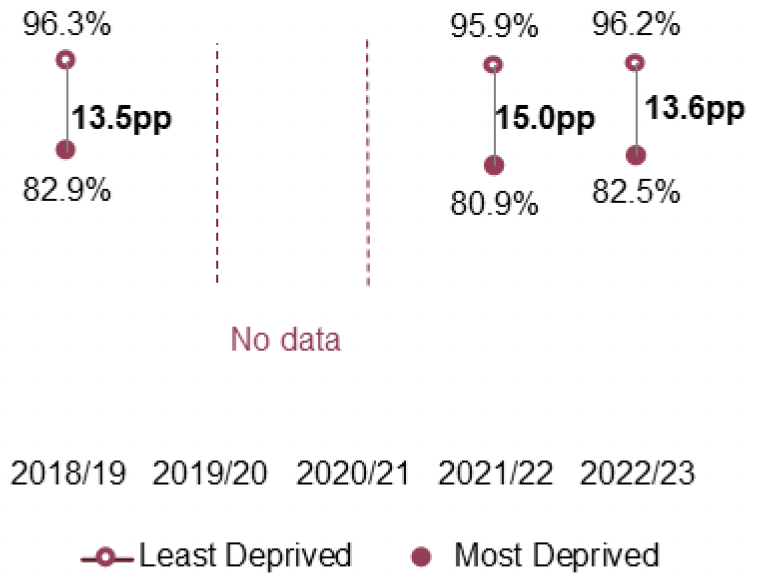
The attainment gap between school pupils in the most and least deprived areas, 2018/19 to 2022/23.
Contact
Email: school.stats@gov.scot
There is a problem
Thanks for your feedback