UK Employer Skills Survey 2022 – Scotland Report
Publication of Scotland results from the UK Employer Skills Survey 2022.
Introduction
The Employer Skills Survey (ESS) 2022 is a large-scale UK-wide telephone survey with employers. This report focuses on employers in Scotland and provides labour market information on the skills challenges faced by Scottish employers and the type of interventions employers engage in to address these challenges. Specifically, this report explores:
- The external skills challenge: skill-shortage vacancies, recruitment and Developing the Young Workforce;
- The internal skills challenge: skills gaps, under-utilisation of skills and the need for upskilling;
- Training and workforce development, including training expenditure;
- Apprenticeships;
- High Performance Working practices; and
- Awareness and use of National Occupational Standards (NOS).
ESS has been conducted at a UK level every two years since 2011. Since 2019, the Employer Perspectives Survey (EPS) has been incorporated into ESS as one survey in England, Northern Ireland and Wales. However, Scotland was covered separately in its own national ESS in 2020 and national Employer Perspectives Survey (EPS) in 2019 and 2021, before joining back for the UK ESS 2022[1].
Findings and data from the ESS informs a number of Scottish Government policies and strategies including:
- Scotland’s National Strategy for Economic Transformation;
- Scotland’s Future Skills Action Plan;
- Post-school education, research and skills – purpose and principles;
- Adult Learning Strategy;
- Fair Work Action Plan;
- Apprenticeships; and
- Scotland’s National Performance Framework
Further information on these policy areas can be found at the links provided.
The UK-wide ESS 2022 survey included a total of 5,207 interviews with Scottish employers, undertaken between June 2022 and March 2023 (72,918 number of interviews were conducted across the UK). This is a robust sample size which covers a range of sectors, regions and establishment sizes and the results are representative of employers across Scotland. The sample was drawn at random from commercial data supplier, Market Location and supplemented with sample from the Inter-Departmental Business Register (IDBR) for subsectors where Market Location coverage was low. Following fieldwork, the data was weighted back to the ONS IDBR population to ensure it was representative.
| Nation | Interviews achieved |
|---|---|
| England | 59,486 |
| Northern Ireland | 3,400 |
| Scotland | 5,207 |
| Wales | 4,825 |
Further information about the ESS method can be found in the Methodology section of this release and the technical report on the Department for Education website.
These statistics are designated as Official Statistics in accordance with the Statistics and Service Registration Act 2007. They have been produced to high professional standards set out in the Code of Practice for Statistics. Further information on Official Statistics is published by the UK Statistics Authority.
Further data can be accessed in published data tables accompanying this report on the Scottish Government website. Accompanying ‘Background Tables’ include underlying data used in the report.
Reporting conventions
The terms “establishment”, and “employer” are used interchangeably throughout this report to avoid repetition.
The survey population is UK businesses with two or more employees; this means businesses with at least two people working on payroll including working proprietors. When reporting volume and density measures, we typically refer to ‘employees’ throughout the report rather than employment.
All differences referred to in the report are statistically significant at the 95% level of confidence. This applies to differences between survey subgroups, such as region, size and sector, and also to differences over time.
Where comparisons are made across regions, this is referring to the Regional Outcome Agreement (ROA region). ‘Appendix A – Glossary’ shows how local authorities match to these ROA region categories.
Throughout the report unweighted base figures are shown on tables and charts to give an indication of the statistical reliability of the figures. These figures are always based on the number of establishments answering a question, as this is the information required to determine statistical reliability.
In the tables, “zero” is denoted as a dash (“-”); and an asterisk is used (“*”) if the figure is larger than zero but less than 0.5%.
In the tables and charts, figures with a base size of fewer than 30 establishments are not reported (a double asterisk, “**”, is displayed instead), and figures with a base size of 30 to 49 are italicised and should be treated with caution as the margin of error for these results is larger and therefore the results are less statistically reliable.
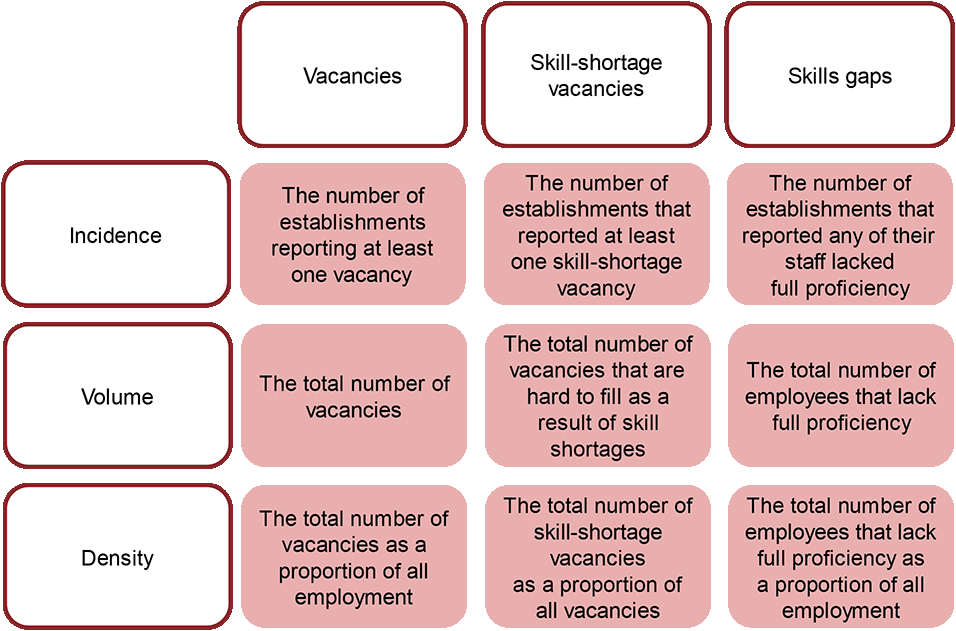
Throughout the report the terms incidence, volume and density are used regarding vacancies, skill-shortage vacancies and skills gaps. They are defined as presented in Figure 1.
Contact
Email: FHEstatistics@gov.scot
There is a problem
Thanks for your feedback